

Longitudinal study on hippocampal subfields and glucose metabolism in early psychosis
- PMID: 39085221
- PMCID: PMC11291638
- DOI: 10.1038/s41537-024-00475-z
Longitudinal study on hippocampal subfields and glucose metabolism in early psychosis
Erratum in
-
Publisher Correction: Longitudinal study on hippocampal subfields and glucose metabolism in early psychosis.Schizophrenia (Heidelb). 2024 Sep 2;10(1):73. doi: 10.1038/s41537-024-00495-9. Schizophrenia (Heidelb). 2024. PMID: 39223166 Free PMC article. No abstract available.
Abstract
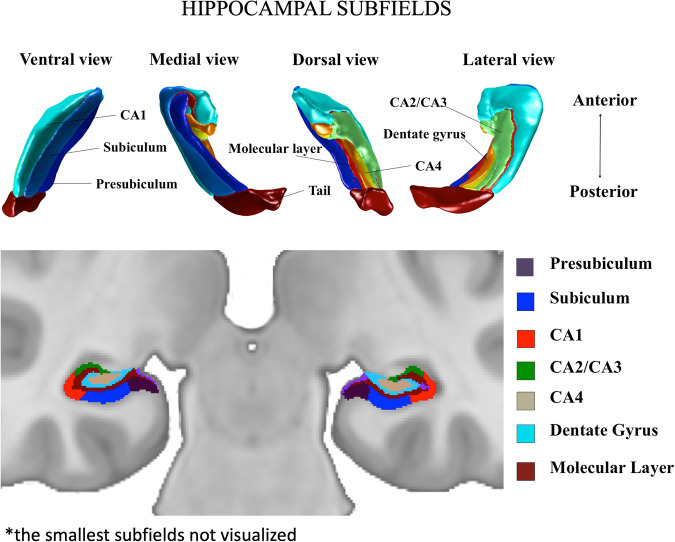
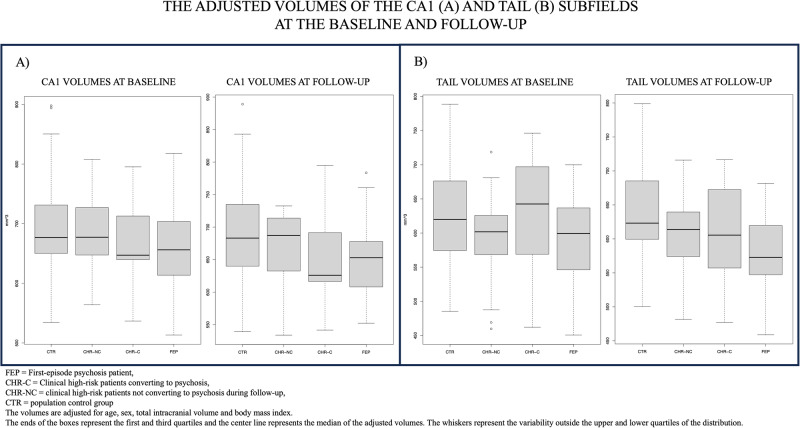
Altered hippocampal morphology and metabolic pathology, but also hippocampal circuit dysfunction, are established phenomena seen in psychotic disorders. Thus, we tested whether hippocampal subfield volume deficits link with deviations in glucose metabolism commonly seen in early psychosis, and whether the glucose parameters or subfield volumes change during follow-up period using one-year longitudinal study design of 78 first-episode psychosis patients (FEP), 48 clinical high-risk patients (CHR) and 83 controls (CTR). We also tested whether hippocampal morphology and glucose metabolism relate to clinical outcome. Hippocampus subfields were segmented with Freesurfer from 3T MRI images and parameters of glucose metabolism were determined in fasting plasma samples. Hippocampal subfield volumes were consistently lower in FEPs, and findings were more robust in non-affective psychoses, with strongest decreases in CA1, molecular layer and hippocampal tail, and in hippocampal tail of CHRs, compared to CTRs. These morphometric differences remained stable at one-year follow-up. Both non-diabetic CHRs and FEPs had worse glucose parameters compared to CTRs at baseline. We found that, insulin levels and insulin resistance increased during the follow-up period only in CHR, effect being largest in the CHRs converting to psychosis, independent of exposure to antipsychotics. The worsening of insulin resistance was associated with deterioration of function and symptoms in CHR. The smaller volume of hippocampal tail was associated with higher plasma insulin and insulin resistance in FEPs, at the one-year follow-up. Our longitudinal study supports the view that temporospatial hippocampal subfield volume deficits are stable near the onset of first psychosis, being more robust in non-affective psychoses, but less prominent in the CHR group. Specific subfield defects were related to worsening glucose metabolism during the progression of psychosis, suggesting that hippocampus is part of the circuits regulating aberrant glucose metabolism in early psychosis. Worsening of glucose metabolism in CHR group was associated with worse clinical outcome measures indicating a need for heightened clinical attention to metabolic problems already in CHR.
© 2024. The Author(s).
Conflict of interest statement
We declare that none of the authors have competing financial or non-financial interests as defined by Nature Portfolio.
Figures


References
LinkOut - more resources
Full Text Sources
Miscellaneous
