. 2024 Aug 1;10(1):66.
doi: 10.1038/s41522-024-00538-0.

Gut microbiota dysbiosis is associated with altered tryptophan metabolism and dysregulated inflammatory response in COVID-19

Affiliations

Gut microbiota dysbiosis is associated with altered tryptophan metabolism and dysregulated inflammatory response in COVID-19

Morgan Essex et al. NPJ Biofilms Microbiomes. .

Abstract

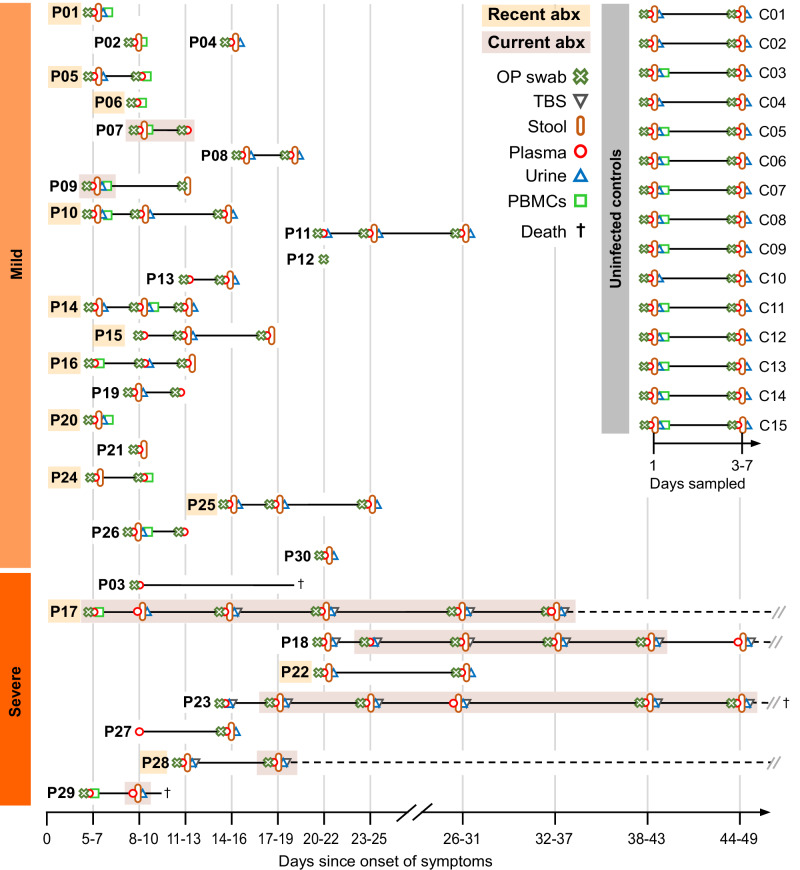
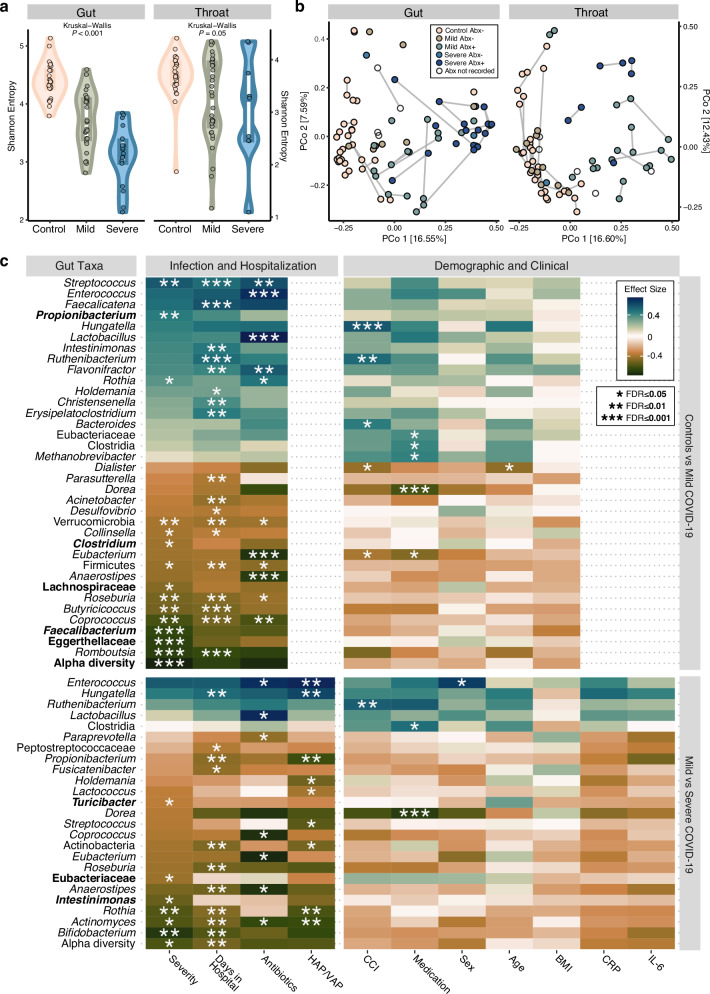
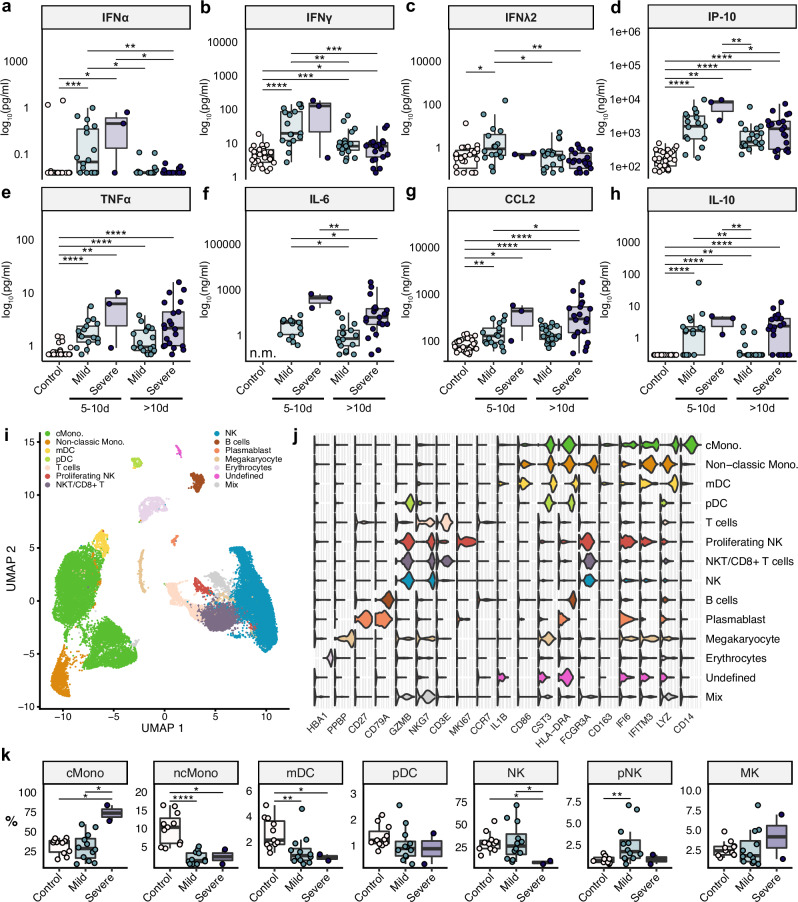
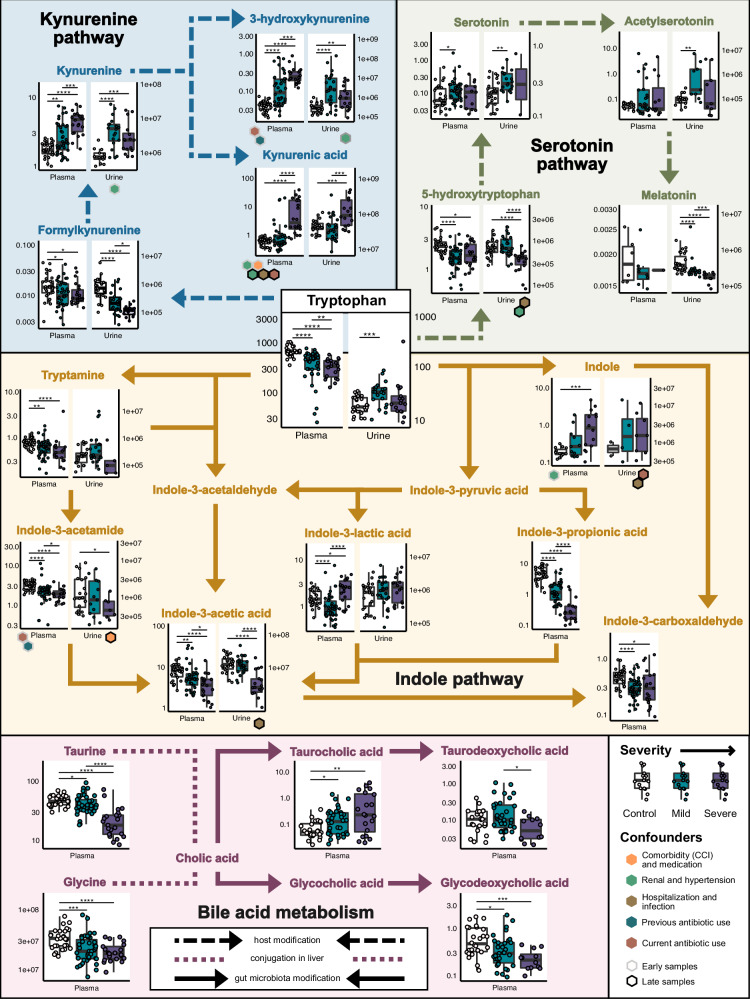
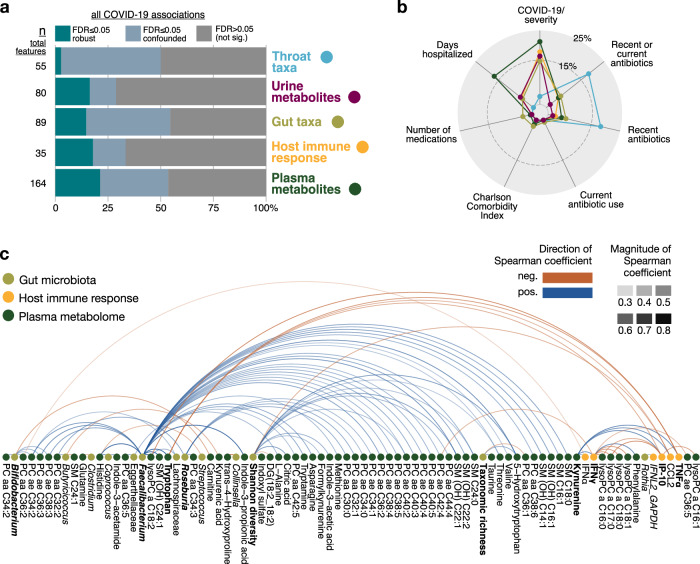
The clinical course of COVID-19 is variable and often unpredictable. To test the hypothesis that disease progression and inflammatory responses associate with alterations in the microbiome and metabolome, we analyzed metagenome, metabolome, cytokine, and transcriptome profiles of repeated samples from hospitalized COVID-19 patients and uninfected controls, and leveraged clinical information and post-hoc confounder analysis. Severe COVID-19 was associated with a depletion of beneficial intestinal microbes, whereas oropharyngeal microbiota disturbance was mainly linked to antibiotic use. COVID-19 severity was also associated with enhanced plasma concentrations of kynurenine and reduced levels of several other tryptophan metabolites, lysophosphatidylcholines, and secondary bile acids. Moreover, reduced concentrations of various tryptophan metabolites were associated with depletion of Faecalibacterium, and tryptophan decrease and kynurenine increase were linked to enhanced production of inflammatory cytokines. Collectively, our study identifies correlated microbiome and metabolome alterations as a potential contributor to inflammatory dysregulation in severe COVID-19.


Conflict of interest statement

The authors declare no competing interests.

Figures

Fig. 1
Fig. 1. Cohort description and sampling timepoints.
Uninfected controls (C1–C15) and enrolled patients (P1–P30) classified by maximum OSCI score. We refer to scores between 1 and 4 as mild and scores between 5 and 8 as severe disease in further discussion. Sampling timepoints are represented according to the days after symptom onset for patients. For uninfected controls, sampling was performed two times, on day 1 and then again 3–7 days after the first sampling. The observation and hospitalization period is marked with a solid line, or a dashed black line when prolonged. Sample materials included oropharyngeal (OP) swabs, plasma, peripheral mononuclear blood cells (PBMCs), urine, stool, and tracheobronchial secretions (TBS). The use of antibiotics shortly before (i.e., recent abx) or during the sampling period (i.e., current abx) is marked for each participant. All control subjects were antibiotic-free for at least 3 months before and during the sampling period.
Fig. 2
Fig. 2. Microbiota compositional changes are associated with COVID-19 severity, hospitalization, and/or antibiotics.
a Alpha diversity (measured as Shannon entropy) of stool and oropharyngeal samples remaining after rarefaction (see “Methods” and Supplementary Figure 1a, b), separated by disease status and severity (measured by OSCI). Box plots display the median (center line), interquartile range (box bounds), and 1.5 times the interquartile range (whiskers). b Beta diversity (principal coordinates analysis, PCoA) on rarefied species abundances, colored to denote disease status and severity as well as any recent or current antibiotic (Abx) intake. c Subset of significant results from our differential abundance and confounder testing of the gut microbiota, comparing uninfected controls to mild disease (i.e., status) and mild to severe disease (i.e., severity; see “Methods”, Supplementary Fig. 1c for the throat microbiota, and Supplementary Table 6 for the full results). Standardized, non-parametric effect sizes were calculated between bacterial abundances and clinical covariates (Spearman for continuous or Cliff’s delta/Wilcoxon for binary variables), and tested for significance. Nested linear models and likelihood ratio tests were then used to disentangle the potentially confounding effects of clinical variables from the disease status or severity (on “naively” disease-associated bacterial taxa from the first step), if possible (see “Methods”). Taxa in bold showed a unique association to the group (control, mild or severe COVID-19) which could be disentangled from covariates. “Antibiotics” refers to any recent or current use and “Medication” is a sum of current medications excluding antibiotics. OSCI ordinal scale for clinical improvement, HAP hospital-acquired pneumonia, VAP ventilator-associated pneumonia, CCI Charlson Comorbidity Index, CRP C-reactive protein, IL-6 interleukin 6, FDR false discovery rate (adjusted).
Fig. 3
Fig. 3. The immune response is dysregulated in severe COVID-19 patients.
ah Plasma levels of IFNs and inflammatory cytokines in healthy controls, mild and severe COVID-19 patients were measured at two different timepoints after symptom onset (5–10 days and ≥10 days after symptom onset). Box plots display the median (center line), interquartile range (box bounds), and 1.5 times the interquartile range (whiskers). i PBMCs from 11 healthy controls and 14 COVID-19 patients (at an early infection phase, i.e., <10 days since symptom onset) were collected, and T and B cells were depleted. UMAP representation of all merged scRNA-seq profiles are shown. 13 cell types were identified by cluster gene signatures. j Violin plots showing top marker genes for the cell types shown in (i). k Relative abundance of major innate immune cells were compared. Their distribution varies between controls and COVID-19 patients and between mild and severe disease. Significant pairwise comparisons are denoted in panels (ah) and (k) (Mann–Whitney U test). See also Supplementary Figure 2. IFNα interferon alpha, IFNγ interferon gamma, IFNλ2 interferon lambda 2, IP-10 interferon gamma-induced protein 10, TNFα tumor necrosis factor alpha, IL-5 interleukin-5, CCL2 CC-chemokin-ligand-2, IL-10 interleukin-10, n.m. not measured; scRNAseq single-cell RNA sequencing, PBMCs peripheral mononuclear blood cells, cMono classical monocytes, ncMono non-classical monocytes, mDC myeloid dendritic cells, pDC plasmacytoid dendritic cells, NK natural killer cells, NKT natural killer T cells, MK megakaryocytes.
Fig. 4
Fig. 4. Severe COVID-19 is associated with tryptophan and bile acid metabolites.
Tryptophan and bile acid metabolite concentrations (given in ng/mL and µM, respectively) from all plasma and urine samples, annotated with adjusted pairwise Spearman test significance and post hoc identified confounders from early or late slices of the data. Box plots display the median (center line), interquartile range (box bounds), and 1.5 times the interquartile range (whiskers). Some co-associated clinical variables were rationally grouped and relabeled here for annotation purposes, i.e., hospitalization and infection reflects confounding by one or more of the following: HAP, number of days hospitalized, bacteremia and/or sepsis. The kynurenine and serotonin pathways are host-associated, while indole and part of the bile acid metabolism are carried out by gut microbes. See also Supplementary Figure 3. CCI Charlson comorbidity index, HAP hospital-acquired pneumonia.
Fig. 5
Fig. 5. Integration of severity associations across -omics spaces identifies correlated features of the gut microbiome, metabolome, and immune response in (severe) COVID-19.
a Summary of association classifications with SARS-CoV-2 infection (from comparison between mild COVID-19 and controls) or disease severity (from comparison between mild and severe COVID-19) across all -omics features after confounder analysis. Plasma metabolites had the highest percentage of total features which were robustly associated with SARS-CoV-2 infection and/or COVID-19 severity. b Main confounding clinical variables for all significant disease or severity associations are shown (i.e., cumulative area of non-gray bars from (a)), as well as an estimate of the percentage of those which were confounded, and if so by what. c Robust associations (FDR ≤ 0.05) between the gut microbiome, plasma metabolome, and host immune response from the subset of features associated with SARS-CoV-2 infection or COVID-19 severity in (a). Bolded features had more than three robust associations with features from another -omics space.

References

    1. Guan, W.-J. et al. Clinical characteristics of coronavirus disease 2019 in China. N. Engl. J. Med.382, 1708–1720 (2020). 10.1056/NEJMoa2002032 - DOI - PMC - PubMed
    1. Huang, C. et al. Clinical features of patients infected with 2019 novel coronavirus in Wuhan, China. Lancet395, 497–506 (2020). 10.1016/S0140-6736(20)30183-5 - DOI - PMC - PubMed
    1. Hadjadj, J. et al. Impaired type I interferon activity and inflammatory responses in severe COVID-19 patients. Science369, 718–724 (2020). 10.1126/science.abc6027 - DOI - PMC - PubMed
    1. Schulte-Schrepping, J. et al. Severe COVID-19 is marked by a dysregulated myeloid cell compartment. Cell182, 1419–1440.e23 (2020). 10.1016/j.cell.2020.08.001 - DOI - PMC - PubMed
    1. Giamarellos-Bourboulis, E. J. et al. Complex immune dysregulation in COVID-19 patients with severe respiratory failure. Cell Host Microbe27, 992–1000.e3 (2020). 10.1016/j.chom.2020.04.009 - DOI - PMC - PubMed

LinkOut - more resources