. 2024 Jul 31;14(1):17711.
doi: 10.1038/s41598-024-68400-z.

Colorectal cancer and inflammatory bowel diseases share common salivary proteomic pathways

Affiliations

Colorectal cancer and inflammatory bowel diseases share common salivary proteomic pathways

Nicole Contran et al. Sci Rep. .

Abstract

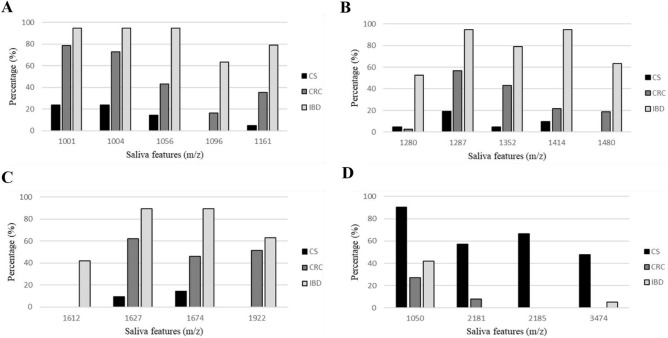
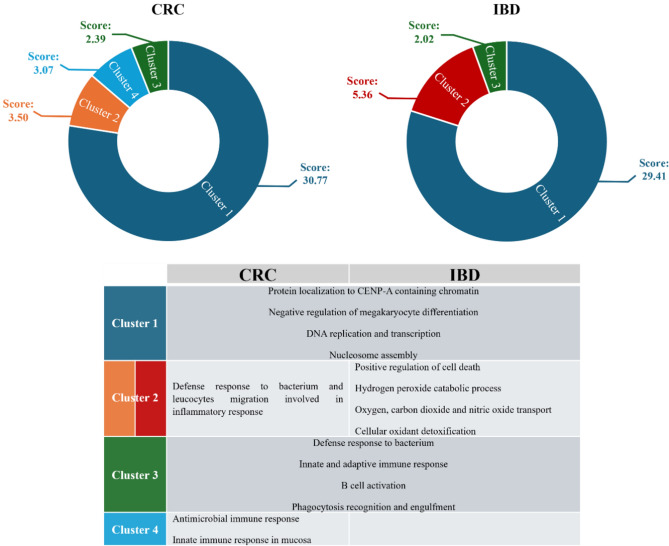
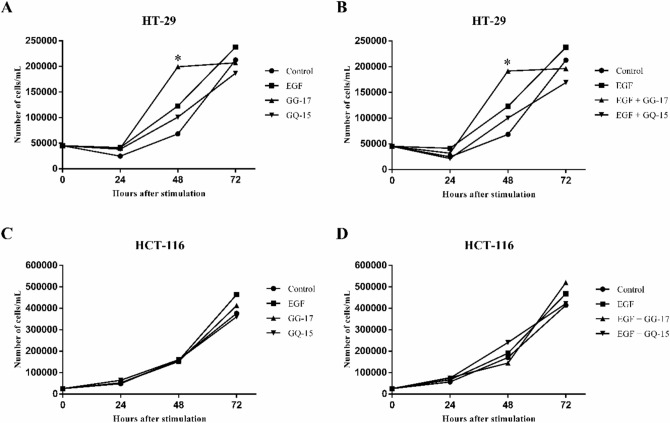
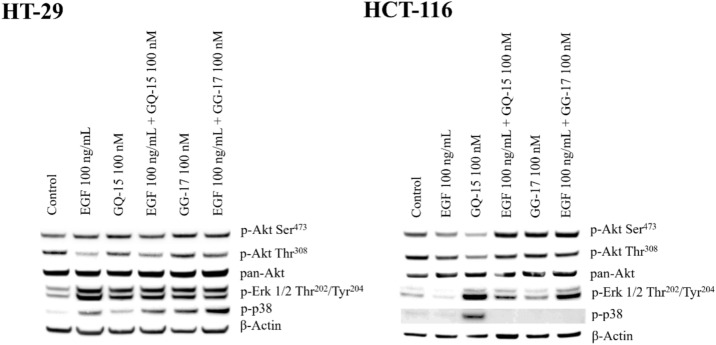
Inflammatory bowels diseases (IBD) are high risk conditions for colorectal cancer (CRC). The discovery of IBD and CRC noninvasive protein/peptide biomarkers using saliva and feces was the aim of this study involving 20 controls, 25 IBD (12 Crohn's Disease-CD), 37 CRC. By untargeted proteomic (LTQ-Orbitrap/MS), a total of 152 proteins were identified in saliva. Absent in controls, 73 proteins were present in both IBD and CRC, being mainly related to cell-adhesion, cadherin-binding and enzyme activity regulation (g-Profiler). Among the remaining 79 proteins, 14 were highly expressed in CD and 11 in CRC. These proteins clustered in DNA replication/expression and innate/adaptive immunity. In stool, endogenous peptides from 30 different proteins were identified, two being salivary and CD-associated: Basic Proline-rich Protein 1 (PRBs) and Acidic Proline-rich Phosphoprotein. Biological effects of the PRBs-related peptides GQ-15 and GG-17 found in CD stool were evaluated using CRC cell lines. These peptides induced cell proliferation and activated Erk1/2, Akt and p38 pathways. In conclusion, the salivary proteome unveiled DNA stability and immunity clusters shared between IBD and CRC. Salivary PRB-derived peptides, enriched in CD stool, stimulate CRC cell proliferation and the pro-oncogenic RAS/RAF/MEK/ERK and PI3K/AKT/mTOR pathways suggesting a potential involvement of PRBs in IBD and cancer pathogenesis.


Conflict of interest statement

The authors declare no competing interests.

Figures

Figure 1
Figure 1
Most significant saliva features (p < 0.0005). The frequencies of positive findings among CRC and IBD patients in comparison with controls (CS) are shown. Panels (A, B, C) represent features found more frequently in CRC and IBD patients with respect to controls. Panel (D) represents features found more frequently in controls with respect to CRC and IBD patients.
Figure 2
Figure 2
Clusters of biological processes in proteins highly represented in CRC with respect to controls (Left) and highly represented in CD with respect to controls (Right), using DAVID tool.
Figure 3
Figure 3
Dose-dependent proliferation experiments with HT-29 (A and B) and HCT-116 (C and D) cell lines. Cells were stimulated with EGF 100 ng/mL, GQ-15 at 0.1 nM and 100 nM, and GG-17 at 0.1 nM and 100 nM synthetic peptides both added alone (panels A and C) or combined (panels B and D) and counted after 24, 48 and 72 h. The percentage of cells/mL counted after 48 h of stimulation relative to the number of unexposed cells/mL counted at 24 h of culture is shown. One-way ANOVA: Panel A, F = 5.163, p = 0.010; Panel B, F = 0.840, p = 0.484; Panel C, F = 0.642, p = 0.597; Panel D, F = 1.441, p = 0.258. * = p < 0.05 by Tukey’s multiple comparison test.
Figure 4
Figure 4
Proliferation experiments with HT-29 (A and B) and HCT-116 (C and D) human colorectal cancer cell lines. Cells were stimulated with EGF 100 ng/mL, GQ-15 100 nM and GG-17 100 nM synthetic peptides both added alone (panels A and C) or combined (Panels B and D) and counted after 24, 48 and 72 h. Repeated measures analysis of variance: (A) time F = 51.63, p < 0.0001; treatment: F = 1.54, p = 0.221; interaction F = 1.63, p = 0.115. (B) Time F = 66.33, p < 0.0001; treatment: F = 2.16, p = 0.109; interaction F = 2.22, p = 0.026. (C) Time F = 141.60, p < 0.0001; treatment: F = 0.042, p = 0.988; interaction F = 0.297, p = 0.974. (D) Time F = 126.80, p < 0.0001; treatment: F = 0.088, p = 0.966; interaction F = 0.311, p = 0.970. Tukey’s multiple comparison test: * p < 0.001 with respect to control (panel A and B) and p < 0.05 with respect to GQ-15 (panel A) or EGF + GQ-15 (panel B) at 48 h. Each point and line report mean values of ten replicated measures. SD for graphical clarity is not shown.
Figure 5
Figure 5
Western blot analyses of HT-29 and HCT-116 cell lines. Both cell lines were stimulated with EGF 100 ng/mL, GQ-15 100 nM, GQ-15 100 nM + EGF 100 ng/mL, GG-17 100 nM, GG-17 100 nM + EGF 100 ng/mL. Proliferation-related targets Akt, Erk 1/2 and p38 are shown. The results of any target were cropped from different blots. Full-length blots are included in the Supplementary Information file.

References

    1. Faye, A. S., Holmer, A. K. & Axelrad, J. E. Cancer in inflammatory bowel disease. Gastroenterol. Clin. N. Am.51, 649–666 (2022). 10.1016/j.gtc.2022.05.003 - DOI - PubMed
    1. Shao, B. Z. et al. The role of autophagy in inflammatory bowel disease. Front. Physiol.12, 621132 (2021). 10.3389/fphys.2021.621132 - DOI - PMC - PubMed
    1. Siegel, R. L., Giaquinto, A. N. & Jemal, A. Cancer statistics, 2024. CA Cancer J. Clin.74, 12–49 (2024). 10.3322/caac.21820 - DOI - PubMed
    1. Sung, H. et al. Global cancer statistics 2020: GLOBOCAN estimates of incidence and mortality worldwide for 36 cancers in 185 countries. CA Cancer J. Clin.71, 209–249 (2021). 10.3322/caac.21660 - DOI - PubMed
    1. Keum, N. & Giovannucci, E. Global burden of colorectal cancer: Emerging trends, risk factors and prevention strategies. Nat. Rev. Gastroenterol. Hepatol.16, 713–732 (2019). 10.1038/s41575-019-0189-8 - DOI - PubMed