. 2024 Aug;56(8):1807-1815.
doi: 10.1038/s12276-024-01291-2. Epub 2024 Aug 1.

Comprehensive molecular characterization of TFE3-rearranged renal cell carcinoma

Affiliations

Comprehensive molecular characterization of TFE3-rearranged renal cell carcinoma

Cho-Rong Lee et al. Exp Mol Med. 2024 Aug.

Abstract

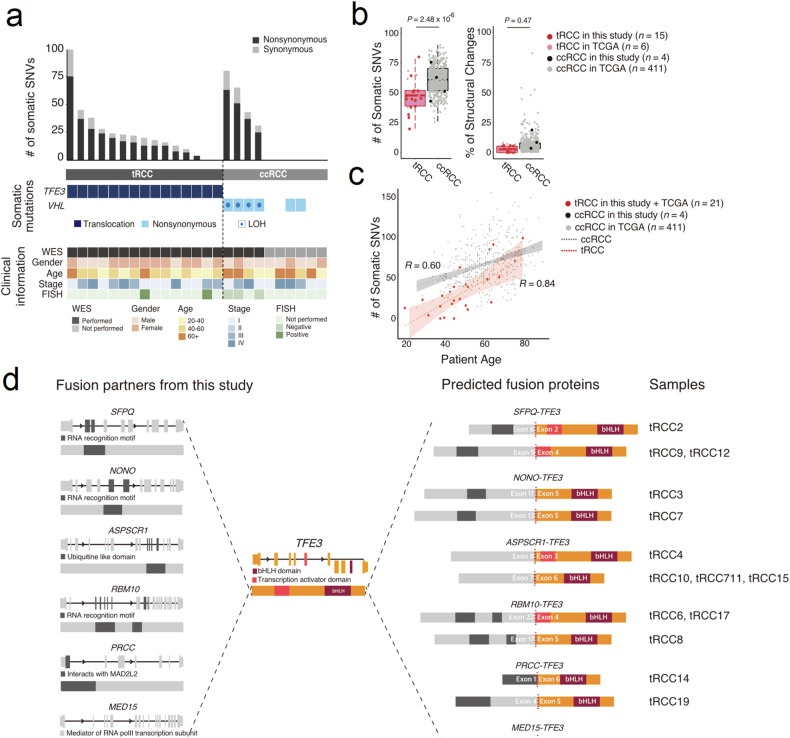
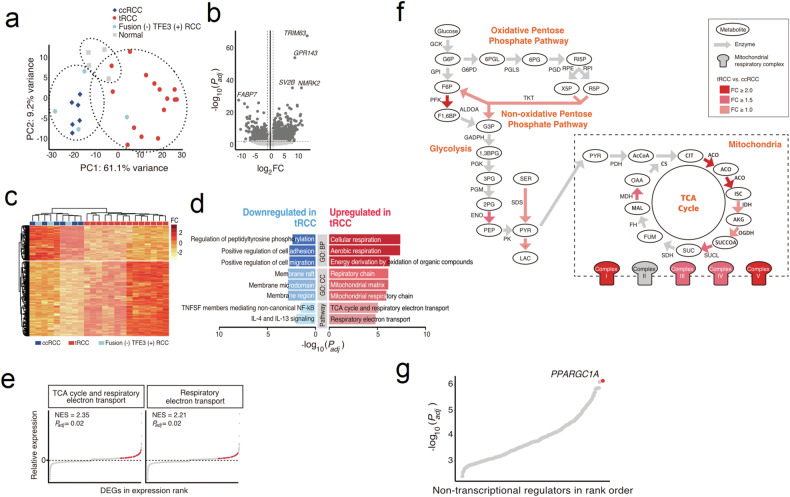
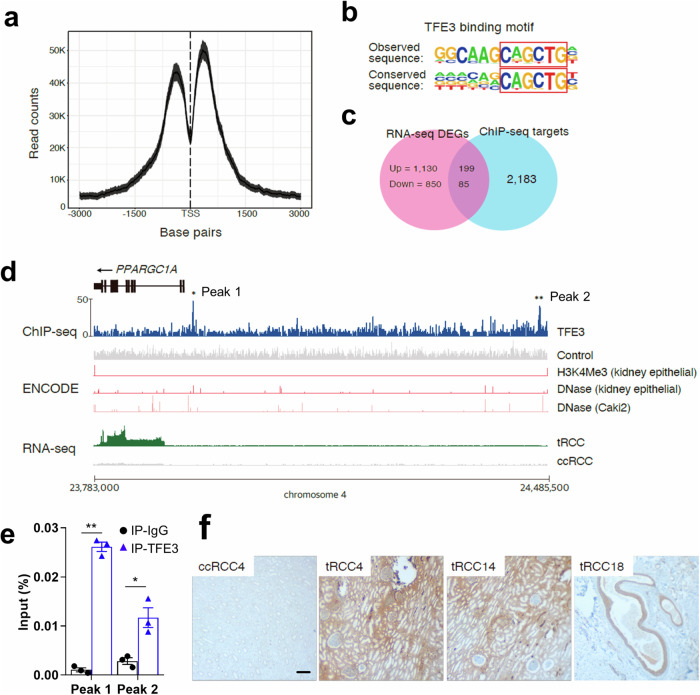
TFE3-rearranged renal cell cancer (tRCC) is a rare form of RCC that involves chromosomal translocation of the Xp11.2 TFE3 gene. Despite its early onset and poor prognosis, the molecular mechanisms of the pathogenesis of tRCC remain elusive. This study aimed to identify novel therapeutic targets for patients with primary and recurrent tRCC. We collected 19 TFE3-positive RCC tissues that were diagnosed by immunohistochemistry and subjected them to genetic characterization to examine their genomic and transcriptomic features. Tumor-specific signatures were extracted using whole exome sequencing (WES) and RNA sequencing (RNA-seq) data, and the functional consequences were analyzed in a cell line with TFE3 translocation. Both a low burden of somatic single nucleotide variants (SNVs) and a positive correlation between the number of somatic variants and age of onset were observed. Transcriptome analysis revealed that four samples (21.1%) lacked the expected fusion event and clustered with the genomic profiles of clear cell RCC (ccRCC) tissues. The fusion event also demonstrated an enrichment of upregulated genes associated with mitochondrial respiration compared with ccRCC expression profiles. Comparison of the RNA expression profile with the TFE3 ChIP-seq pattern data indicated that PPARGC1A is a metabolic regulator of the oncogenic process. Cell proliferation was reduced when PPARGC1A and its related metabolic pathways were repressed by its inhibitor SR-18292. In conclusion, we demonstrate that PPARGC1A-mediated mitochondrial respiration can be considered a potential therapeutic target in tRCC. This study identifies an uncharacterized genetic profile of an RCC subtype with unique clinical features and provides therapeutic options specific to tRCC.


Conflict of interest statement

The authors declare no competing interests.

Figures

Fig. 1
Fig. 1. Genomic profile of tRCC.
a A clinical and genomic overview of 15 pathologically confirmed tRCC and four ccRCC tumors. b Number of somatic SNVs and the genomic portion of structural changes between tRCC and ccRCC samples. c Differences in the correlation between the number of somatic SNVs and patient age. d Schematic diagram representing TFE3 fusion events identified by RNA-seq. For each gene, the upper diagrams denote the gene structure with alternating exons and introns. The lower diagrams show the protein structure. tRCC translocation renal cell carcinoma, ccRCC clear cell renal cell carcinoma, SNVs single nucleotide variations, WES whole exome sequencing, FISH fluorescence in situ hybridization, TCGA The Cancer Genome Atlas, LOH loss of heterozygosity.
Fig. 2
Fig. 2. Transcriptomic profile of tRCC.
a PCA plot of RCC and normal tissues. b Volcano plot, c Heatmap, d GO profiles, and e GSEA results obtained using DEGs in tRCC and ccRCC samples. f Pathways enriched with genes upregulated in tRCC. g Analysis of the master regulators of the DEGs. PCA principal component analysis, tRCC translocation renal cell carcinoma, ccRCC clear cell renal cell carcinoma, GO Gene Ontology, GSEA gene set enrichment analysis, DEGs differentially expressed genes, NES normalized enrichment score, TNFSF tumor necrosis factor superfamily, IL interleukin, TCA tricarboxylic acid, FC fold change.
Fig. 3
Fig. 3. Identification of PPARGC1A as a regulator of tRCC.
a Profile of TFE3 ChIP-seq signals relative to the TSS determined using the UOK146 cell line. b Motif analysis of the TFE3 ChIP-seq results. c Comparison of RNA-seq and ChIP-seq analyses. d TFE3 binding sites in the PPARGC1A upstream region. *P = 1.3 × 109. **P = 8.1 × 10−14. e ChIP‒qPCR analysis of the TFE3 binding sites upstream of PPARGC1A. ChIP‒qPCR was applied to amplify chromatin immunoprecipitated from the PPARGC1A gene promoter with an anti-TFE3 antibody using two independent sets of primers for peaks 1 and 2 in (d). *, 0.001 < P < 0.05. **, P < 0.001. f Immunohistochemical analysis of PPARGC1A in tumor tissues used for genome analysis. Scale bar = 200 µm. ChIP chromatin immunoprecipitation, TSS transcription start site, DEG differentially expressed gene, tRCC translocation renal cell carcinoma, ccRCC clear cell renal cell carcinoma.
Fig. 4
Fig. 4. tRCC cell viability is reduced upon mitochondrial inhibition.
a Relative mitochondrial mass after knocking down TFE3, PPARGC1A, or both in UOK146 cells. b Relative ratio of red versus green JC-1 signals. FCCP was used as a positive control in UOK146 cells. cg Relative cell viability after downregulation of TFE3, PPARGC1A, or both in UOK146 (c), UOK109 (d), UOK120 (e), UOK124 (f), and UOK145 (g) cells. Inhibitors targeting mitochondrial function (oligomycin) and PPARGC1A (SR-18292) were also applied. *0.001 < P < 0.05. **P < 0.001.
Fig. 5
Fig. 5. Depletion of PPARGC1A reduces EMT in tRCC cells.
a, b EMT markers after knocking down PPARGC1A at the mRNA (a) and protein (b) levels. The mRNA and protein expression levels of EMT markers were evaluated by real-time PCR and western blotting, respectively. *0.001 < P < 0.05. **P < 0.001. c Cell migration analysis after knocking down PPARGC1A in UOK146 cells. In vitro cell migration was assessed using transfilter migration assays; representative images of migrated cells are shown. siControl control siRNA, siPPARGC1A siRNA for PPARGC1A.

References

    1. Wei, S. et al. Molecular characterization of TFE3-rearranged renal cell carcinoma: a comparative study with papillary and clear cell renal cell carcinomas. Mod. Pathol.37, 100404 (2024). 10.1016/j.modpat.2023.100404 - DOI - PubMed
    1. Argani, P. MiT family translocation renal cell carcinoma. Semin. Diagn. Pathol.32, 103–113 (2015). 10.1053/j.semdp.2015.02.003 - DOI - PubMed
    1. Kauffman, E. C. et al. Molecular genetics and cellular features of TFE3 and TFEB fusion kidney cancers. Nat. Rev. Urol.11, 465–475 (2014). 10.1038/nrurol.2014.162 - DOI - PMC - PubMed
    1. Malouf, G. G. et al. Transcription factor E3 and transcription factor EB renal cell carcinomas: clinical features, biological behavior and prognostic factors. J. Urol.185, 24–29 (2011). 10.1016/j.juro.2010.08.092 - DOI - PubMed
    1. Qiu Rao et al. Renal cell carcinoma in children and young adults: clinicopathological, immunohistochemical, and VHL gene analysis of 46 cases with follow-up. Int. J. Surg. Pathol.19, 170–179 (2011). 10.1177/1066896909354337 - DOI - PubMed

MeSH terms

Substances