. 2024 Aug;56(8):1791-1806.
doi: 10.1038/s12276-024-01290-3. Epub 2024 Aug 1.

Unique expression and critical role of metallothionein 3 in the control of osteoclastogenesis and osteoporosis

Affiliations

Unique expression and critical role of metallothionein 3 in the control of osteoclastogenesis and osteoporosis

Shenzheng Mo et al. Exp Mol Med. 2024 Aug.

Abstract

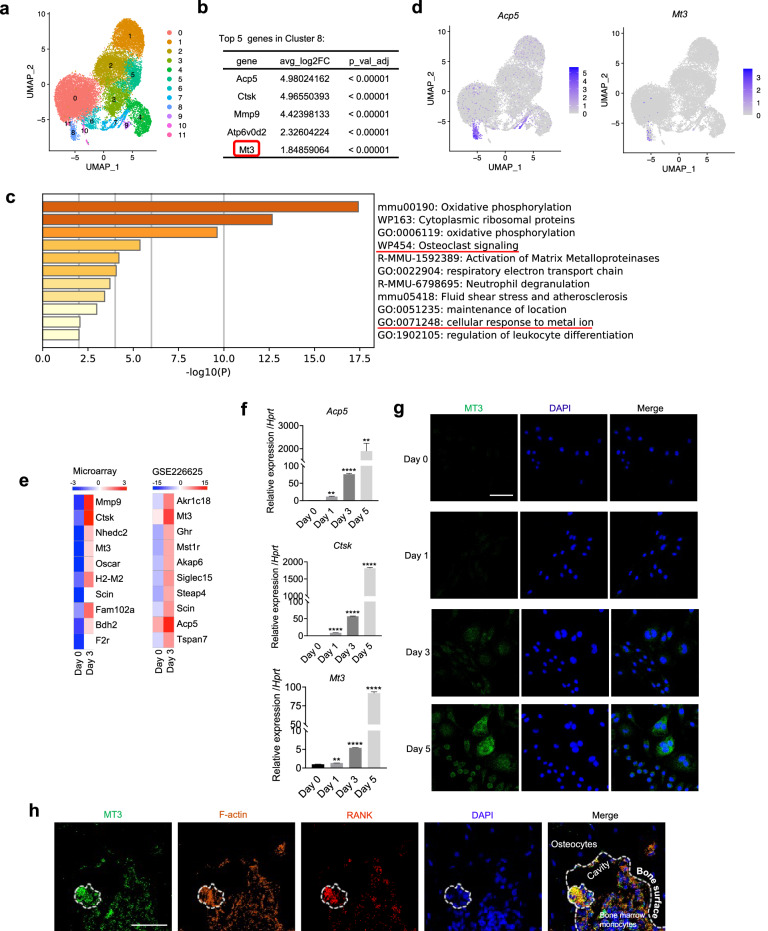
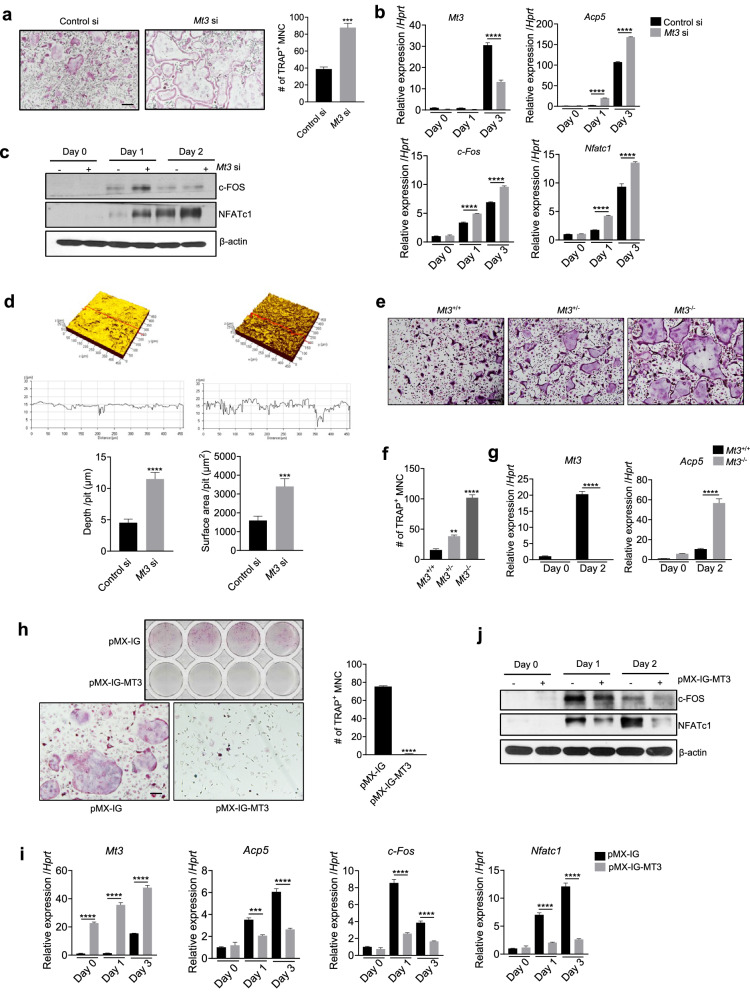
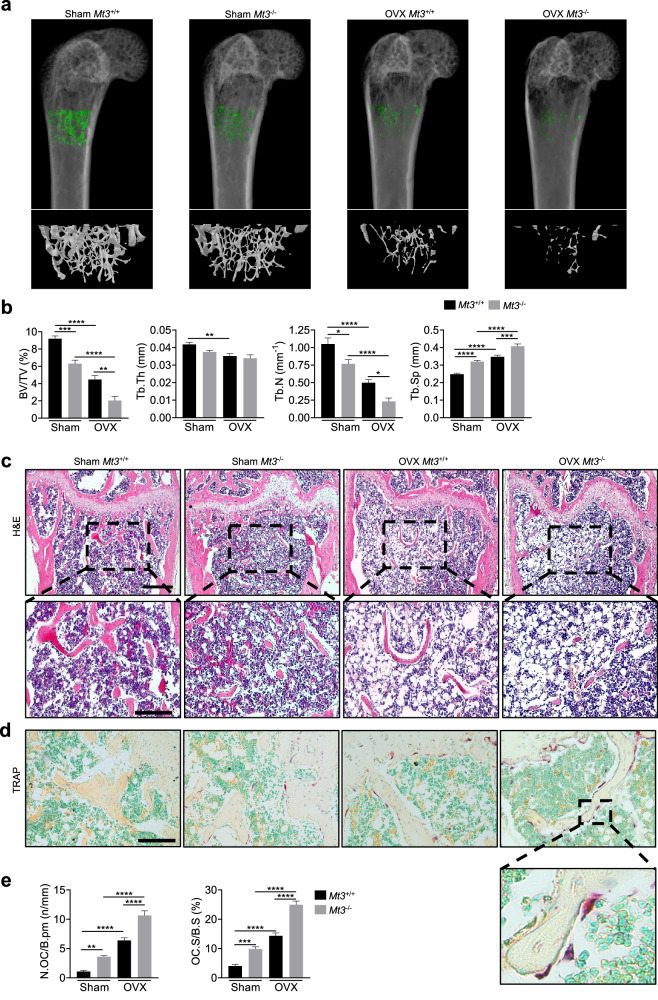
Bone homeostasis is maintained by an intricate balance between osteoclasts and osteoblasts, which becomes disturbed in osteoporosis. Metallothioneins (MTs) are major contributors in cellular zinc regulation. However, the role of MTs in bone cell regulation has remained unexplored. Single-cell RNA sequencing analysis discovered that, unlike the expression of other MT members, the expression of MT3 was unique to osteoclasts among various macrophage populations and was highly upregulated during osteoclast differentiation. This unique MT3 upregulation was validated experimentally and supported by ATAC sequencing data analyses. Downregulation of MT3 by gene knockdown or knockout resulted in excessive osteoclastogenesis and exacerbated bone loss in ovariectomy-induced osteoporosis. Transcriptome sequencing of MT3 knockdown osteoclasts and gene set enrichment analysis indicated that the oxidative stress and redox pathways were enriched, which was verified by MT3-dependent regulation of reactive oxygen species (ROS). In addition, MT3 deficiency increased the transcriptional activity of SP1 in a manner dependent on intracellular zinc levels. This MT3-zinc-SP1 axis was crucial for the control of osteoclasts, as zinc chelation and SP1 knockdown abrogated the promotion of SP1 activity and osteoclastogenesis by MT3 deletion. Moreover, SP1 bound to the NFATc1 promoter, and overexpression of an inactive SP1 mutant negated the effects of MT3 deletion on NFATc1 and osteoclastogenesis. In conclusion, MT3 plays a pivotal role in controlling osteoclastogenesis and bone metabolism via dual axes involving ROS and SP1. The present study demonstrated that MT3 elevation is a potential therapeutic strategy for osteolytic bone disorders, and it established for the first time that MT3 is a crucial bone mass regulator.


Conflict of interest statement

The authors declare no competing interests.

Figures

Fig. 1
Fig. 1. MT3 is upregulated during osteoclast differentiation.
a–d Analyses of the scRNA-seq data of synovial mononuclear phagocytes (GSE134420). Uniform manifold approximation and projection (UMAP) visualization of 12 distinct clusters (a). Top 5 genes highly expressed in Cluster 8 (b). The results of the Metascape enrichment analysis are shown in ranked order for Cluster 8 (c). Gene expression overlaid on UMAP visualization (d). e Heatmaps depicting the top 10 genes with the highest fold changes in mRNA expression in RANKL-treated BMMs compared to untreated BMMs. (left, microarray data of our study; right, bulk RNA-seq data (GSE226625 dataset)). f Real-time PCR analysis of Acp5, Ctsk, and Mt3 mRNA levels in BMMs cultured with RANKL for 1–5 days (n = 3). The data are shown as the mean ± SEM. *p < 0.05, **p < 0.01, ***p < 0.001, and ****p < 0.0001 according to a Student’s t test. g MT3 protein levels were assessed by immunofluorescence staining in BMMs cultured with RANKL. Scale bars, 50 μm. h MT3 expression in osteoclasts in femur sections shown by staining with MT3, F-actin, and RANK antibodies. Scale bars, 50 μm.
Fig. 2
Fig. 2. The expression pattern of MT3 during osteoclastogenesis is distinct from that of other MT family members.
a, b Analyses of scRNA-seq data (GSE134420 dataset) derived from synovial mononuclear phagocytes. Dot plot representing the expression of selected genes in the clusters (a). The gene expression of Mt1 and Mt2 is presented by an UMAP (b). c–f Analyses of scRNA-seq data from differentiating osteoclast cultures (GSE147174). UMAP visualization of six clusters obtained after filtering the Tnfrsf11a+ Csf1r+ cells (c). Volcano plot of DEGs in clusters, and the top five DEGs in each cluster are labeled (d). Gene expression representation on UMAP (e). Dynamics of Mt3, Mt1, Mt2, and Acp5 expression across the osteoclast differentiation trajectory based on pseudotime analysis (f). g Real-time PCR evaluation of Mt1, Mt2, and Mt4 mRNA levels in BMMs following RANKL stimulation for 1–5 days (n = 3). h Genomic track visualization of ATAC-seq for osteoclasts on Day 0 and Day 4 (GSE211671 dataset), as well as NRF2 ChIP-seq profiles (GSE188460 dataset) near the TSS of the Mt3 gene. Shaded areas highlight the accessible chromatin regions. i A schematic representation illustrates the potential transcription factor-binding motifs identified using Homer analysis and the predicted binding sites for NRF2 and NF-E2, as determined by MEME Suite analysis. All the data are shown as the mean ± SEM. *p < 0.05 according to Student’s t test; ns, not significant (g).
Fig. 3
Fig. 3. MT3 suppresses osteoclast differentiation and bone resorption.
a–d BMMs transfected with control siRNA or Mt3 siRNA were cultured in osteoclast differentiation medium. Representative TRAP-stained images (scale bars, 200 μm) and the numbers of TRAP-positive multinucleated cells with more than three nuclei (n = 4) (a). Real-time PCR analyses of the mRNA expression levels of Mt3, Acp5, c-Fos, and Nfatc1 (n = 3) (b). Western blot analyses showing the protein levels of c-FOS and NFATc1 (c). Representative confocal microscopic scanning images of the dentin slices on which the transfected BMMs were cultured. The quantitated pit depth and resorption area are shown (n = 3) (d). e–g BMMs from Mt3+/+, Mt3+/–, and Mt3–/– mice were cultured in osteoclast differentiation medium. Representative TRAP-stained osteoclasts. Scale bars, 200 μm (e). TRAP-positive multinucleated cells with more than three nuclei (n = 4) (f). Real-time PCR analyses of Mt3 and Acp5 mRNA (n = 3) (g). h–j BMMs were infected with retroviruses harboring pMX-IG-MT3 or the control vector, followed by treatment with RANKL. Top panel shows the TRAP staining of 48-well plates. Bottom panel shows the magnified images of representative TRAP staining. Scale bars, 200 μm. Right panel shows the quantification of TRAP-positive multinucleated cells (n = 4) (h). The expression levels of Mt3, Acp5, c-Fos, and Nfatc1 mRNA were assessed by real-time PCR (n = 3) (i). The protein levels of c-FOS and NFATc1 were determined by Western blot analyses (j). All the data are shown as the mean ± SEM. *p < 0.05, **p < 0.01, ***p < 0.001, and ****p < 0.0001 according to Student’s t test (a, d, h) or one-way ANOVA with Bonferroni post hoc correction (b, g, i) or Dunnett’s test (f).
Fig. 4
Fig. 4. Mt3 knockout exacerbates OVX-induced bone loss.
a Representative 3D reconstruction images of µCT femoral bones from Mt3+/+ and Mt3−/− sham-operated or ovariectomized mice. b Quantitative µCT analyses of various trabecular bone parameters, including BV/TV, Tb.N, Tb.Th, and Tb.Sp, in femoral metaphyses (n = 7–9). c H&E staining of the distal femur (top). Scale bars, 200 μm. Magnified region of interest (bottom). Scale bars, 100 μm. d Representative images showing TRAP-positive multinucleated osteoclasts. Scale bars, 100 μm. e Measurement of N.OC/B.Pm, and OC.S/B.S from TRAP-stained sections (n = 7–8). All the data are shown as the mean ± SEM. *p < 0.05, **p < 0.01, ***p < 0.001, and ****p < 0.0001 according to one-way ANOVA and Bonferroni post hoc correction (b, e).
Fig. 5
Fig. 5. MT3-induced inhibition of osteoclast differentiation is mediated by a decrease in ROS.
a Metascape enrichment analysis of the top 500 genes upregulated in Mt3 knockdown cells treated with RANKL for 3 days. b GSEA of genes associated with “positive regulation of osteoclast differentiation” and “bone resorption” in cells after RANKL treatment for 5 days. c GSEA of “oxidative stress and redox pathways” in Day 5 samples. d Flow cytometry analysis of ROS levels in RANKL-treated cells in the control siRNA or Mt3 siRNA group. e, f Representative immunofluorescence images and relative fluorescence intensity (RFI) of ROS following treatment with or without RANKL for 2 days (scale bars, 50 μm; n = 3). g, h Representative immunofluorescence images and RFI of ROS levels in cells in the pMX-IG or pMX-IG-MT3 groups after treatment with or without RANKL for 2 days (scale bars, 50 μm; n = 3). i, j Representative TRAP staining images and quantification of TRAP-positive multinucleated cells generated in the presence or absence of NAC (scale bars, 200 μm; n = 4). k Western blot analysis of BMMs transfected with either control or Mt3 siRNA and treated with RANKL for the indicated period. l Western blot analysis of BMMs transduced with retroviruses harboring either pMX-IG or pMX-IG-MT3 and stimulated with RANKL for the indicated times. All the data are shown as the mean ± SEM. *p < 0.05, **p < 0.01, ***p < 0.001, and ****p < 0.0001 according to one-way ANOVA and Bonferroni post hoc correction (f, h, j).
Fig. 6
Fig. 6. Mt3 deficiency elevates SP1 transcription factor activity.
a Homer analysis of transcription factor-binding site enrichment in the promoters of the top 500 genes upregulated in Mt3 siRNA-transfected cells compared with control siRNA-transfected cells after osteoclastogenic culture. b Unsupervised graph-based clustering of SCENIC-derived gene regulatory network (GRN) scores for identified regulons onto the UMAP of the scRNAseq data of differentiating osteoclasts shown in Fig. 2c. c Pearson correlation coefficient and p value from linear regression analysis of Mt3 mRNA levels and SP1 activity across the clusters of osteoclast cultures. d Immunofluorescence images of SP1 in osteoclasts on Day 5 of RANKL treatment. Scale bars, 20 μm. e Quantification of nuclear SP1 immunofluorescence signals (n = 3). f Analysis of SP1 DNA-binding activity in nuclear extracts from Mt3+/+ and Mt3–/– cells after 3 or 5 days of RANKL treatment (n = 4). g Top 10 KEGG enrichment analysis pathways for 1071 upregulated genes associated with SP1 superactivation in white blood cells of patients with bone marrow failure. All the data are shown as the mean ± SEM. *p < 0.05, **p < 0.01, and ***p < 0.001 according to Student’s t test (e) or one-way ANOVA and Bonferroni post hoc correction (f).
Fig. 7
Fig. 7. MT3 inhibits osteoclast differentiation by modulating SP1 activity via competitive Zn2+ binding.
a The level of intracellular Zn2+ was assessed using the FluoZin-3 fluorescent probe (n = 3). Representative immunofluorescence images and fluorescence intensity of FluoZin-3-Zn2+ are shown. Scale bars, 50 μm. b, c Flow cytometric analysis of intracellular Zn2+ levels in BMMs from sham- or OVX-operated mice after culture with or without RANKL. The mean fluorescence intensity (MFI) of intracellular Zn2+ was determined via flow cytometry analyses (n = 3). d Representative TRAP staining images and quantification of TRAP-positive multinucleated cells in Mt3+/+ and Mt3–/– osteoclast cultures with or without TPEN treatment (n = 4). Scale bars, 200 μm. e Analysis of SP1 DNA-binding activity in nuclear extracts from Mt3+/+ and Mt3–/– osteoclasts with or without TPEN treatment (n = 4). f Representative TRAP staining images and quantification of TRAP-positive multinucleated cells in osteoclastogenic cultures of Mt3+/+ and Mt3–/– BMMs transfected with control siRNA or Sp1 siRNA (n = 4). Scale bars, 200 μm. g Real-time PCR analysis of Acp5, Ctsk, Mmp9, and Nfatc1 mRNA levels (f) (n = 3). All the data are shown as the mean ± SEM. *p < 0.05, **p < 0.01, ***p < 0.001, and ****p < 0.0001 according to one-way ANOVA and Bonferroni post hoc correction (a, c–g).
Fig. 8
Fig. 8. MT3 modulates osteoclast differentiation through SP1-mediated regulation of Nfatc1.
a Genome track view of osteoclast ATAC-seq profiles (GSE211671) for Nfatc1. The region on Chr18:80712933-80713289 is highlighted with a pink background. b A representative image of ChIP-DNA electrophoresis. c ChIP‒qPCR results showing SP1 binding to the Nfatc1 promoter (n = 3). d Analysis of the Nfatc1 promoter region from (a) using JASPAR to identify potential SP1-binding sites. RS, relative score. e Schematic of DN-SP1. f Expression levels of Sp1 and Nfatc1 mRNA in BMMs infected with retroviruses carrying pMX-IG-DN-SP1 or pMX-IG followed by culture with RANKL (n = 3). g Representative stained images and quantification of TRAP-positive multinucleated cells (n = 4). h A schematic model depicting the role of MT3 in controlling excessive osteoclastogenesis.

References

    1. Hadjidakis, D. J. & Androulakis, I. I. Bone remodeling. Ann. NY Acad. Sci.1092, 385–396 (2006). - PubMed
    1. Veis, D. J. & O’Brien, C. A. Osteoclasts, master sculptors of bone. Annu. Rev. Pathol.18, 257–281 (2023). - PubMed
    1. Cummings, S. R. & Melton, L. J. Epidemiology and outcomes of osteoporotic fractures. Lancet359, 1761–1767 (2002). - PubMed
    1. Melton, L. J. 3rd Who has osteoporosis? A conflict between clinical and public health perspectives. J. Bone Min. Res. 15, 2309–2314 (2000). - PubMed
    1. Reid, I. R. & Billington, E. O. Drug therapy for osteoporosis in older adults. Lancet399, 1080–1092 (2022). - PubMed

MeSH terms