. 2024 Jul 31;7(1):922.
doi: 10.1038/s42003-024-06561-3.

Biophysical cartography of the native and human-engineered antibody landscapes quantifies the plasticity of antibody developability

Affiliations

Biophysical cartography of the native and human-engineered antibody landscapes quantifies the plasticity of antibody developability

Habib Bashour et al. Commun Biol. .

Abstract

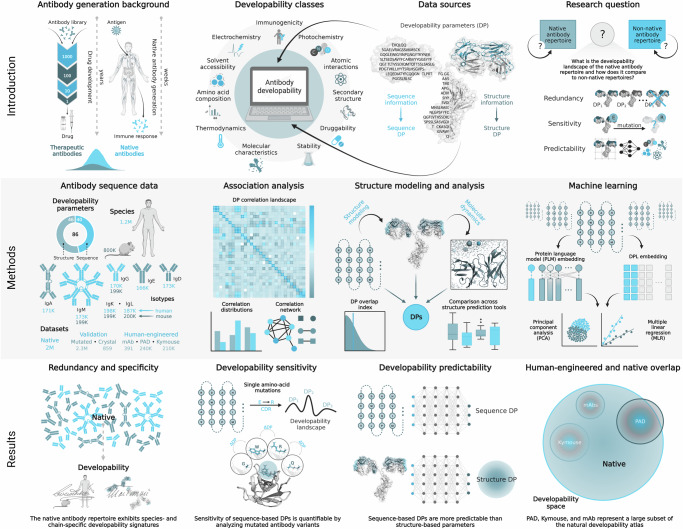
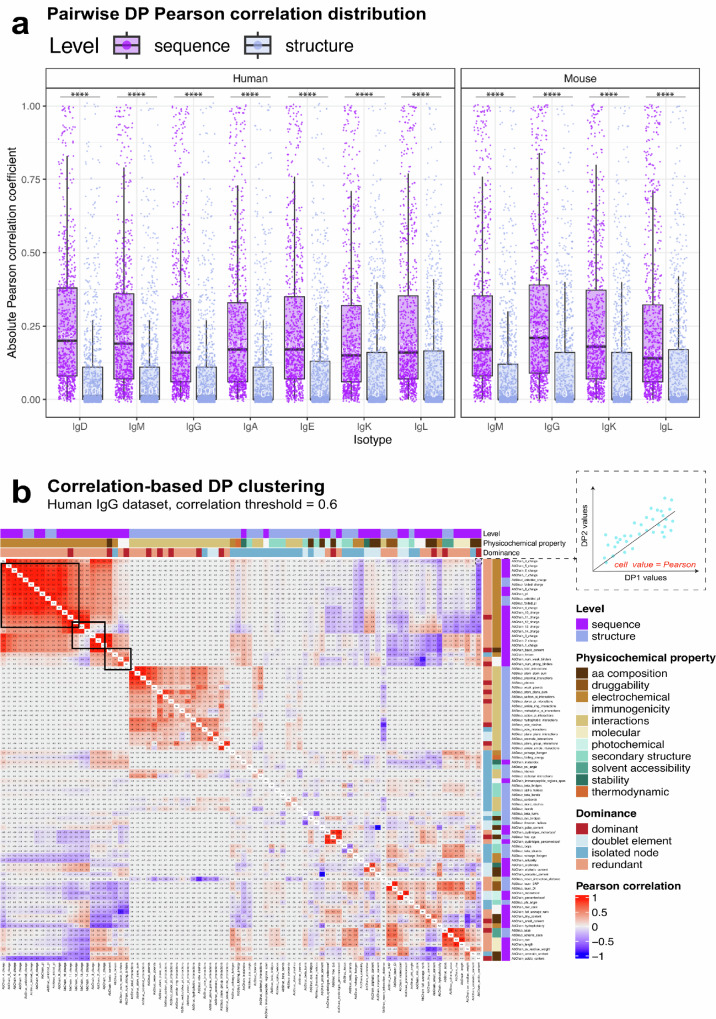
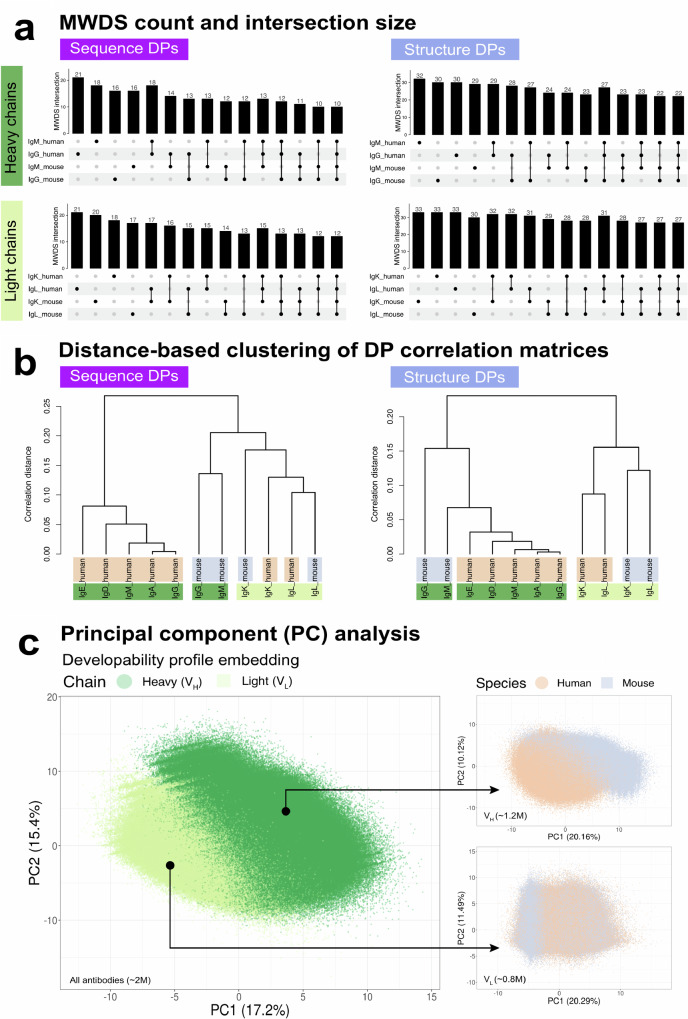
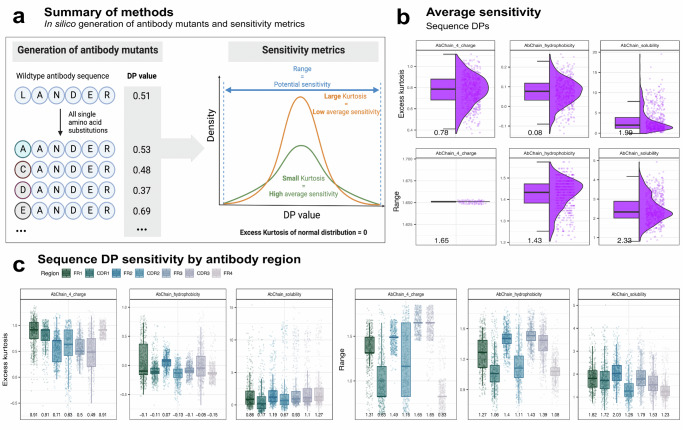
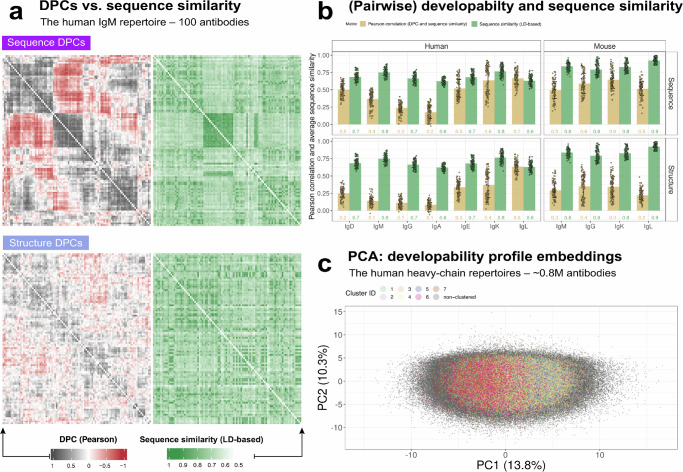
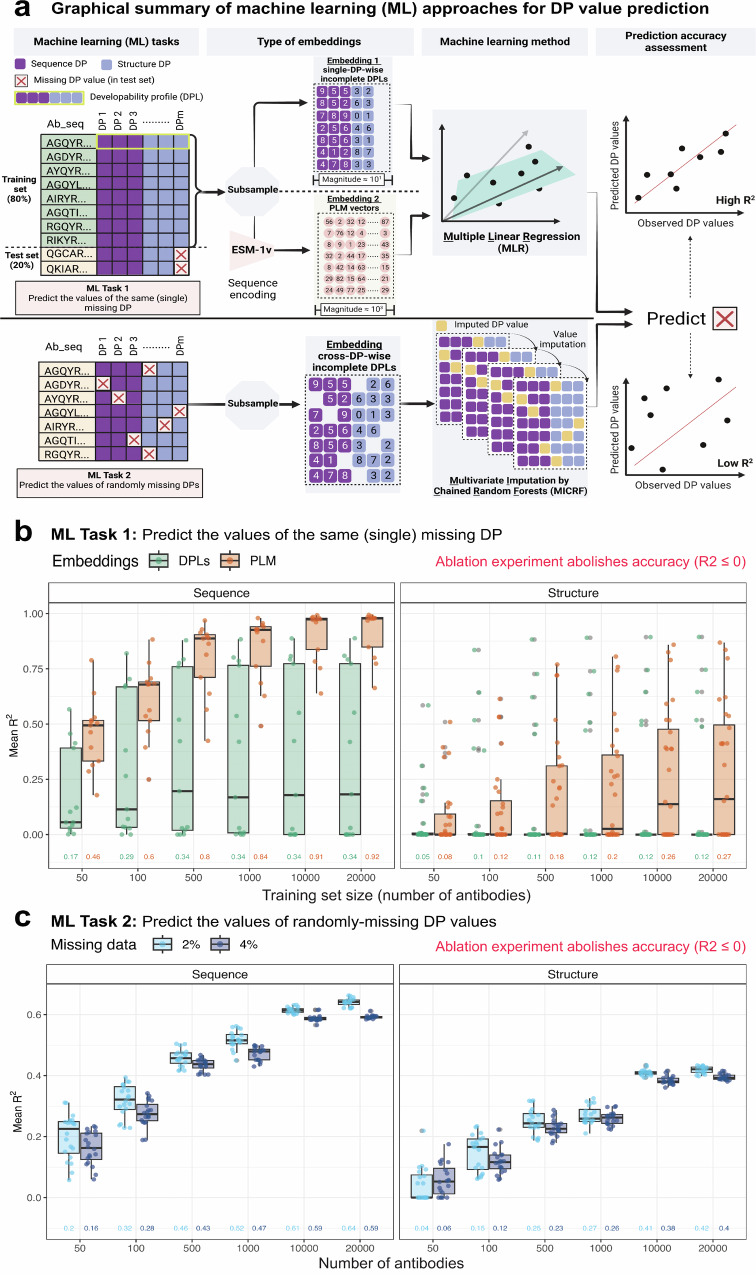
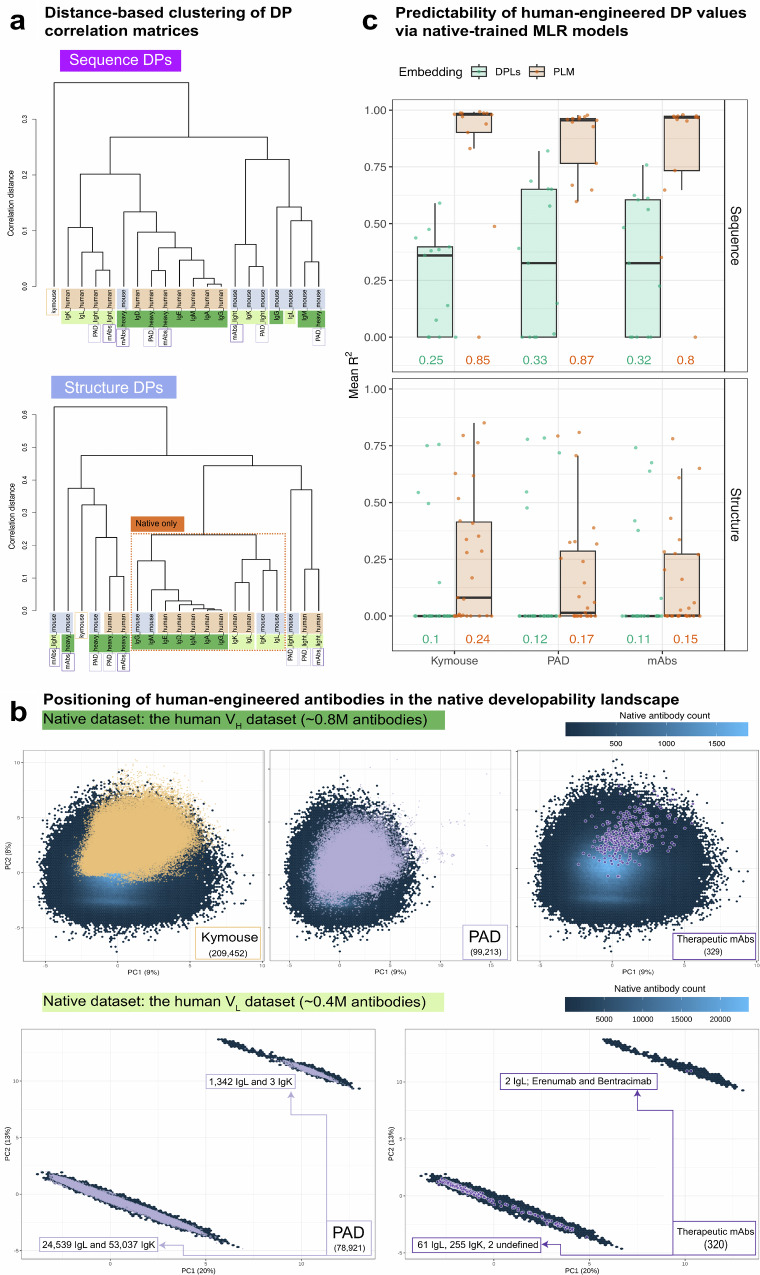
Designing effective monoclonal antibody (mAb) therapeutics faces a multi-parameter optimization challenge known as "developability", which reflects an antibody's ability to progress through development stages based on its physicochemical properties. While natural antibodies may provide valuable guidance for mAb selection, we lack a comprehensive understanding of natural developability parameter (DP) plasticity (redundancy, predictability, sensitivity) and how the DP landscapes of human-engineered and natural antibodies relate to one another. These gaps hinder fundamental developability profile cartography. To chart natural and engineered DP landscapes, we computed 40 sequence- and 46 structure-based DPs of over two million native and human-engineered single-chain antibody sequences. We find lower redundancy among structure-based compared to sequence-based DPs. Sequence DP sensitivity to single amino acid substitutions varied by antibody region and DP, and structure DP values varied across the conformational ensemble of antibody structures. We show that sequence DPs are more predictable than structure-based ones across different machine-learning tasks and embeddings, indicating a constrained sequence-based design space. Human-engineered antibodies localize within the developability and sequence landscapes of natural antibodies, suggesting that human-engineered antibodies explore mere subspaces of the natural one. Our work quantifies the plasticity of antibody developability, providing a fundamental resource for multi-parameter therapeutic mAb design.


Conflict of interest statement

The authors declare the following competing interests: V.G. declares advisory board positions in aiNET GmbH, Enpicom B.V, Absci, Omniscope, and Diagonal Therapeutics. V.G. is a consultant for Adaptyv Biosystems, Specifica Inc, Roche/Genentech, immunai, Proteinea and LabGenius. H.B. declares a scientific writing post in PipeBio ApS. K.K. is the founder of NaturalAntibody. M.P. and D.N-Z.G. are employed by Adaptyv Biosystems.

Figures

Fig. 1
Fig. 1. Redundancy, sensitivity, and predictability of developability parameters in native and human-engineered antibodies.
Introduction: The development of therapeutic mAbs takes years, and DPs dictate the selection and design of candidates for (pre-)clinical testing. Here, we analyzed the plasticity of the developability landscapes of natural antibodies in terms of DP redundancy (extent of DP intercorrelation), sensitivity (extent of DP change as a function of antibody sequence change), and predictability (predictability of a given DP based on one or several DPs). Methods: To analyze the constraints on natural antibody developability and to relate these to current human-engineered antibody datasets, we assembled a dataset of over 2 M native antibody sequences (heavy and light chain isotypes, human and murine) and computed 40 sequence- and 46 structure-based DPs. To reduce redundancy, we determined the minimum-weight dominating sets (MWDS) of DP correlation networks. To quantify sensitivity, we analyzed single-amino-acid substituted variants followed by characterization of the impact of sequence variation on DP distribution. To compute predictability and assess the interdependence of DPs, we trained multiple linear regression (MLR) using developability profile (DPL) and protein language model (PLM) embeddings. These embeddings were used to relate native antibodies to human-engineered ones via principal component analysis (PCA). Moreover, we performed classical molecular dynamics simulations to analyze the distributions of antibody DP values and define how the rigid models fit into these distributions. Results: Our results address all three research areas (redundancy, sensitivity, and predictability). Redundancy: We found a lower degree of interdependence among structure DPs than the sequence-based ones for all isotypes of the native dataset, and higher pairwise antibody sequence similarity was not always associated with higher pairwise antibody developability similarity. Native antibody datasets contained species- and chain-specific developability signatures. Sensitivity: We propose methods to quantify the sensitivity of antibody DPs to minimal sequence changes. Predictability: We found that structure-based DPs are less predictable than sequence-based DPs using protein language model (PLM) and multiple linear regression (MLR) embeddings. The comparison between native and human-engineered datasets revealed that human-engineered (therapeutic, patented, and Kymouse) datasets were localized within the native developability landscape.
Fig. 2
Fig. 2. Sequence-based developability parameters show higher redundancies compared to structure-based parameters.
a Absolute pairwise Pearson correlation of sequence and structure developability parameters within the native antibody dataset. Numerical values on the figure represent the median of Pearson correlation for the corresponding subset. Differences were assessed using pairwise Mann-Whitney test with p-value adjustment (Benjamini-Hochberg method). ****p < 0.0001 (Human; IgD: 2.09e-112, IgM: 6.54e-104, IgG: 5.21e-100, IgA: 8.94e-101, IgE: 1.04e-94, IgK: 4.61e-74, IgL: 7.46e-80, Mouse; IgM: 1.276e-98, IgG: 4.76e-101, IgK: 6.9e-88, IgL: 6.68e-71). n = 785 sequence and 1035 structure biologically independent pairwise correlation experiments for each isotype and species combination. b Hierarchical clustering of 40 sequence and 46 structure developability parameters based on pairwise Pearson correlation for 170,473 IgG human antibodies (median of absolute Pearson correlation: 0.02 + /-0.003 SEM). As explained in the inset (top right), each cell within the heatmap reflects the value of Pearson correlation for a pair of DPs. Developability parameters are color-annotated with their corresponding level (sequence or structure), physicochemical property (as detailed in Supplementary Data 1), and dominance status from the ABC-EDA algorithm output at Pearson correlation coefficient threshold of 0.6 (see Methods). Black boxes highlight correlation clusters that contain more than three DPs and exhibit pairwise Pearson correlation coefficient > 0.6. Supplementary Figs. 6–10A.
Fig. 3
Fig. 3. The native (human and murine) antibody datasets exhibit chain-specific and species-specific developability signatures.
a MWDS intersection size for the human and mouse native datasets. Numerical values on the figure reflect the MWDS count (for an individual subset) and intersection size (for more than one subset). The MWDS for the respective isotypes was identified using the ABC-EDA algorithm (see Methods) at a threshold of absolute Pearson correlation of 0.6. For MWDS intersection size among all human heavy chain subsets, please refer to Supplementary Fig. 10B. b Distance-based hierarchical clustering of isotype-specific pairwise DP correlation matrices (sequence and structure levels). The height of the dendrograms (shown to the left of the dendrograms) represents the correlation distance among the dendrogram tips. c Repertoire-wide principal component analysis (PCA) of the native antibody developability profiles. We performed this analysis for the complete native dataset (left pane; ~2 M sequences) and for the chain-specific datasets (right panels; ~1.2 M sequences in the top panel, ~0.8 M sequences in the bottom panel). The dimensionality of complex developability profiles was reduced to 2D PCA projections. The full value distribution of the corresponding PCs associated with each projection is shown in Supplementary Fig. 10C. Supplementary Fig. 10B, C.
Fig. 4
Fig. 4. Developability parameter sensitivity can be quantified by analyzing mutated variants of wildtype antibodies.
a DP values were computed for all possible single amino acid substituted mutants of 500 sampled wildtype human VH antibody sequences (100 sequences sampled per isotype; n = 301,777 independent mutants in total). Values of each DP were scaled and mean-centered. The sensitivity was quantified for each DP by analyzing the DP dispersion of the mutants from their corresponding wildtype. Average sensitivity was measured by excess kurtosis (small kurtosis = high average sensitivity), while potential sensitivity was measured by the range (see Methods). b Average and potential sensitivity of selected sequence-based DPs. c Average and potential sensitivity of DPs from (B) grouped by antibody region in which the mutation occurred. In both (b) and (c), numerical values on the x-axis represent the median of the corresponding sensitivity metric. Supplementary Figs. 11 and 12.
Fig. 5
Fig. 5. Developability profile similarity is not necessarily associated with sequence similarity.
a Pairwise developability profile Pearson correlation (DPC—left panels) alongside the pairwise Levenshtein distance (LD) based-sequence similarity score (right panels—see Methods) for a random sample of n = 100 antibodies from the human IgM dataset (100 × 100 matrices) that share the same IGHV gene family (IGHV1) annotation (shown both for sequence and structure DPLs). Each row and each column represent a single antibody sequence. Rows and columns in the left panels were hierarchically clustered. In the right panels (sequence similarity), rows and columns were ordered in the same order as the corresponding left panel (DPC) for ease of comparison. The distribution of DPC and sequence similarity is shown in Supplementary Fig. 16A. b Pearson correlation between DPC and sequence similarity matrices for 100 sets of randomly sampled non-overlapping 100 antibody sequences (within the same IGHV gene family per batch) from all isotypes of the native dataset (total n = 100 independent experiments of 100 antibodies per experiment). Pearson correlation coefficient values (shown in beige) are presented alongside the corresponding mean sequence similarity values (shown in green) for the same 100 sets. The height of the bars and the numerical values on the figure reflect the mean of the corresponding metric (mean Pearson correlation and the mean sequence similarity). The error bars represent the standard deviation. c Principal component analysis (PCA) of the developability profiles of the native human heavy-chain dataset (n = ~0.8 M antibodies). The developability profiles (DPLs) were utilized as embeddings for this analysis (see Methods). Antibody clusters (1–7) were created for the groups of antibodies that are at least 75% similar in sequence (as determined by USEARCH) and contain at least 10 K antibodies. Antibodies that did not satisfy the clustering conditions were labeled as “non-clustered” (727861 sequences) and sent to the back layer of the figure. For antibody counts per cluster, please refer to Supplementary Fig. 16B. Supplementary Figs. 13–16.
Fig. 6
Fig. 6. Sequence-based developability parameters are more predictable than structure-based parameters.
a Graphical representation of machine learning (ML) approaches used to assess the predictability of DPs. We investigated two scenarios where the missing (deleted) DP values were either all from one (single) DP (ML Task 1) or were randomly missing from several DPs (ML Task 2). For ML Task 1, we compared the predictive accuracy of two different embeddings; single-DP-wise incomplete developability profiles (DPLs) (embedding 1; order of magnitude 101) and PLM vectors (embedding 2; order of magnitude 103). We used these embeddings to train multiple linear regression (MLR) models (separately) to predict the missing DP values in the test set. To enable the comparison between these two embeddings, we used identical training subsamples (in regards to size and antibody identity, see Methods). For ML Task 2, we used cross-DP-wise incomplete developability profiles as input for the multivariate imputation by chained random forests (MICRF) algorithm to predict missing DP values. For both ML tasks, we estimated the prediction accuracy by computing the coefficient of determination (R2) using observed and predicted DP values. b Comparison of the predictive accuracy of incomplete developability profiles (single-DP-wise incomplete DPLs) and PLM vectors as embeddings for MLR models to predict the values of missing DPs in the test set (ML Task 1). The x-axis reflects the number of antibody sequences (sample size) used for the embedding. For each sample size, we repeated the prediction of missing DPs 20 times (n = 20 independent experiments). The y-axis represents the mean R2 for sequence DPs (left facet) and structure DPs (right facet). Error bars represent the standard deviation of R2. Missing DPs tested in this analysis belonged to the MWDS exclusively, as determined at a Pearson correlation coefficient threshold of 0.6, for the human IgG dataset, summing to 13 sequence DPs and 28 structure DPs (after removing a single element from each doublet and immunogenicity DPs, Supplementary Table 2). c Evaluating the predictability of randomly missing DP values using the MICRF algorithm where cross-DP-wise incomplete developability profiles are used as embeddings. The x-axis reflects the number of antibodies (sample size) used for the embedding. For each sample size, we repeated the prediction of missing DPs 20 times (n = 20 independent experiments). The y-axis represents the mean R2 for sequence DPs (left facet) and structure DPs (right facet) when the proportion of the missing data is either 2% (light blue line) or 4% (dark blue line). Missing DPs tested in this analysis belonged to the MWDS, analogously to (b). Numbers on the x-axis in both (b) and (c) reflect the average values of mean R2. Supplementary Fig. 17.
Fig. 7
Fig. 7. Human-engineered antibodies are contained in the developability landscape of natural antibodies.
a Distance-based hierarchical clustering of isotype-specific pairwise DP correlation matrices (sequence and structure levels—similar to the analysis shown in Fig. 3a). The height of the dendrograms (shown to the left of the figure) represents the correlation distance among the dendrogram tips. The dashed square in the right (structure-based) panel highlights the native-only dataset. b Top three panels: The positioning of the human-aligned human-engineered VH antibodies (Kymouse; 209,452, PAD; 99,213 and therapeutic mAbs; 329) in the developability profile space of the native human VH dataset (854,418 antibodies) based on a principal component analysis (PCA, see Methods). Bottom two panels: The positioning of the human-aligned human-engineered VL antibodies (PAD; 78,921 and therapeutic mAbs; 320) in the developability space of the native human VL dataset (385,633 antibodies). The hexagonal bins (shown in the back layer) represent the count of native antibodies (scale shown on the top right of the panels), and the human-engineered antibodies are represented as data points. c Evaluating the predictability of sequence (left panel) and structure DPs of the human-aligned human-engineered VH antibodies (Kymouse; 209,452, PAD; 99,213 and therapeutic mAbs; 329), using multiple linear regression (MLR) models trained on native human VH antibodies. As explained in Fig. 6a (ML Task 1), the predictive accuracy of two types of embeddings was tested, including single-DP-wise incomplete developability profiles (DPLs) and ESM-1v protein language model encoding vectors (PLM). MLR models were trained using 1000 antibodies for DPL-based predictions and 20000 antibodies for PLM-based predictions (respective saturation points). Missing DPs tested in this analysis belonged to the MWDS exclusively as determined at a Pearson correlation coefficient threshold of 0.6, for the native human IgG dataset, summing to 13 sequence DPs and 28 structure DPs (Supplementary Table 2). The y-axis represents the mean coefficient of determination (R2) across 20 repetitions (n = 20 independent experiments). Numerical values shown represent the average values of mean R2 across (sequence or structure) DPs. Supplementary Figs. 18–21.

References

    1. Singh, S. et al. Monoclonal antibodies: a review. Curr. Clin. Pharmacol.13, 85–99 (2018). - PubMed
    1. Khetan, R. et al. Current advances in biopharmaceutical informatics: guidelines, impact and challenges in the computational developability assessment of antibody therapeutics. MAbs14, 2020082 (2022). 10.1080/19420862.2021.2020082 - DOI - PMC - PubMed
    1. Akbar, R. et al. Progress and challenges for the machine learning-based design of fit-for-purpose monoclonal antibodies. MAbs14, 2008790 (2022). 10.1080/19420862.2021.2008790 - DOI - PMC - PubMed
    1. Laustsen, A. H., Greiff, V., Karatt-Vellatt, A., Muyldermans, S. & Jenkins, T. P. Animal immunization, in vitro display technologies, and machine learning for antibody discovery. Trends Biotechnol. 39, 1263–1273 (2021). - PubMed
    1. Wilman, W. et al. Machine-designed biotherapeutics: opportunities, feasibility and advantages of deep learning in computational antibody discovery. Brief. Bioinform.23, bbac267 (2022). 10.1093/bib/bbac267 - DOI - PMC - PubMed

Publication types

MeSH terms

Substances

LinkOut - more resources