. 2024 Oct;30(10):2947-2956.
doi: 10.1038/s41591-024-03152-x. Epub 2024 Jul 31.

Cranioencephalic functional lymphoid units in glioblastoma

Affiliations

Cranioencephalic functional lymphoid units in glioblastoma

Celia Dobersalske et al. Nat Med. 2024 Oct.

Abstract

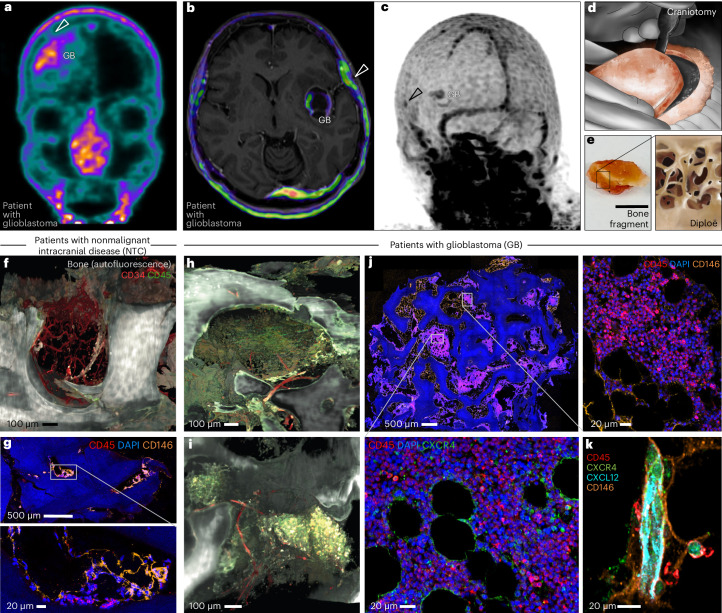
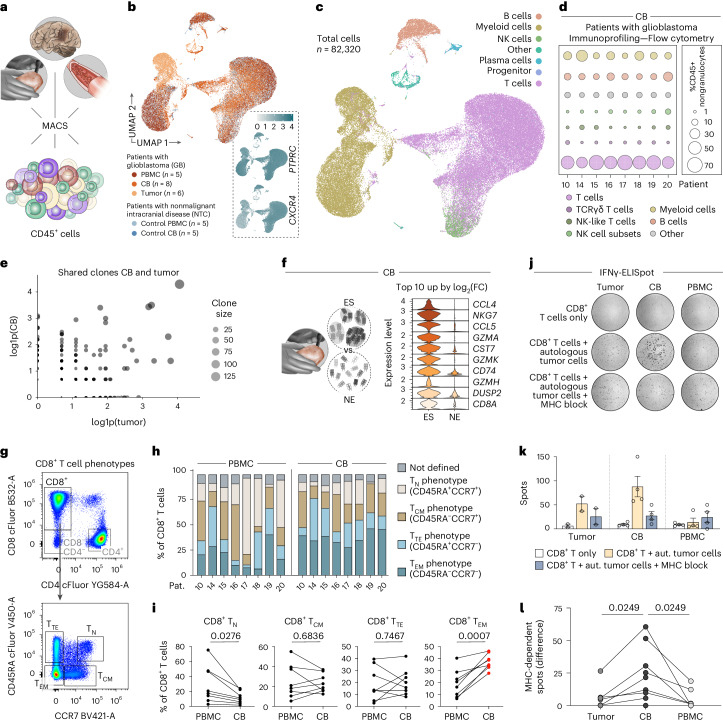
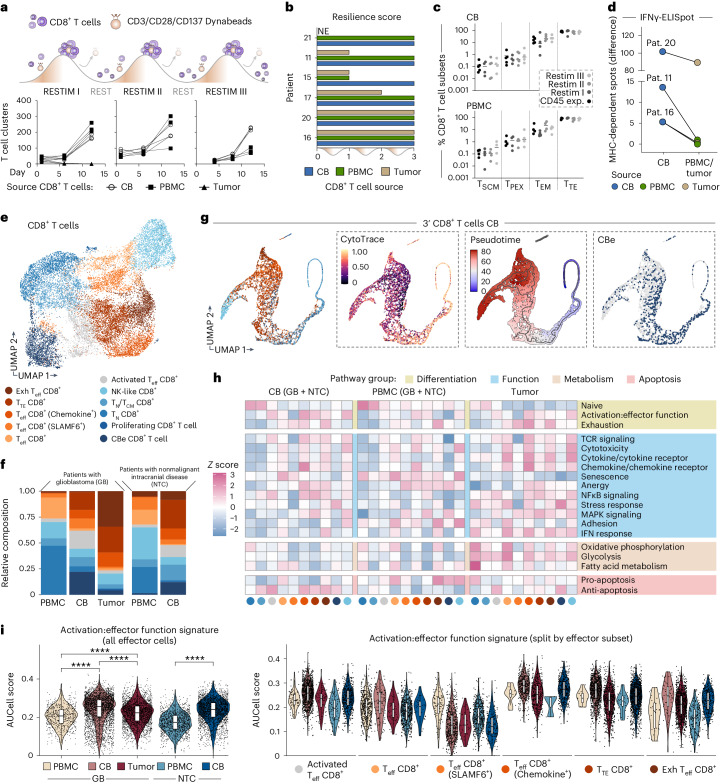
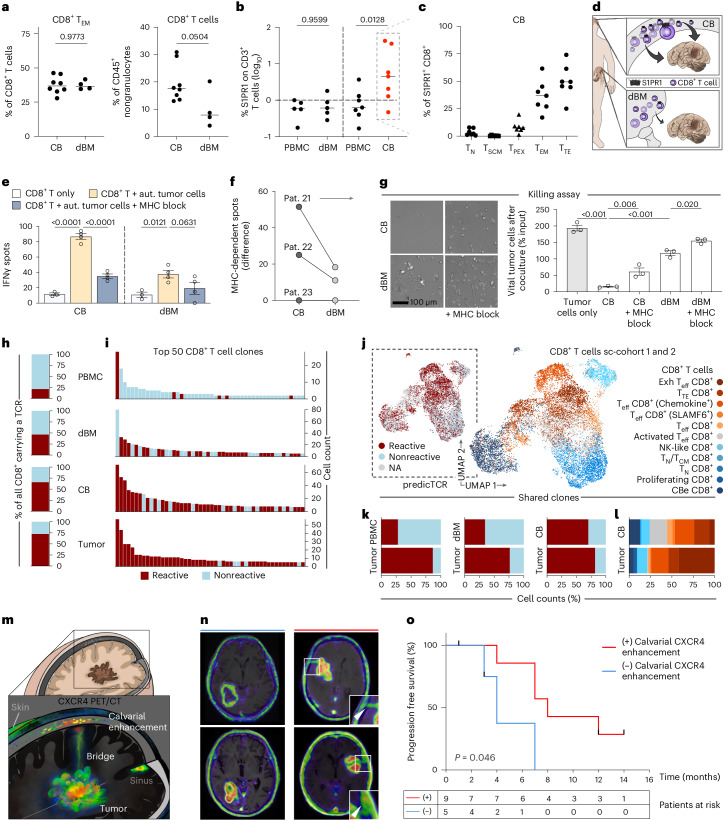
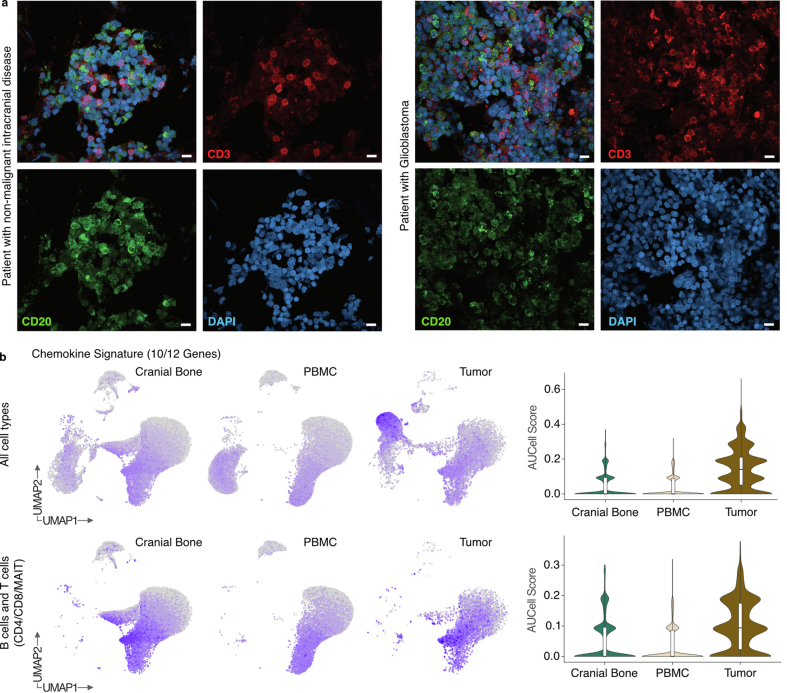
The ecosystem of brain tumors is considered immunosuppressed, but our current knowledge may be incomplete. Here we analyzed clinical cell and tissue specimens derived from patients presenting with glioblastoma or nonmalignant intracranial disease to report that the cranial bone (CB) marrow, in juxtaposition to treatment-naive glioblastoma tumors, harbors active lymphoid populations at the time of initial diagnosis. Clinical and anatomical imaging, single-cell molecular and immune cell profiling and quantification of tumor reactivity identified CD8+ T cell clonotypes in the CB that were also found in the tumor. These were characterized by acute and durable antitumor response rooted in the entire T cell developmental spectrum. In contrast to distal bone marrow, the CB niche proximal to the tumor showed increased frequencies of tumor-reactive CD8+ effector types expressing the lymphoid egress marker S1PR1. In line with this, cranial enhancement of CXCR4 radiolabel may serve as a surrogate marker indicating focal association with improved progression-free survival. The data of this study advocate preservation and further exploitation of these cranioencephalic units for the clinical care of glioblastoma.


Conflict of interest statement

C.D., L.R., D.A.S., F.R., I.C., U.S. and B.S. are inventors on a patent application related to cellular data of this study (EP24160641.7). C.L.T., M.P. and E.W.G. are inventors on a patent application describing the identification of tumor-reactive TCRs (WO 2022/200456). M.D.O. receives consulting fees from Brainlab AG and no support was provided for this study or data presented here. D.A.S. is a cofounder of Round Table Research, focused on oncology and degenerative diseases, with currently unrelated technologies and no support provided for this study or data presented here. R.A.W. has received speaker honoraria from Novartis/AAA and PentixaPharm, reports advisory board work for Novartis/AAA and Bayer and is involved in 68Ga-Pentixafor PET Imaging in PAN Cancer (FORPAN; sponsored and planned by PentixaPharm). A.K.B. has received speaker honoraria from Novartis/AAA and PentixaPharm, is a board member/officer/trustee for PentixaPharm and is involved in 68Ga-Pentixafor PET Imaging in PAN Cancer (FORPAN; sponsored and planned by PentixaPharm). H.C.R. received consulting and lecture fees from AbbVie, AstraZeneca, Roche, Janssen-Cilag, Novartis, Vertex and Merck; has received research funding from Gilead and AstraZeneca; and is a cofounder of CDL Therapeutics GmbH. M.P. and E.W.G. are founders of Tcelltech GmbH. B.S. reports grants from BMWK and DKFZ-Bayer Joint Alliance outside the submitted work. Additionally, B.S. has a patent for peripheral zone tumor cells, methods for their preparation and use issued (EP2324111, AU 2009291203 and USPTO 9,103,819). The other authors declare no competing interests.

Figures

Fig. 1
Fig. 1. Glioblastoma-associated enrichment of immune cells in the CB.
a, Clinical PET–CT visualizing radiolabeled CXCR4 in a coronal plane (patient 1). Arrowhead depicts focal contact between GB parenchyma and superficial cranial–meningeal compartment. Additional findings include demarcation of the nasopharyngeal mucosa and parts of Waldeyer’s pharyngeal ring. b, Clinical CXCR4 PET–CT in an axial plane (patient 2). Secondary fusion with MRI exposing brain anatomy and the connecting meningeal structures. Arrowhead depicts nodular enhancement ipsilateral to the GB parenchyma. Note the lower unconnected radiolabeling of the dural sinus. c, Three-dimensional reconstruction of PET–CT data from b. Arrowhead marks focal CXCR4 radiolabeling in the CB in juxtaposition to the intracerebral GB. Note the unconnected aspects of the neuro-immune interface of the dural sinus and bystander radiolabeling of the head and neck lymphatic system. d, Schematic representation of a craniotomy. e, Photograph of a representative fresh bone specimen used for the study (scale bar: 5 mm). Magnified inset: drawing of inner spongy structure. f, Three-dimensional rendering of light-sheet microscopy data obtained from whole-mount preparation of fixed and optically cleared clinical CB (patient c3). Note the empty aspect of fatty, aged marrow. g, Immunofluorescence confocal image of CB tissue section showing microvessels (CD146+) and limited presence of immune cells (CD45+) in the diploë of patient c7 (total n = 5 patients with nonmalignant intracranial disease; Extended Data Fig. 2). h,i, Light-sheet microscopy data as in f, showing accumulation of CD45+ immune cells surrounding CD34+ microvessels in the diploë of patients with glioblastoma (h, patient 7; i, patient 6). j, Immunofluorescence confocal image, as in g, demonstrating morphological appearance of tumor-associated bone cavities and accumulating immune cells (patient 12; total n = 4 patients; Extended Data Fig. 2). Insets detail immune and hematopoietic cell clusters (CD45+) and CXCR4 labeling within. k, Multicolor immunofluorescence confocal image capturing close proximity of CXCL12 to CXCR4+ cells in a CB tissue section of patient 13 (total n = 2 patients; Extended Data Fig. 2). Scale bars as indicated. NTC, samples from patients with nonmalignant intracranial disease; GB, samples from patients with glioblastoma. Source data
Fig. 2
Fig. 2. CB cellular immune profile.
a, Schematic depicts sources of CD45+ immune cells. b, UMAP of integrated scRNA-seq data from CD45 (PTPRC)-expressing immune cells. Tissue sources color coded, numbers (n) of biosamples indicated per source. Insets visualize expression of selected genes. c, Overlay of SingleR- and marker-based annotation of cell types. d, Bubble plot summarizing prevalence of immune cell subsets among CD45+ nongranulocytes, by flow cytometry. e, Scatter plot of scVDJ data from n = 3 patients with glioblastoma visualizing shared T cell clonotypes between CB and tumor. Clone size visualized by number of cells per clone, each point represents a unique clone. Axes, log-transformed counts of cells (log1p). Exclusive CB or tumor clones plotted along the y and x axis, respectively. Shared clones located in the central area of the graph. f, Top ten differentially expressed genes (ranked by log2(FC)) comparing tumor-shared expanding clonotypes versus nonexpanding singlets in the CB. DEGs detected by FindMarkers() Seurat function, per default setting (two-sided Wilcoxon rank-sum test). Gene expression cutoff set to a minimum of 20% of cells. g, Gating strategy for profiling of CD8+ T cell phenotypes (TTE and TCM). h, Stacked bar plot indicating phenotype distribution per patient and niche from listed patients with glioblastoma. i, Graphs show frequencies of phenotypes in paired samples. Two-tailed paired t test, P values indicated (n = 8 patients). j, Photomicrographs depict exemplary patterns of ELISpots using an IFNγ-based readout. k, Exemplary distribution of raw data from available expandable cells of one paired ELISpot analysis (n = 1 patient, patient 15, data points represent technical replicates per source). Data as mean ± s.e.m. l, Graph summarizing mean data of MHC-dependent IFNγ spots obtained from samples of patients with glioblastoma (n = 9). Two-tailed, paired t test with P values corrected for multiple comparisons (Benjamini–Hochberg method). UMAP, uniform manifold approximation and projection; FC, fold change; ES, expanded shared; NE, nonexpanded; TTE, terminal effector T cell; TCM, central memory T cell. Source data
Fig. 3
Fig. 3. Developmental trajectory of CD8+ T cell response.
a, Illustration of experimental approach used to monitor T cell aggregation. Expanded CD8+ T cells were restimulated (RESTIM) and allowed to rest in intermediary phases. Graphs display quantification of clusters forming at indicated time points, n = 3 technical replicates, patient 11. b, Resilience assay. Data represent successful rounds of restimulation. Experiment conducted in triplicates per patient and source. c, Subanalysis of b. Distribution of CD8+ T cell phenotypes by cytometry after indicated stage of stimulation (CD45 exp.) or restimulation (Restim I–III). Data points represent n = 4 or n = 5 biological replicates per condition. T cells—TSCM, TPEX, TEM, TTE. d, ELISpot data of specified CD8+ T cells after two (patient 20) or three (patients 11 and 16) rounds of restimulation in response to autologous tumor cells. Graph summarizing mean data of MHC-dependent IFNγ spots (n = 3 patients), paired samples indicated. e, UMAP of scRNA-seq CD8+ T cell data, color coded by annotated cell type. f, Stacked plot of CD8+ T cell data separated by condition and tissue source. CBe T cell types in dark blue. g, UMAP of 3′ GEX CB data from e generated by Palantir, based on diffusion map dimensionality reduction, color coded as in e. Left, continuous CytoTRACE score, from 1 (highest) to 0 (lowest) level of plasticity. Center, pseudotime calculation transitioning from blue (start) to red (end), root state manually defined. Right, CBe T cell distribution in the UMAP. h, Heatmap visualizing z scores of AUCell scores calculated using external gene signatures across CD8+ T cell phenotypes from e. i, Violin plot showing activation:effector function signature intensities (AUCell score) in the effector CD8+ T cell subtypes of h, split by niche and T cell subset. Boxplots display median, quartiles and values within 1.5× interquartile range as whiskers. Biological replicate data from (n) patients: GB-PBMC (5 patients), GB-CB (8 patients), GB-tumor (6 patients), control-PBMC (5 patients) and control-CB (5 patients). Significance calculated by two-sided Wilcoxon rank-sum test with adjusted P value using Holm correction (SeuratExtend); absolute values provided in Supplementary Table 3. ****P < 0.0001. TSCM, stem-like memory T cell; TPEX, progenitor exhausted T cell. Source data
Fig. 4
Fig. 4. Distinctive features of CD8+ T cells in the proximal bone marrow.
ac, Lines indicate median, P values specified, (n) patients analyzed. a, Cytometry of CD8+ T cells from CB (8 patients) and dBM (4 patients). Two-tailed unpaired t test. b, Cytometric S1PR1 levels from freshly isolated PBMC versus dBM (5 patients); PBMC versus CB (7 patients) samples of patients with glioblastoma. One-way ANOVA corrected for multiple comparisons (Šídák test). c, Phenotype frequency among CB-derived S1PR1+ CD8+ cells (n = 7). d, Schematic concept. e, ELISpot data, split by source (patient 21). Technical replicates shown as individual dots. Mean ± s.e.m., two-way ANOVA corrected for multiple comparisons (Dunnett test), P values indicated. f, Summary graph of MHC-dependent spot mean data, as in e, n = 3 patients with glioblastoma. Paired data indicated. g, Killing assay. Left, phase contrast appearance at readout, after exposure to CD8+ T cells. Scale bar indicated. Right, graph represents percentage of viable tumor cells relative to input. Technical replicates as individual dots. Mean ± s.e.m., one of two independent experiments with similar results (patient 21). One-way ANOVA corrected for multiple comparisons (Šídák test), P values indicated. h, Frequency of predicted tumor reactivity in individual CD8+ T cells by predicTCR. (n) patients per source: PBMC (2 patients), dBM (3 patients), CB (6 patients), tumor (6 patients). i, Bar plots per source aligning top 50 CD8+ clonotypes by frequency. j, UMAP of CD8+ T cells with paired scVDJ information (n = 14,960), categorized by T cell subtype. Inset displays tumor reactivity by predicTCR. k, Frequency of predicted tumor reactivity among tumor-shared CD8+ clonotypes, by source. l, Stacked bar plots visualizing CD8+ T cell phenotypes among tumor-reactive clonotypes shared between CB and tumor, split per source. m, Illustration of sites assessed for PET–CT/MRI-specific Pentixafor labeling. n, Presurgical CXCR4 PET–CT data, secondary MRI fused, showing examples with (red) and without (blue) radiotracer enhancement in the CB at initial diagnosis. Insets magnify selected CB areas. Arrowheads point to radiotracer enhancement. o, Kaplan–Meier survival plot of patients with glioblastoma. Censored data and P value indicated. log-rank (Mantel–Cox) test. Source data
Extended Data Fig. 1
Extended Data Fig. 1. Clinical [68Ga]Ga-Pentixafor radiolabeling.
a, Representative imaging results of 19 patients with newly-diagnosed glioblastoma prior to neurosurgical tumor removal (patient 1 and 2 also included in Fig. 1). Clinical radiolabeling of CXCR4 and CT/MRI fusion allows identification of glioblastoma parenchyma (asterisks) and surrounding encephalic and cranial structures. b, Representative Pentixafor PET-CT imaging data obtained from six patients diagnosed with Conn’s syndrome, as a control, not suffering from intracranial neoplasia. Note the absence of tracer accumulation within the cranial bone.
Extended Data Fig. 2
Extended Data Fig. 2. Immune cell accumulation in the cranial bone of patients with glioblastoma.
a, Confocal immunofluorescence imaging of large CB tissue sections from four additional patients with non-malignant intracranial disease (NTC, non-tumor control; patients c15, c3, c16, c17), complementing presentation in Fig. 1f,g. Scale bars indicated. b, CB histological appearance of samples from two additional patients with glioblastoma (patients 29, 30), complementing presentation in Fig. 1h–k. Magnifications in the insets, scale bars indicated. c, Graphs present estimated immune cell frequencies in CB large tissue sections, quantified by labeling with DAPI and CD45 (data from n = 2 glioblastoma (GB) and n = 4 NTC counting cells in 12 vs. 20 cavities, respectively). d, Schematic illustrating derivation of vital cells from the CB cavities for follow-up investigation. Source data
Extended Data Fig. 3
Extended Data Fig. 3. Immune cell derivation and cell type identification.
a, Illustration of the workflow for sample processing and analysis of cells from sc-cohort 1 (see Methods). Samples from CB (n = 13), tumor tissue (n = 6) and PBMC (n = 10) enriched by CD45+ magnetic cell isolation. Single cells were further analyzed by scRNA-seq (10X Genomics) and integrated data were used for subsequent analyses. b, Split UMAP plots visualizing the distribution of annotated single cells by source. c, UMAP visualization of listed canonical marker genes of annotated cell types. Cells are colored by the respective gene set enrichment scores calculated via AUCell. d, Global UMAP of T cell types. Note, cells annotated as unknown or low quality were excluded from subsequent analyses. e, Bubble plot depicts the average expression levels and the fractions of cells expressing selected marker genes across the T cell types annotated in (d). f, Cluster-based annotation of CD8+ T cell subspace.
Extended Data Fig. 4
Extended Data Fig. 4. Immune cell quantification based on the Immunoprofiling Assay.
a, Representative gating strategy. Identified phenotypes, sample origin/number as indicated. b, Boxplot extends from 25th to 75th percentile, displaying median and minimum/maximum ranges as whiskers, summarizing frequency data (% of CD45+ non-granulocytes) of indicated immune cell phenotypes, separated by source. Biological replicates, n indicated in (a). c, Representative dotplot displaying selected CD8+ T cell phenotypes, as indicated in red. Note, analysis excluded naive CD8+ T cells. d, Stacked bar plot indicating phenotype distribution per patient and source from listed patients. e, Graphs show frequencies of phenotypes in paired samples. Biological replicates (n = 8). Two-tailed paired t-test; p values indicated. Source data
Extended Data Fig. 5
Extended Data Fig. 5. Myeloid compartment.
a, Phate plot representing the reference-based annotation of myeloid phenotypes in the single cell data presented in main Fig. 2. b, Phate plot as in (a), displaying the distribution of myeloid cells, color coded by source. c, Stacked barplots indicate frequencies of myeloid cells per source and disease condition. d, Cytometric profiling of myeloid cells. Gating strategy used to identify potential monocytic myeloid-derived suppressor cells (M-MDSCs) utilizing the listed markers. Note, raw data derived from assay shown in Extended Data Fig. 4. e, Boxplot extends from 25th to 75th percentile, displaying median and minimum/maximum ranges as whiskers, summarizing frequency data of potential M-MDSCs from (d), separated by source. Biological replicate data from (n) patients: GB-CB (8), GB-PBMC (8), GB-Tumor (7), GB-dBM (4); NTC-CB (5), NTC-PBMC (4). Source data
Extended Data Fig. 6
Extended Data Fig. 6. Distinct cytometric gating strategies for selected experimental approaches.
a, Related to main Fig. 3c, re-stimulation assay. Gating used to identify CD8+ T cell subsets at different stages (CD45 expanded, re-stimulation I, II and III). b, Related to main Fig. 4b, acutely isolated CD45+ immune cells. Gating used to identify CD3+ T cells expressing S1PR1. c, related to main Fig. 4c. Sub-characterization of S1PR1+ CD8+ T cell phenotypes from (b).
Extended Data Fig. 7
Extended Data Fig. 7. Developmental range assessment.
a, Density plot illustrates the distribution of glioblastoma 3′ GEX CD8+ T cell data across the complete range of CytoTRACE scores, split by source. Note uniform distribution across all developmental stages in CB. b, Violin plot illustrating distribution of CBe CD8+ T cells across CytoTRACE scores from (a), split by source. Boxplots display median, quartiles and values within 1.5× interquartile range as whiskers. Biological replicate data from (n) patients: Cranial bone (5), tumor (3). No statistically significant difference detected by two-sided Wilcoxon rank sum test with p value adjustments Holm method (SeuratExtend).
Extended Data Fig. 8
Extended Data Fig. 8. Arrangement of immune cells in the cranial bone.
a, Immunofluorescent labeling of CD3 (red; T cells) and CD20 (green; B cells) in histological section from CB fragments of one patient with non-malignant intracranial disease (patient c6), and one patient with glioblastoma (patient 10). Nuclei were DAPI counterstained (blue). Note the lack of higher morphological organization of the tissue. Follicular arrangements, which are characteristic of matured tertiary lymphoid structures are not evident. Scale bars: 10 µm. b, Gene set enrichment score of a 12-chemokine reference TLS signature does not indicate enrichment in the CB single-cell data set. Scores were calculated via AUCell and depicted as UMAP, colored by score or as a violin plot, respectively, split by biological replicate data source. Cranial bone (n = 13), PBMC (n = 10) and tumor tissue (n = 6). Boxplots display median, quartiles and values within 1.5× interquartile range as whiskers. Gene set enrichment scores are shown across all annotated cell types (upper panel) or in B and T cells (CD4+/CD8+/MAIT) alone (lower panel).
Extended Data Fig. 9
Extended Data Fig. 9. Sample preparation and annotation of sc-cohort 2.
a, Sample processing and analysis workflow. Single cells from CB, tumor tissue and distal bone marrow (n = 3; patients 21, 22, 24) were enriched for CD45+/CD14 cells by magnetic cell separation and further processed for scRNA-seq (10x Genomics) b, UMAP projection of integrated space. Inset colored according to the gene set enrichment score of canonical T cell marker genes, calculated via AUCell. c, UMAP of all T cells displaying annotated subtypes. Cells annotated as low quality were excluded from subsequent analyses. d, UMAP plot of CD8+ T cell subset colored by source. e, Annotated CD8+ phenotypes by label transfer from CD8+ T cells of sc-cohort 1 (see Fig. 3e) using singleCellNet.
Extended Data Fig. 10
Extended Data Fig. 10. Correlation of clinical and PET-CT/MRI data.
a, Design of study. b, Data considered for univariate analyses. Note that low number of cases per group (n < 10) precludes multivariate analysis. A, two-sided Fisher’s exact test; B, two-sided Student’s t-test; C, log-rank (Mantel-Cox) test. n, number of patients with glioblastoma.

References

    1. Castellani, G., Croese, T., Peralta Ramos, J. M. & Schwartz, M. Transforming the understanding of brain immunity. Science380, eabo7649 (2023). - PubMed
    1. Rustenhoven, J. et al. Functional characterization of the dural sinuses as a neuroimmune interface. Cell184, 1000–1016 (2021). - PMC - PubMed
    1. Mollgard, K. et al. A mesothelium divides the subarachnoid space into functional compartments. Science379, 84–88 (2023). - PubMed
    1. Sankowski, R. et al. Multiomic spatial landscape of innate immune cells at human central nervous system borders. Nat. Med.30, 186–198 (2024). - PMC - PubMed
    1. Louveau, A. et al. Structural and functional features of central nervous system lymphatic vessels. Nature523, 337–341 (2015). - PMC - PubMed

Substances

LinkOut - more resources