. 2024 Aug;632(8023):209-217.
doi: 10.1038/s41586-024-07742-0. Epub 2024 Jul 31.

Molecular mechanism of ligand gating and opening of NMDA receptor

Affiliations

Molecular mechanism of ligand gating and opening of NMDA receptor

Tsung-Han Chou et al. Nature. 2024 Aug.

Abstract

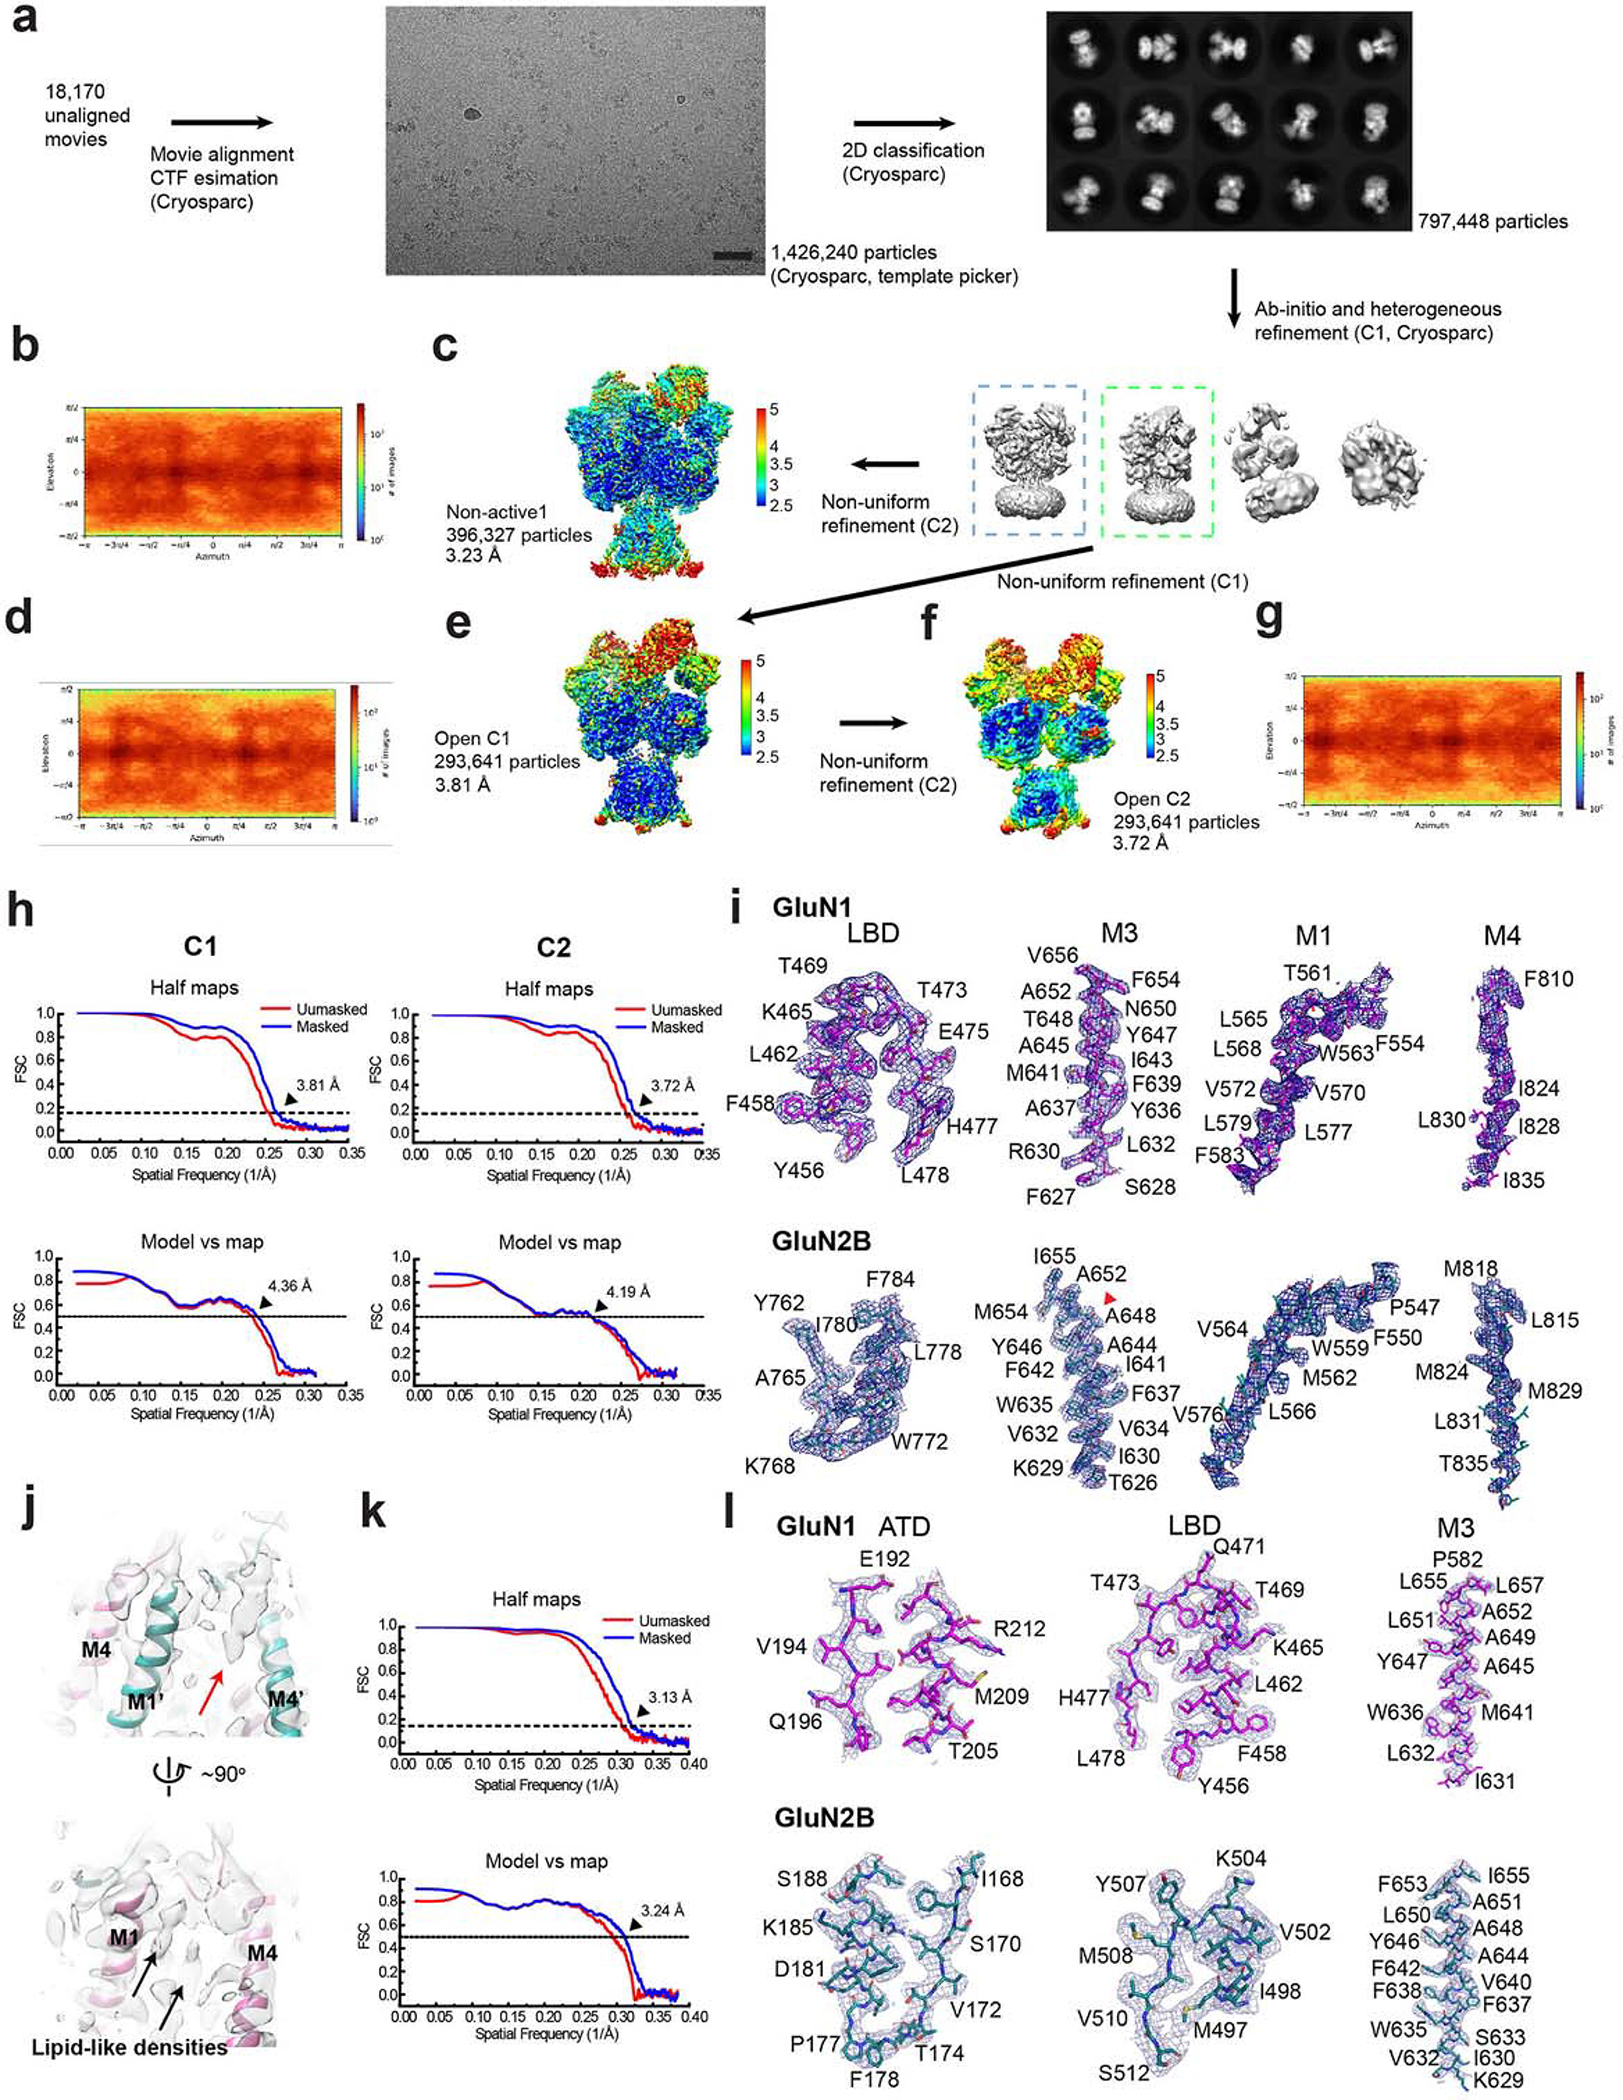
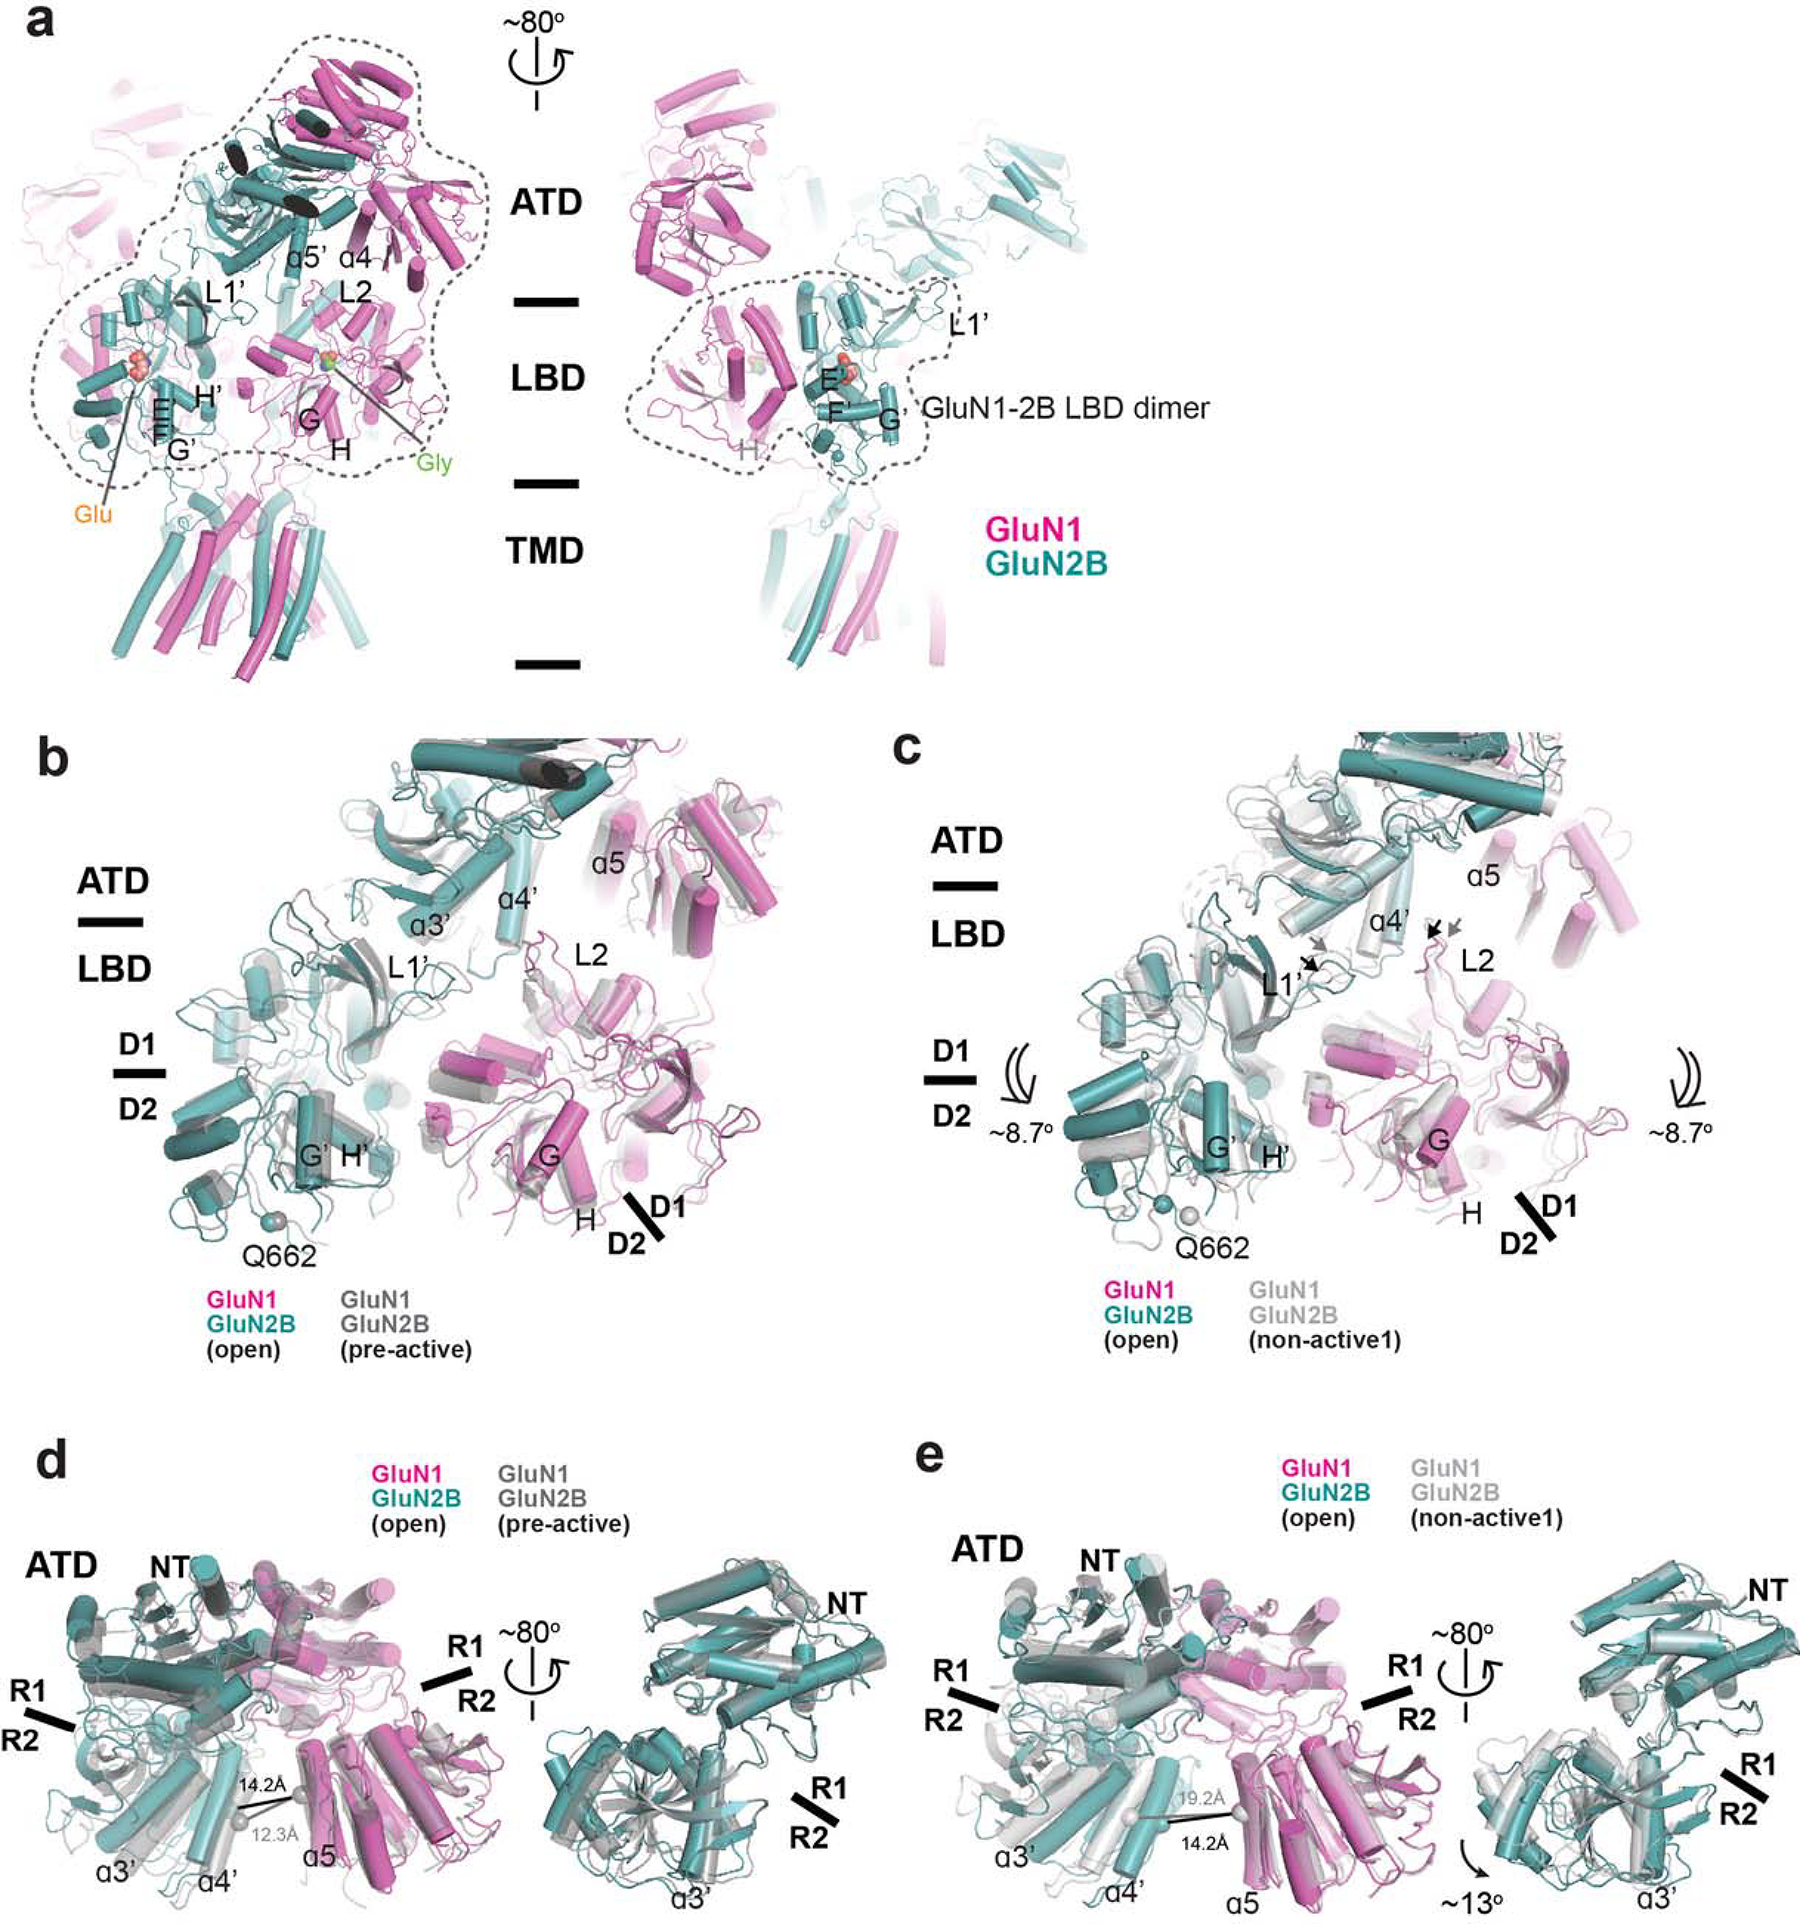
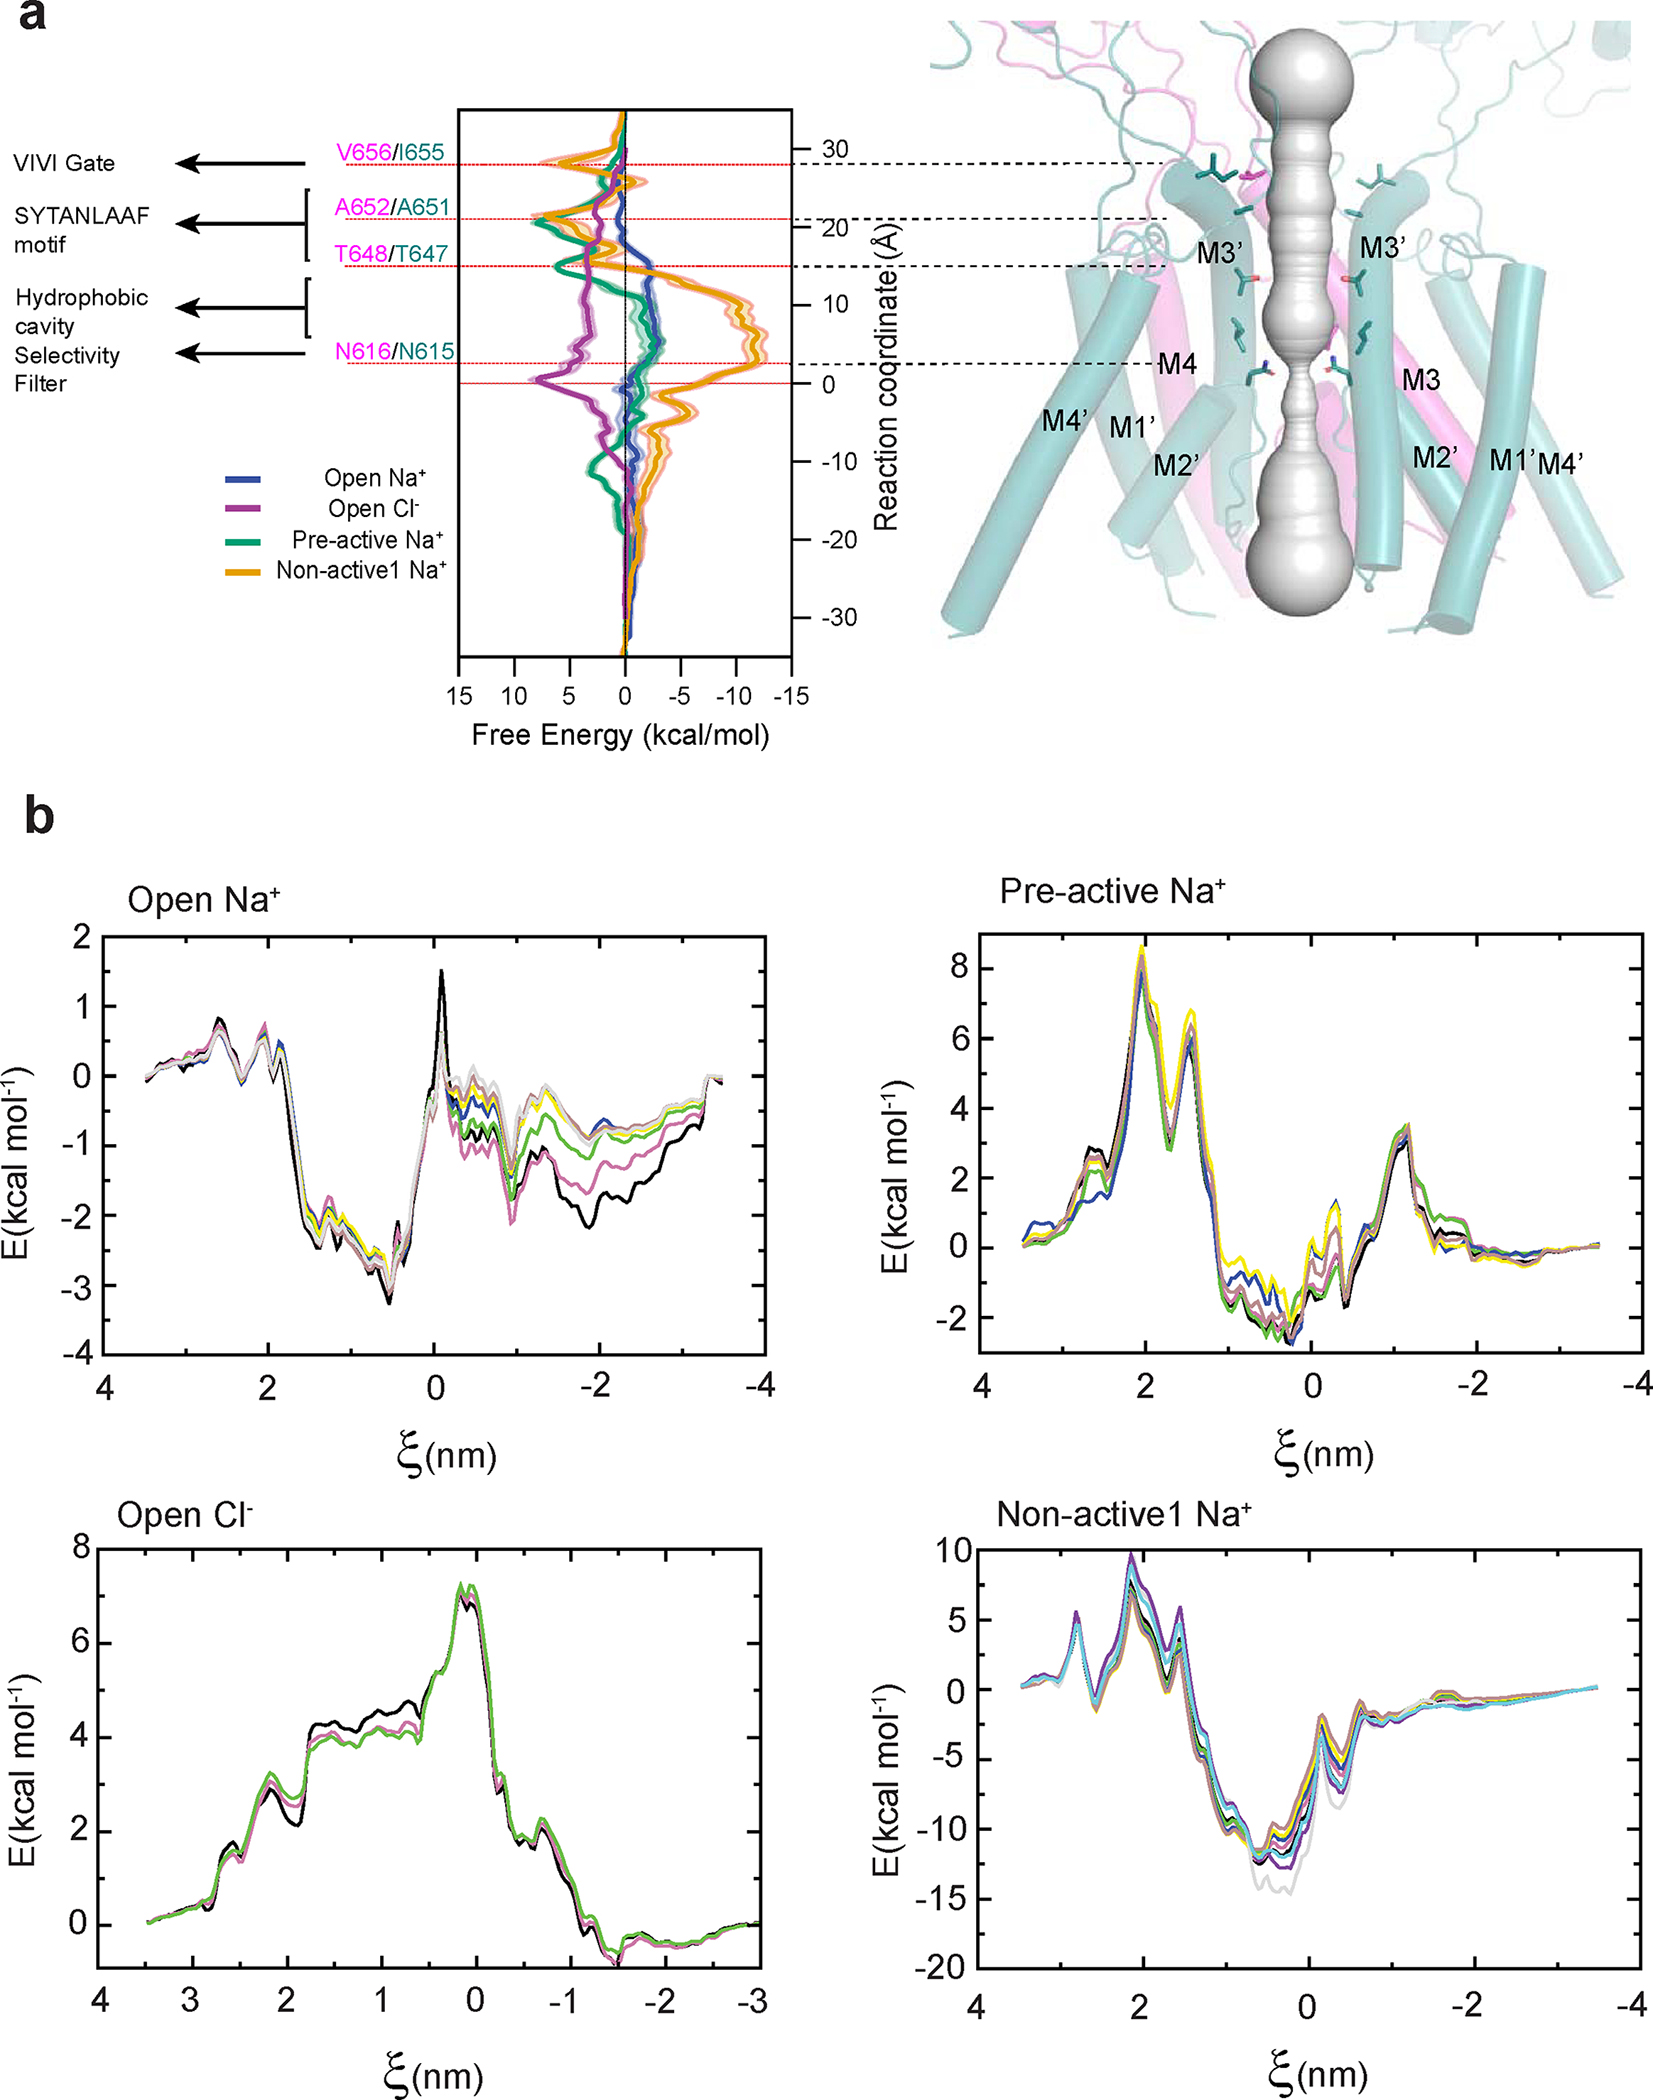
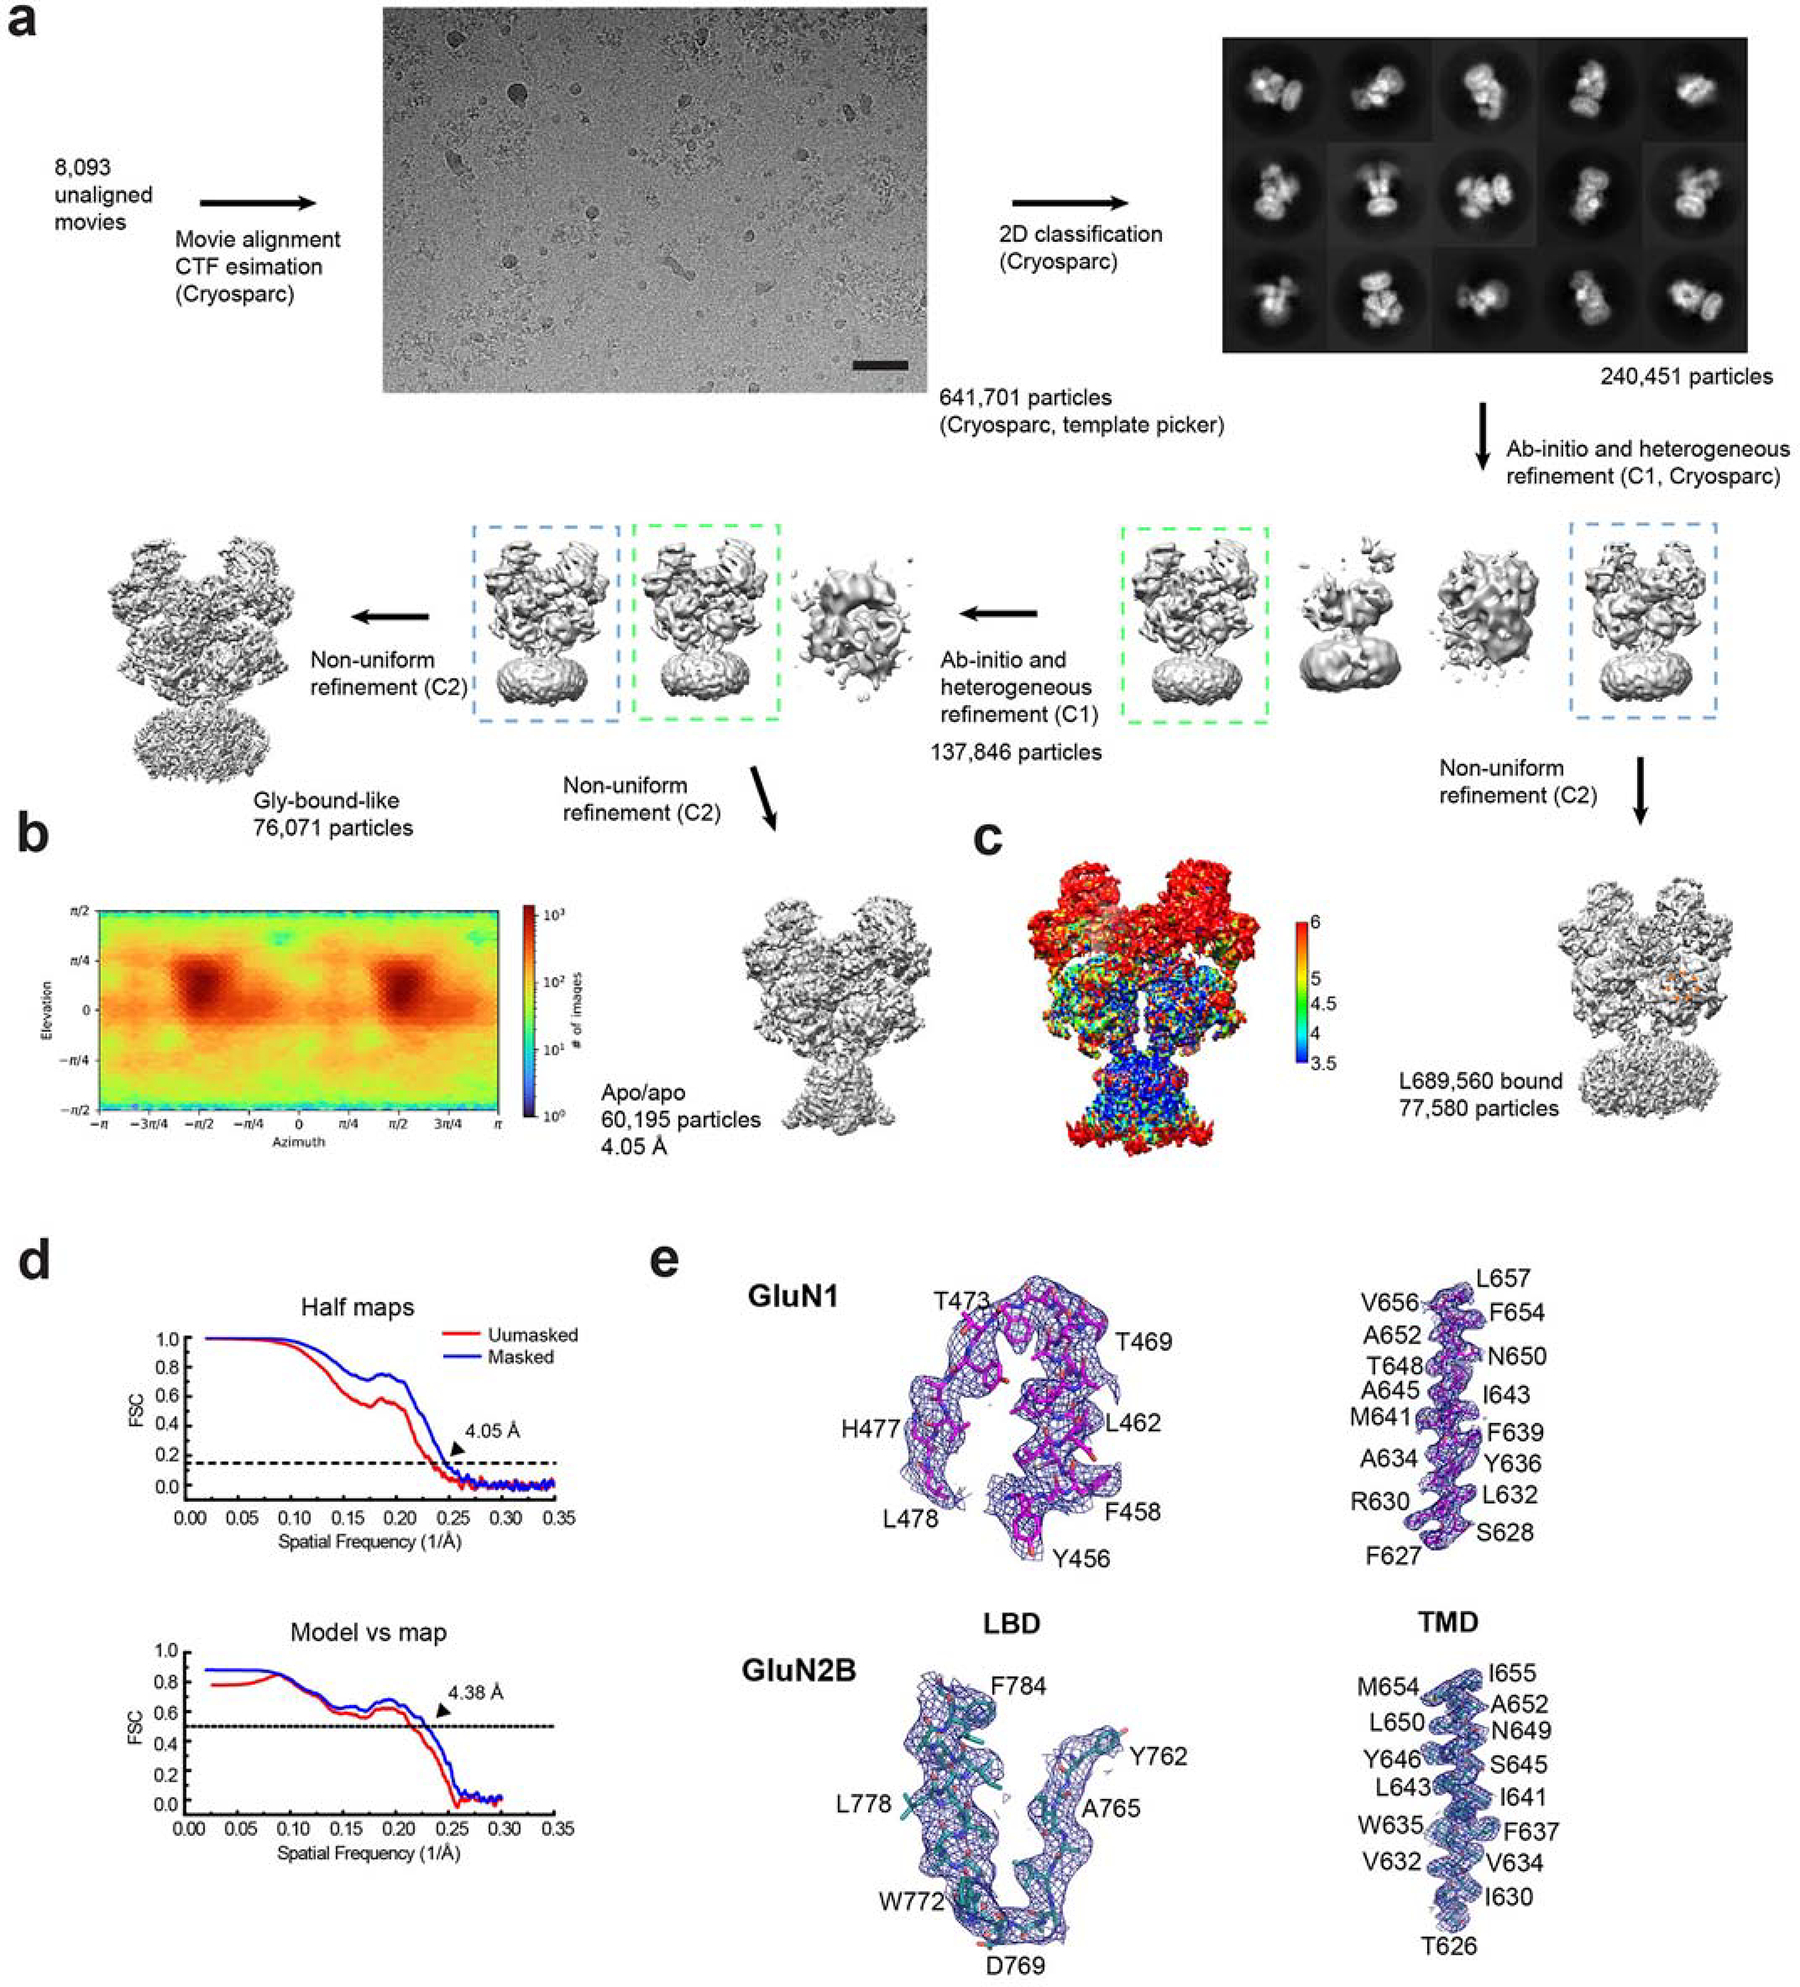
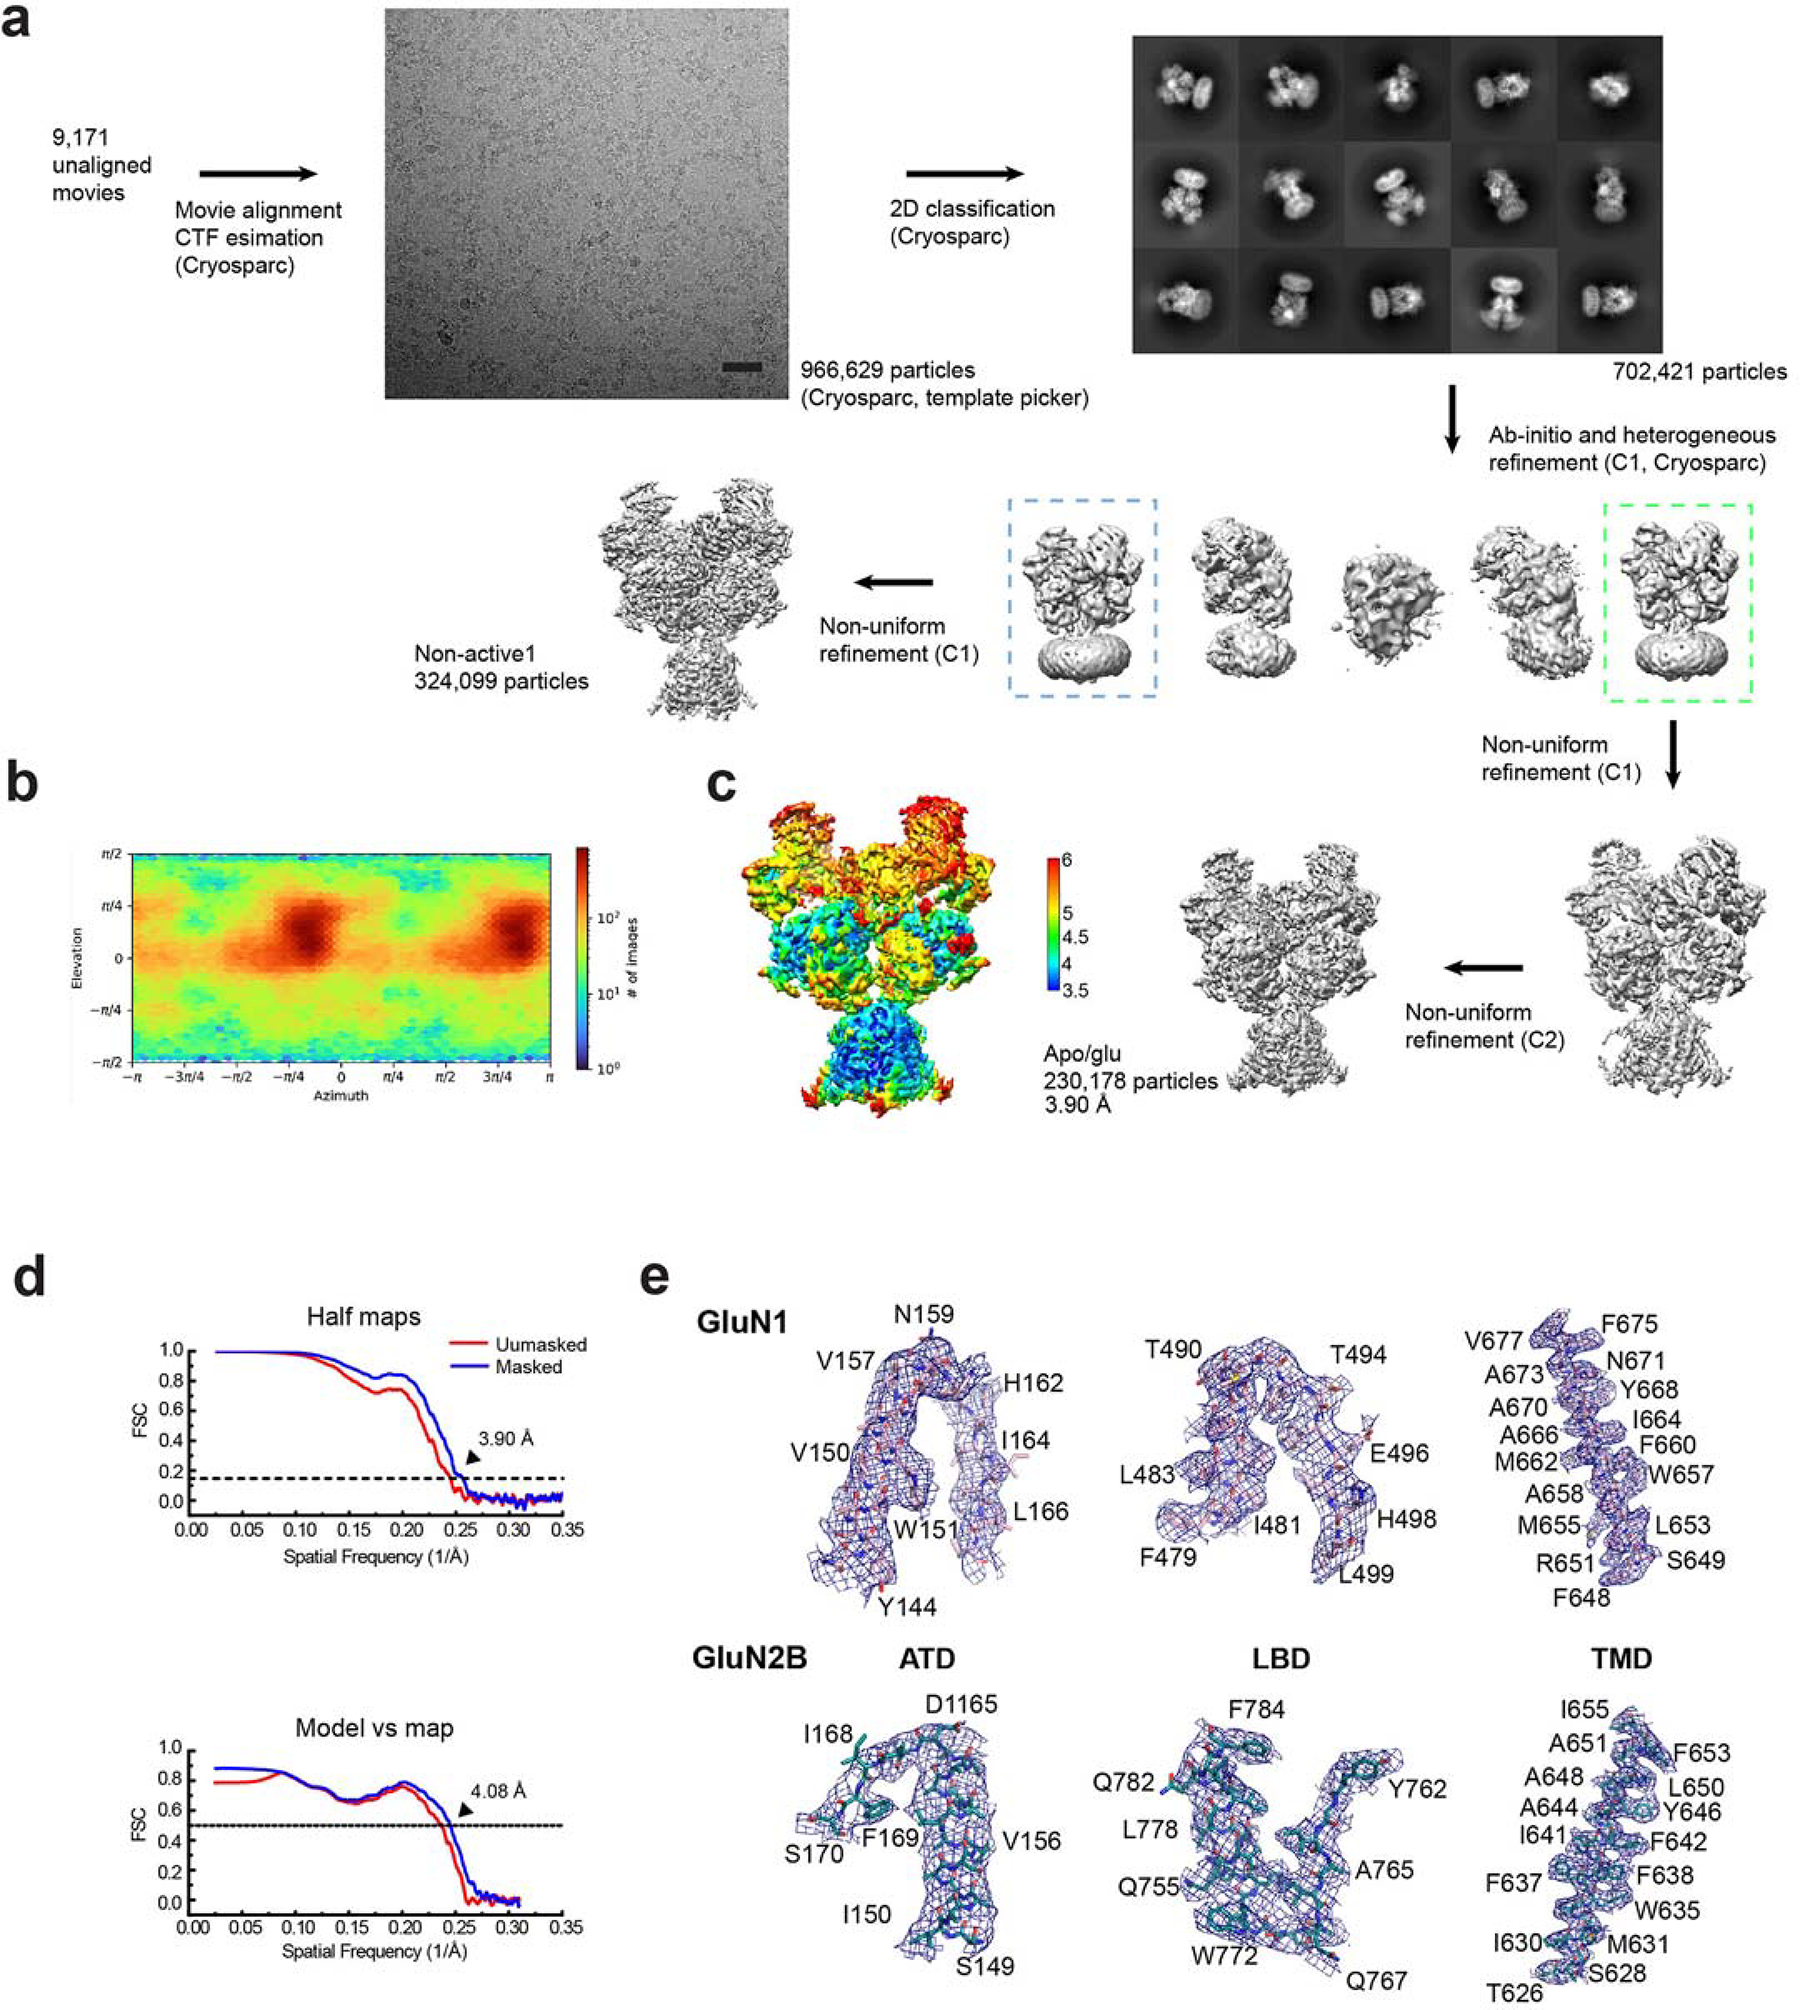
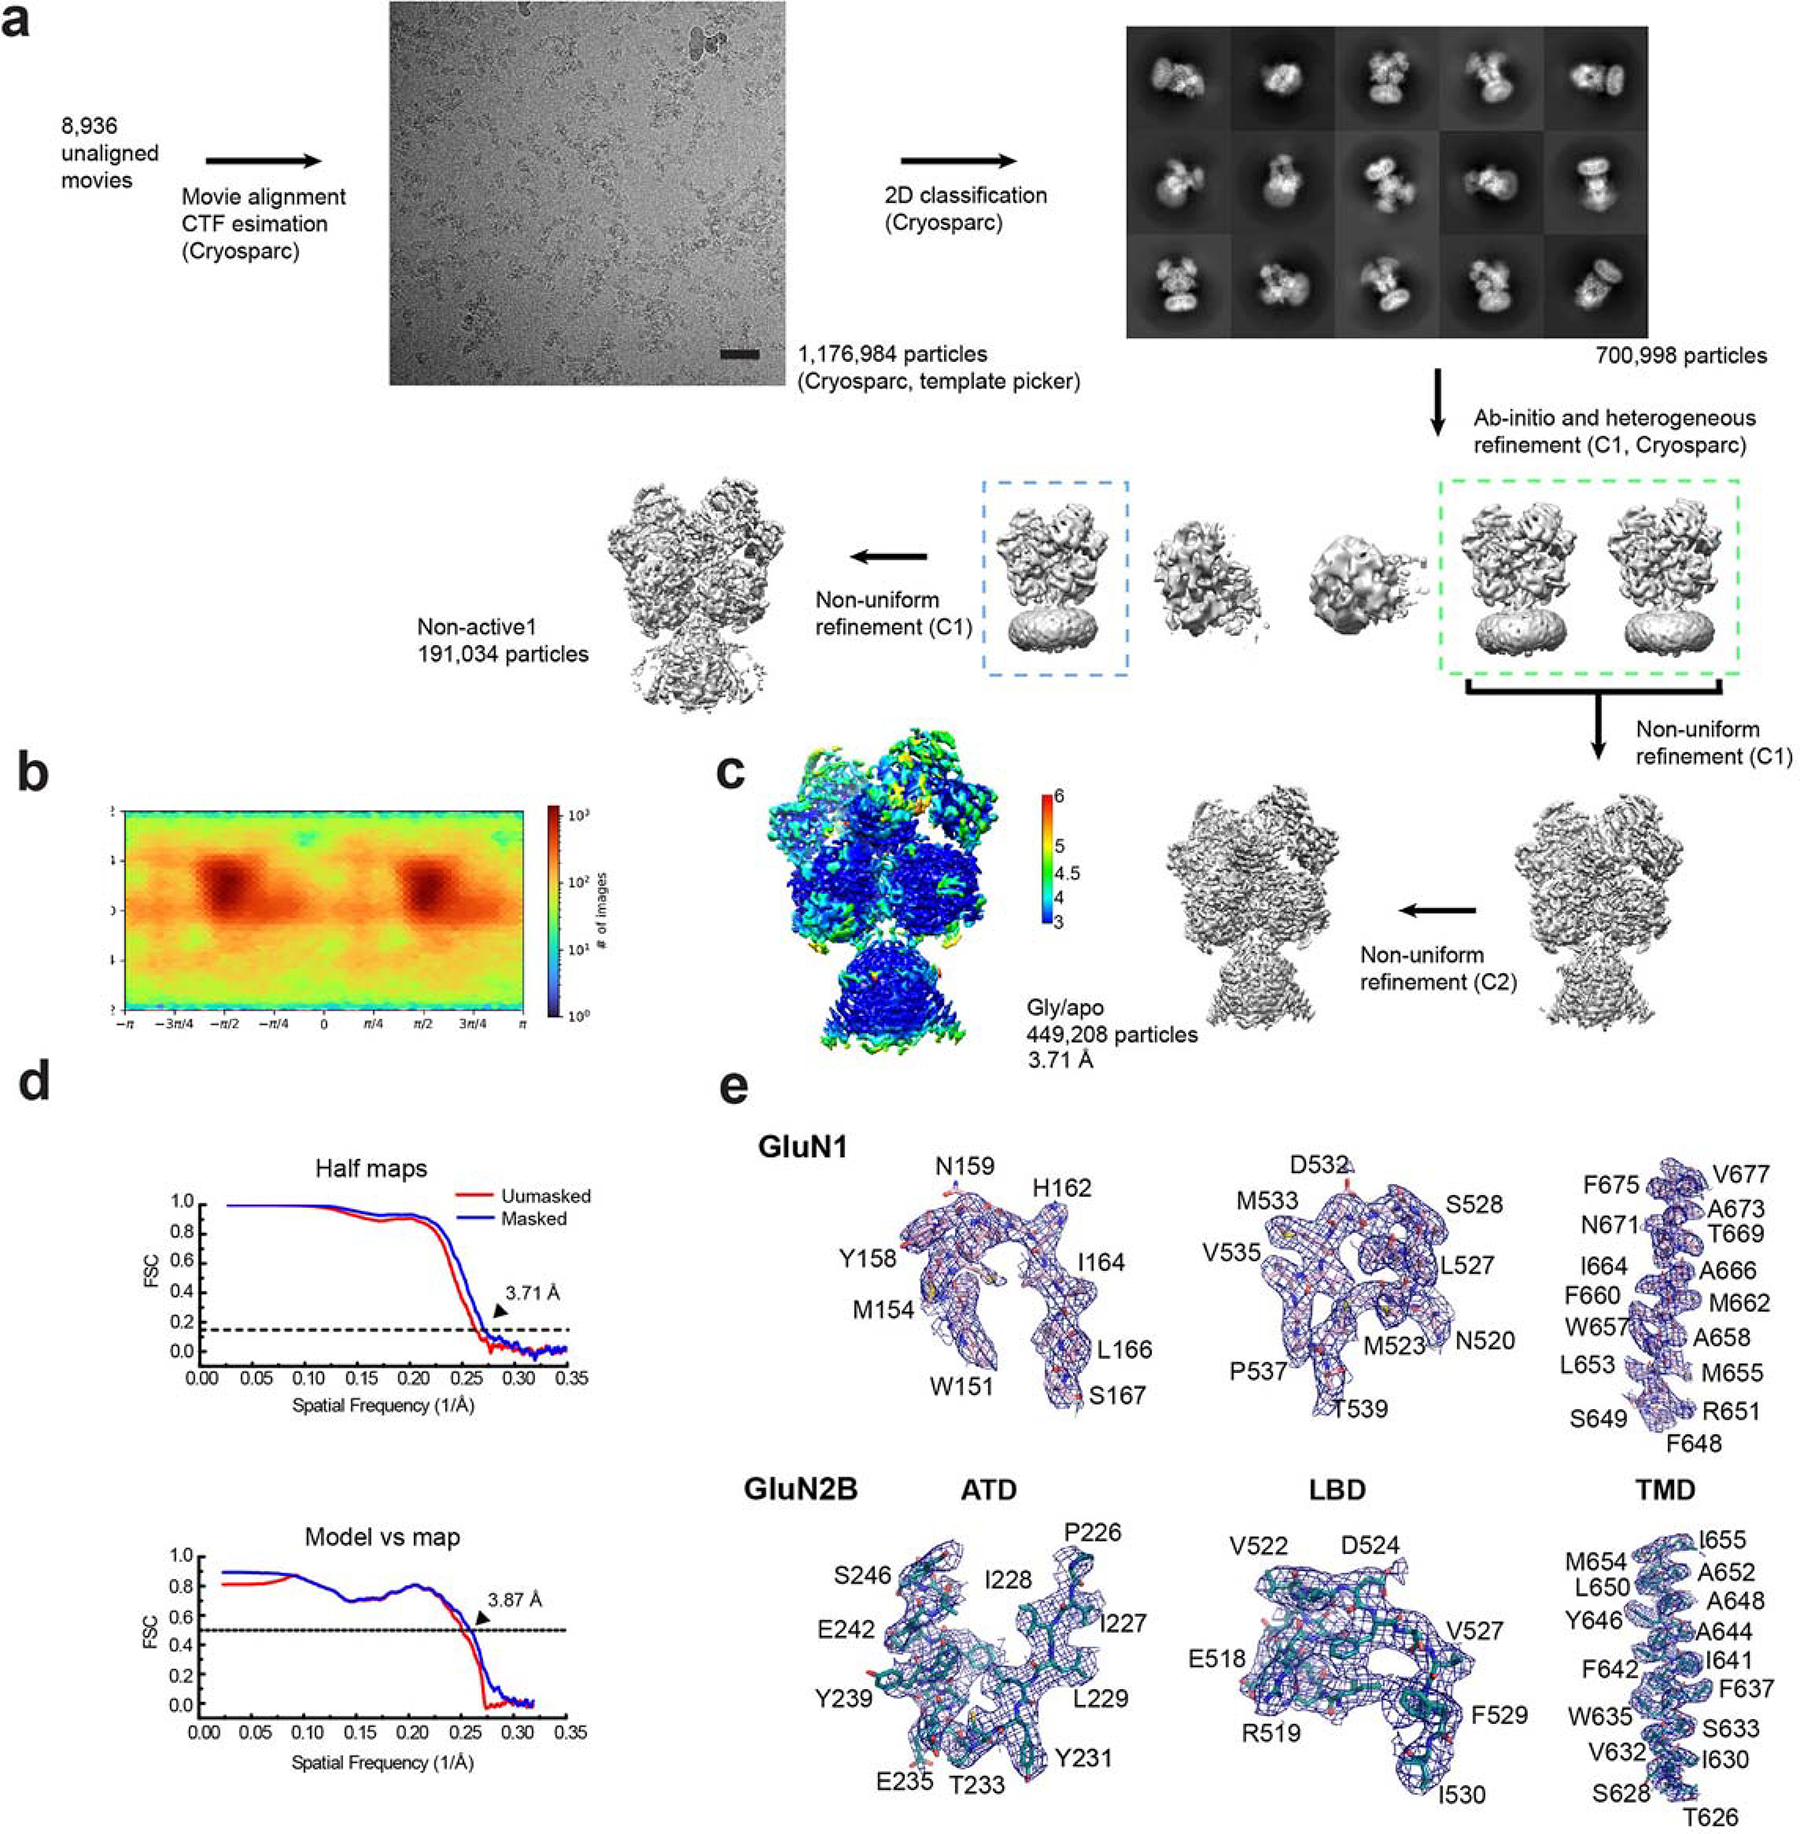
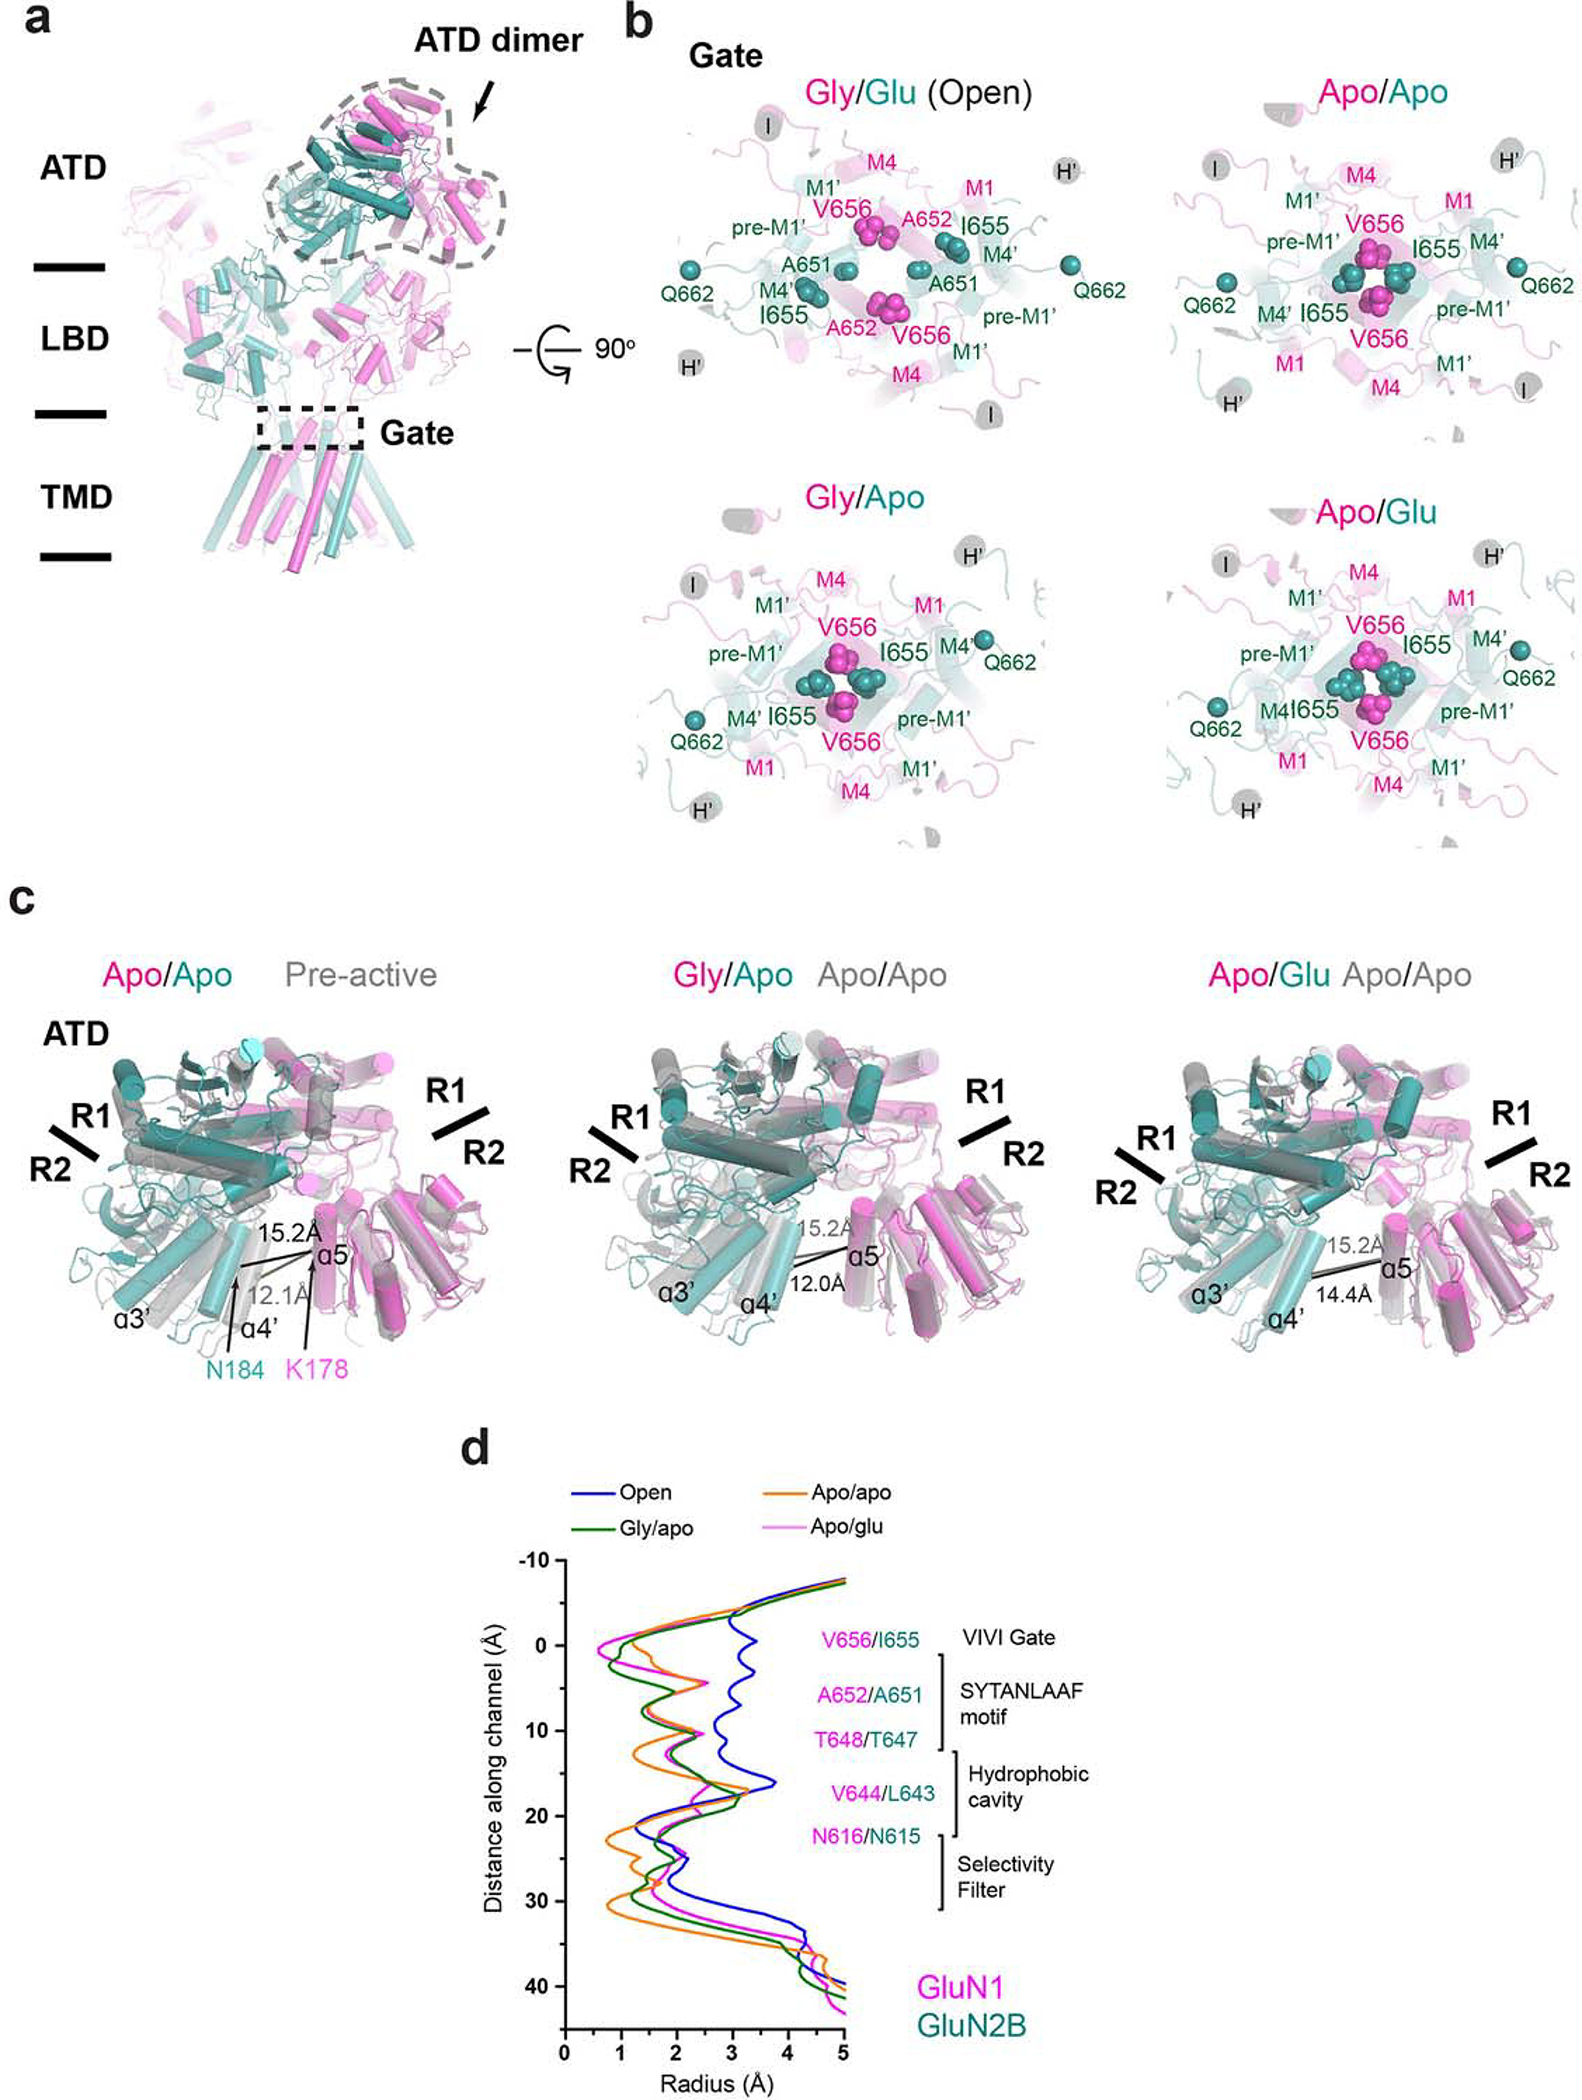
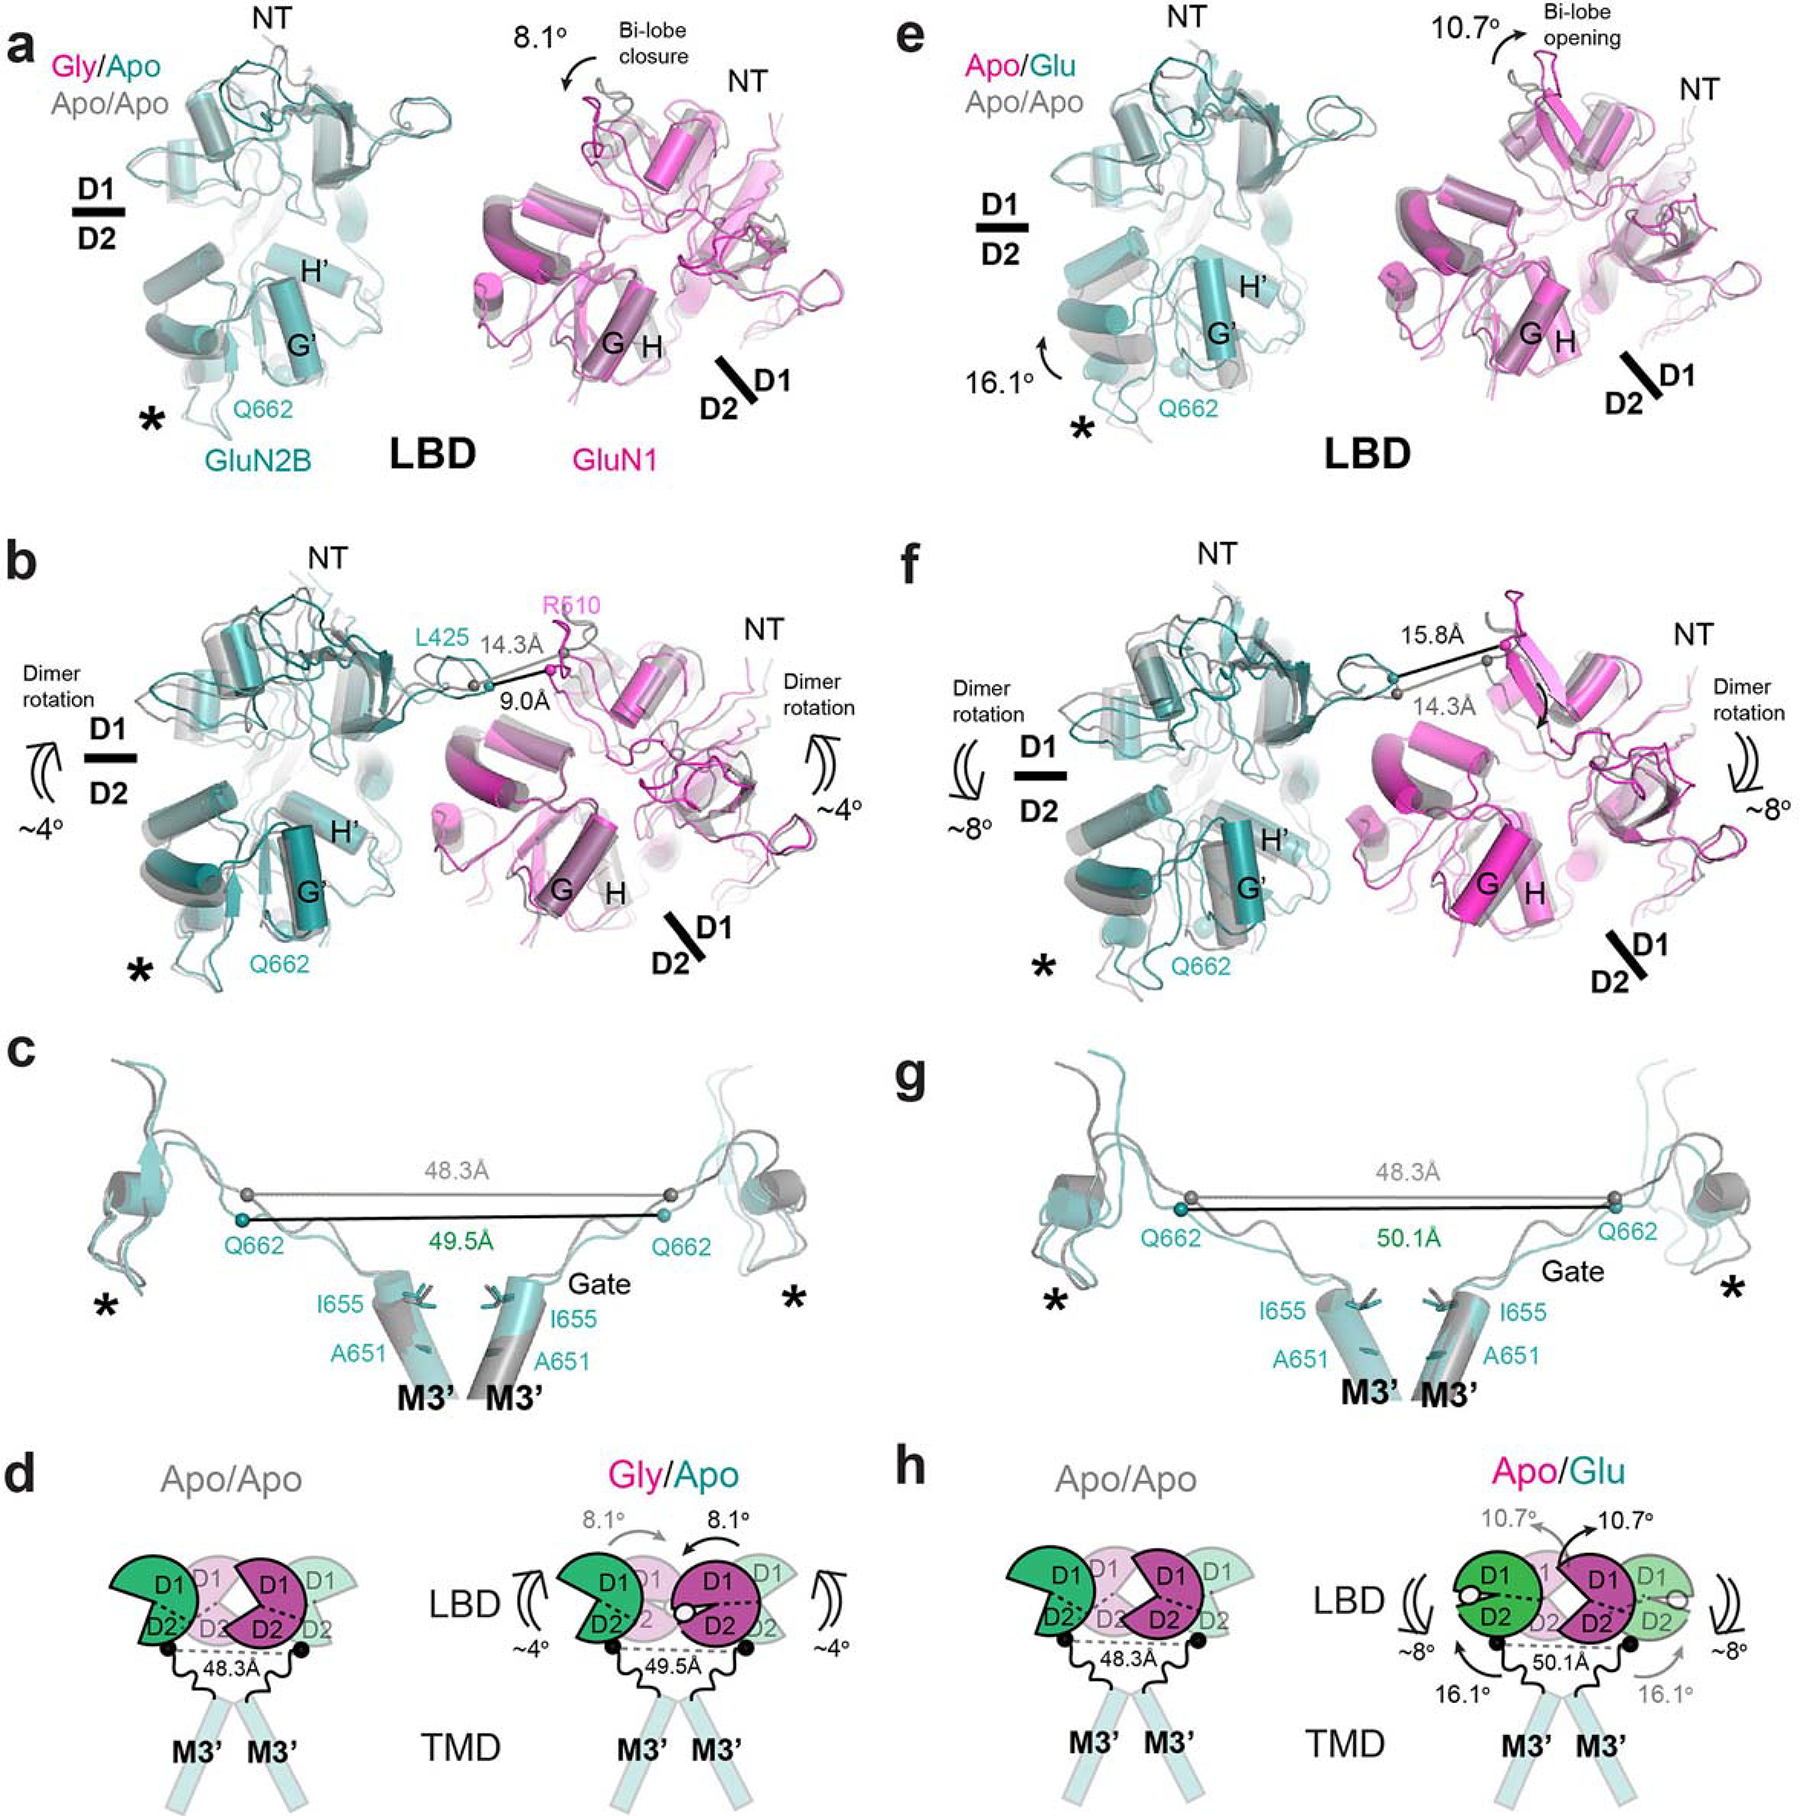
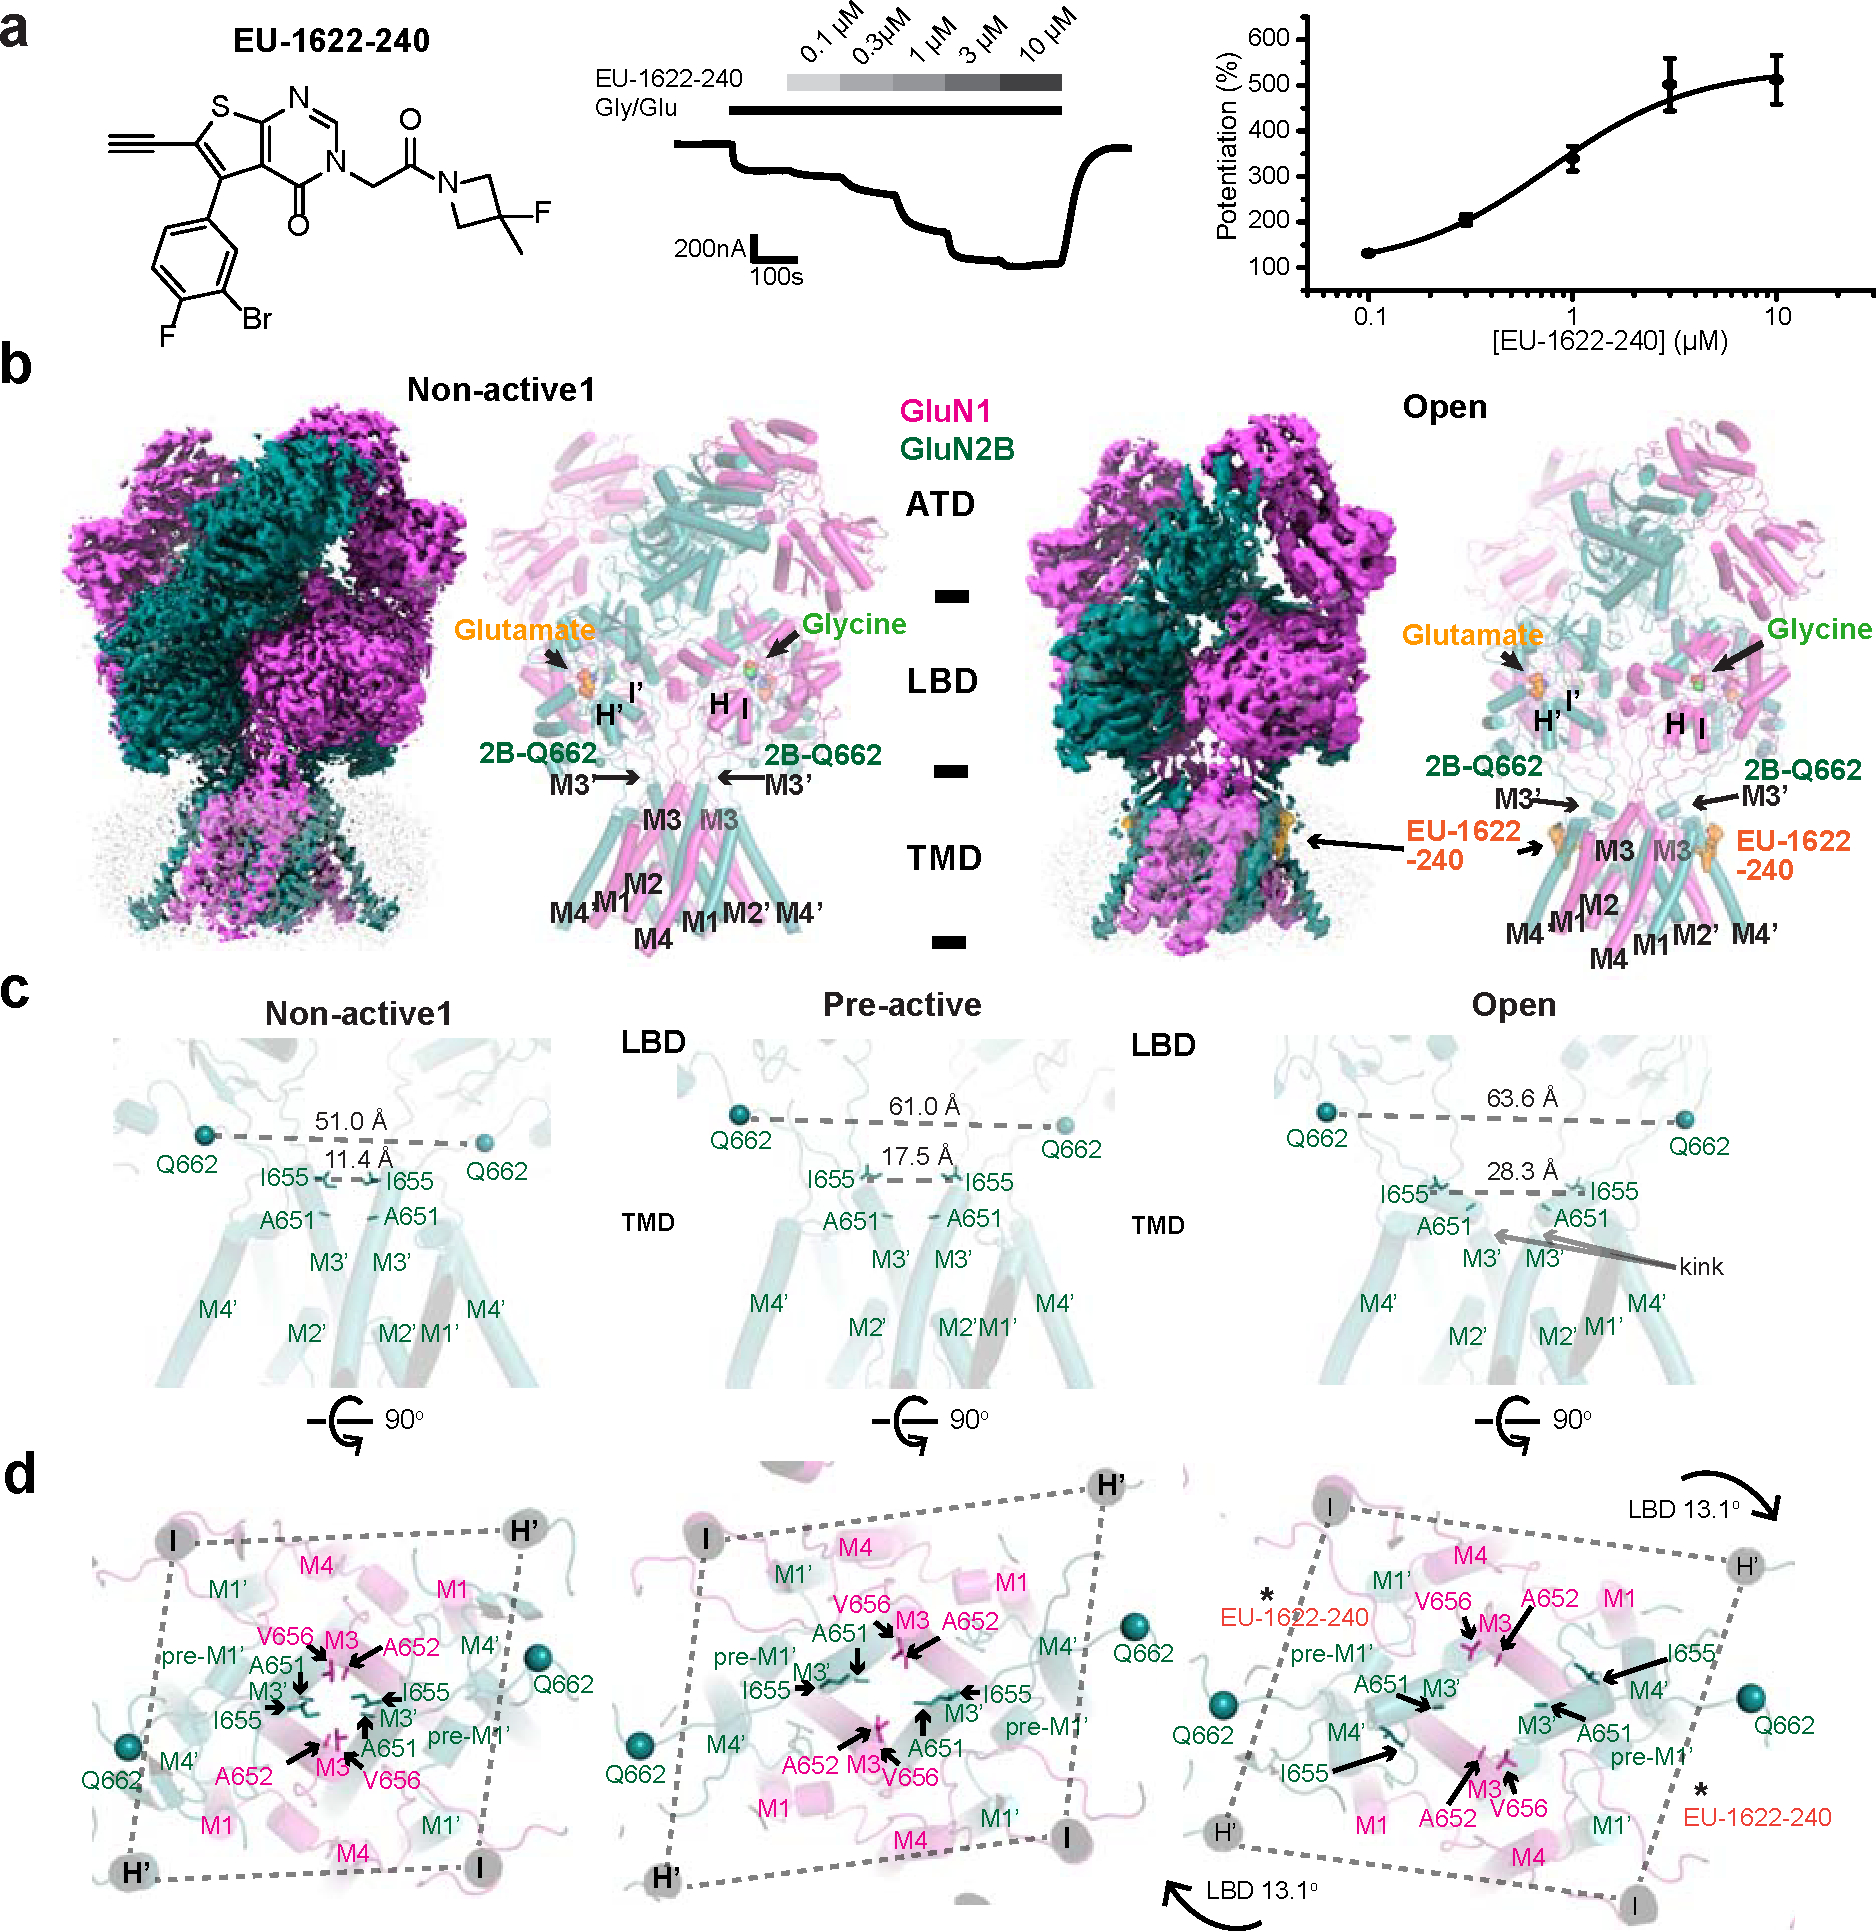
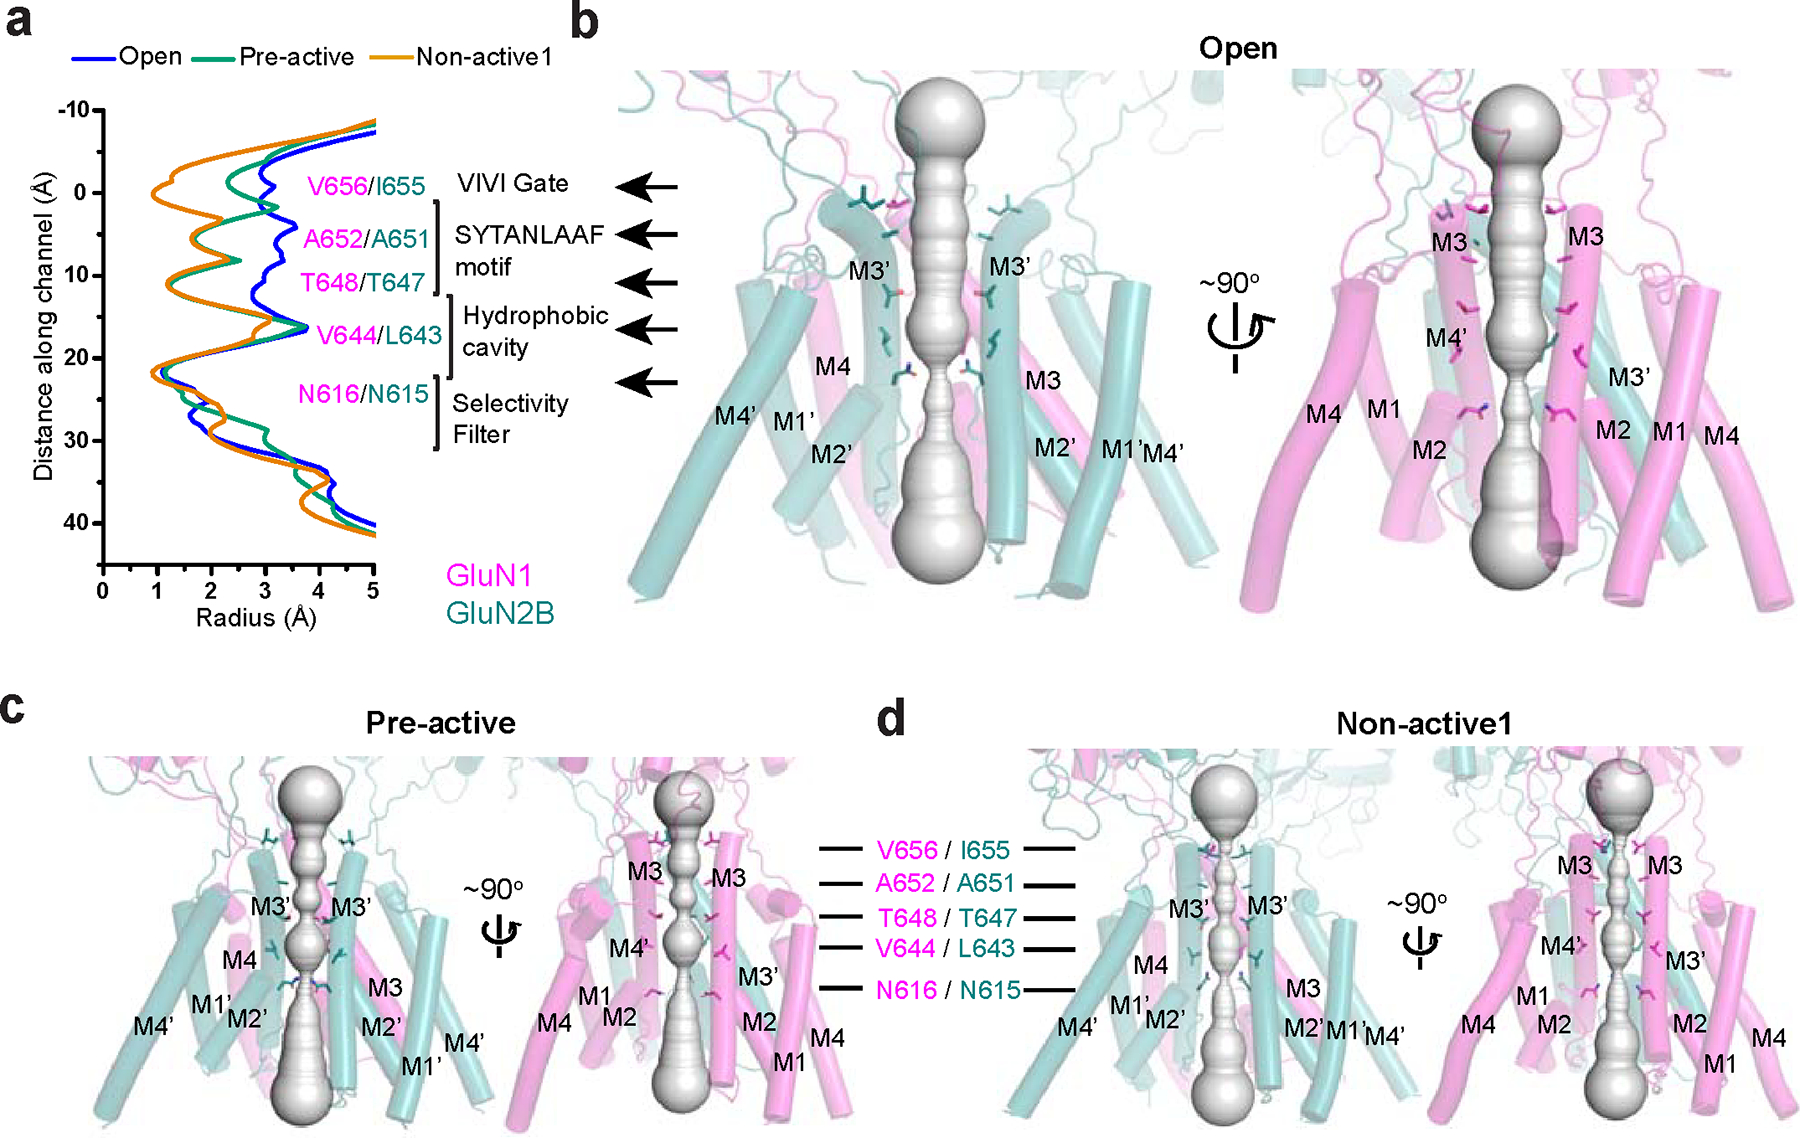
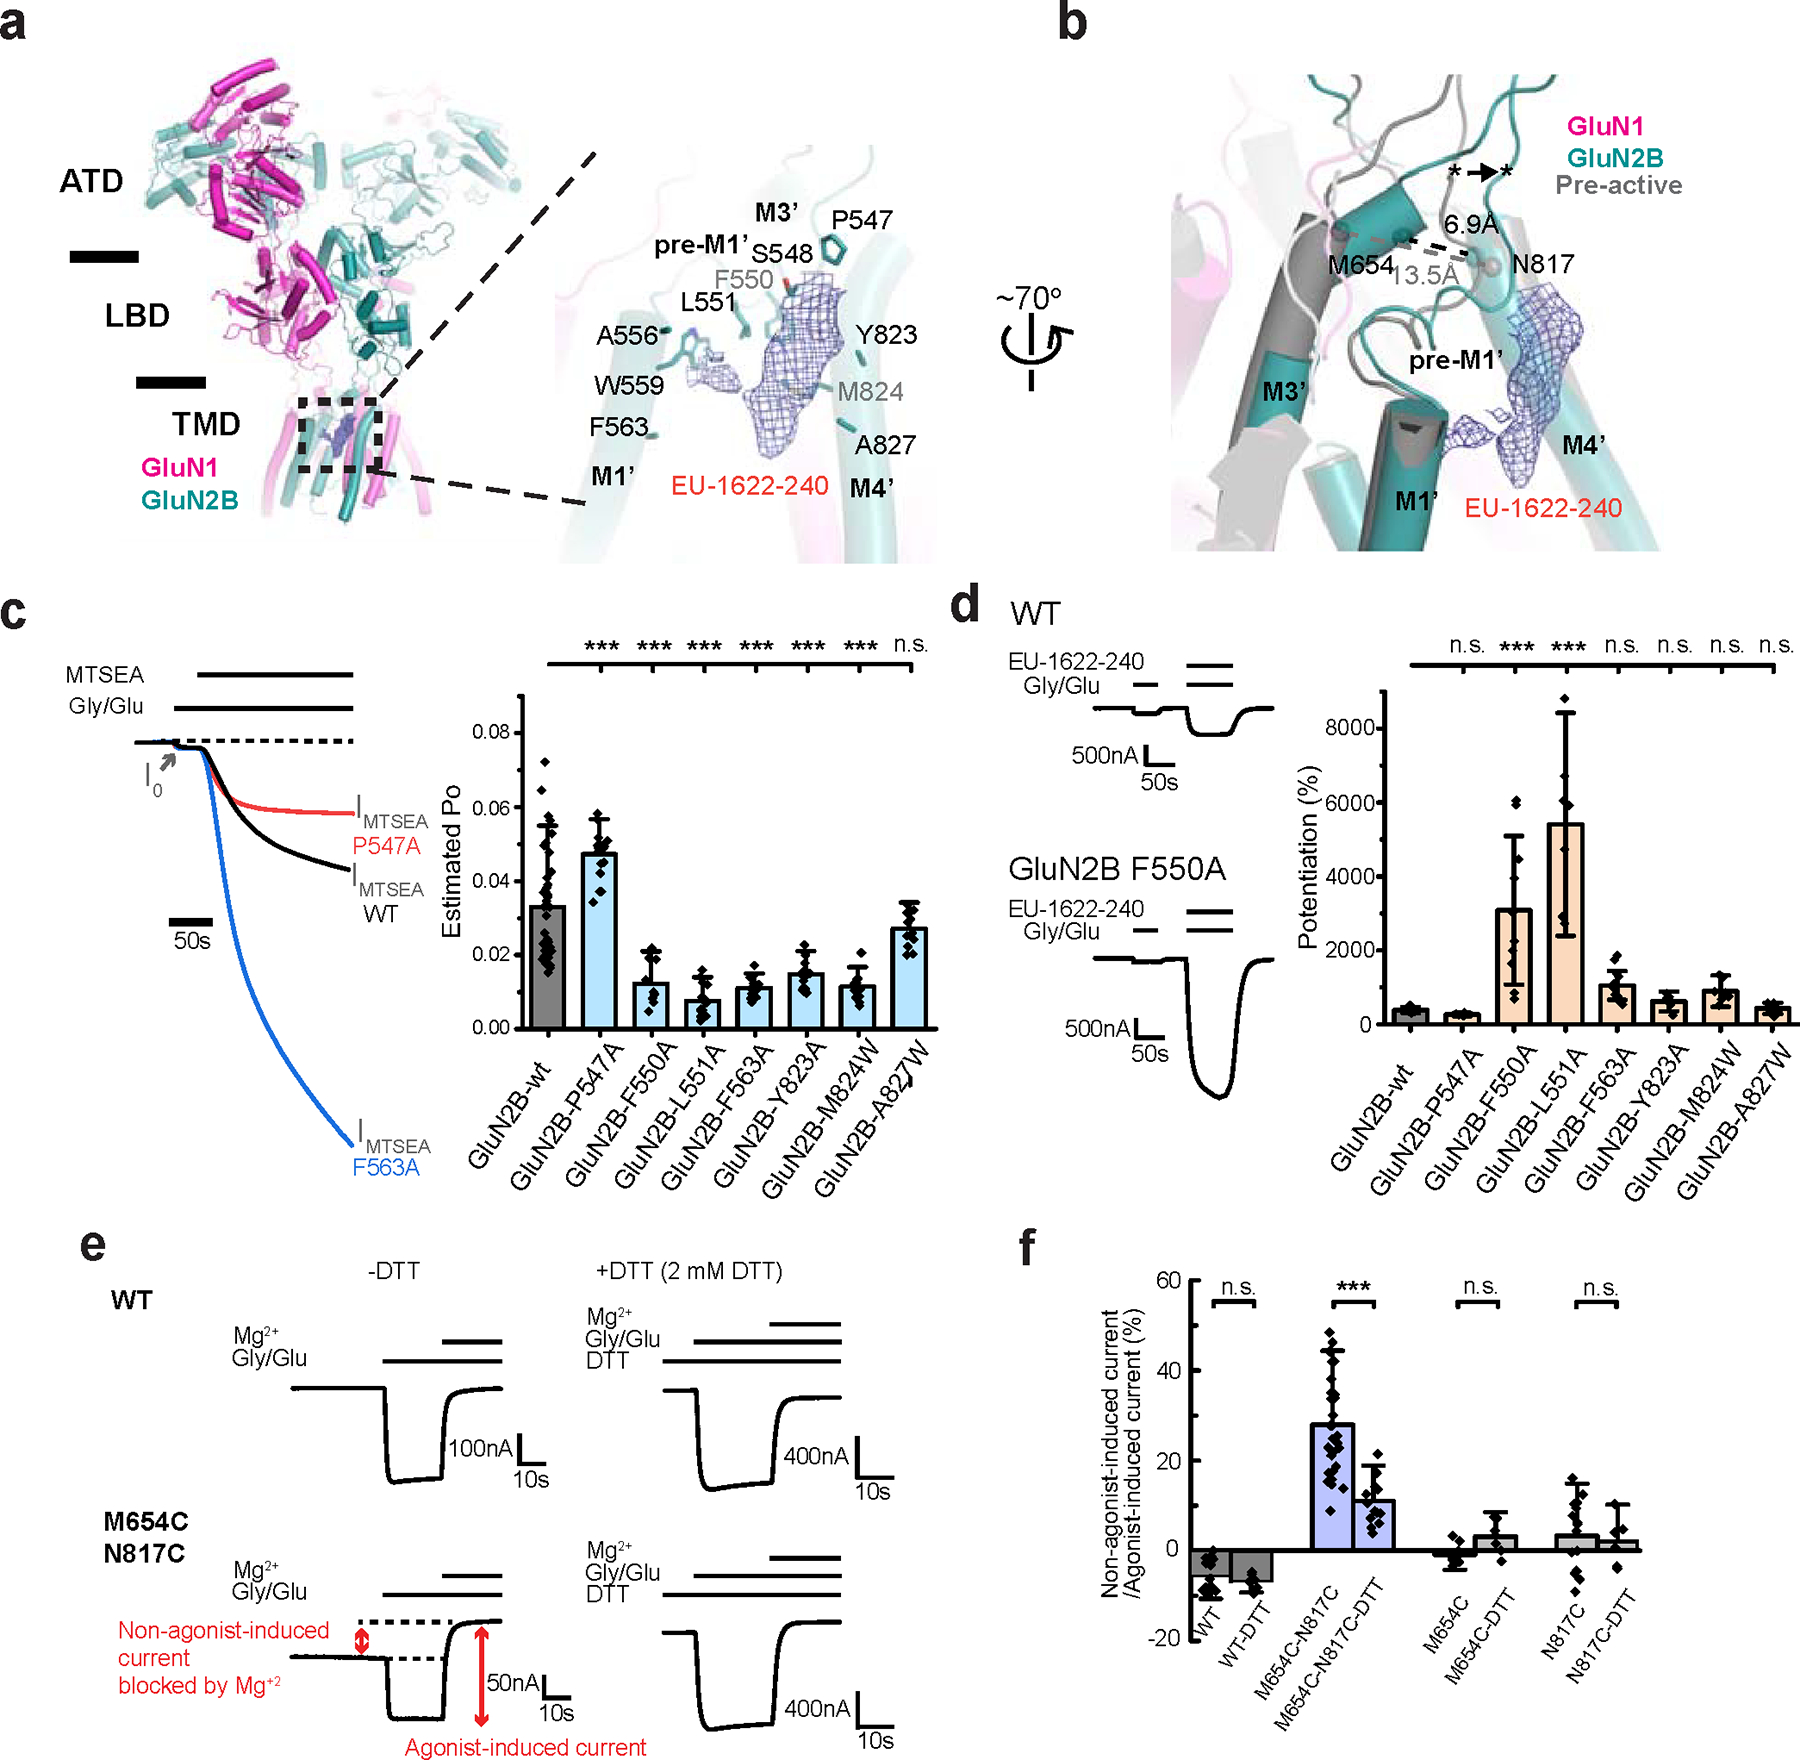
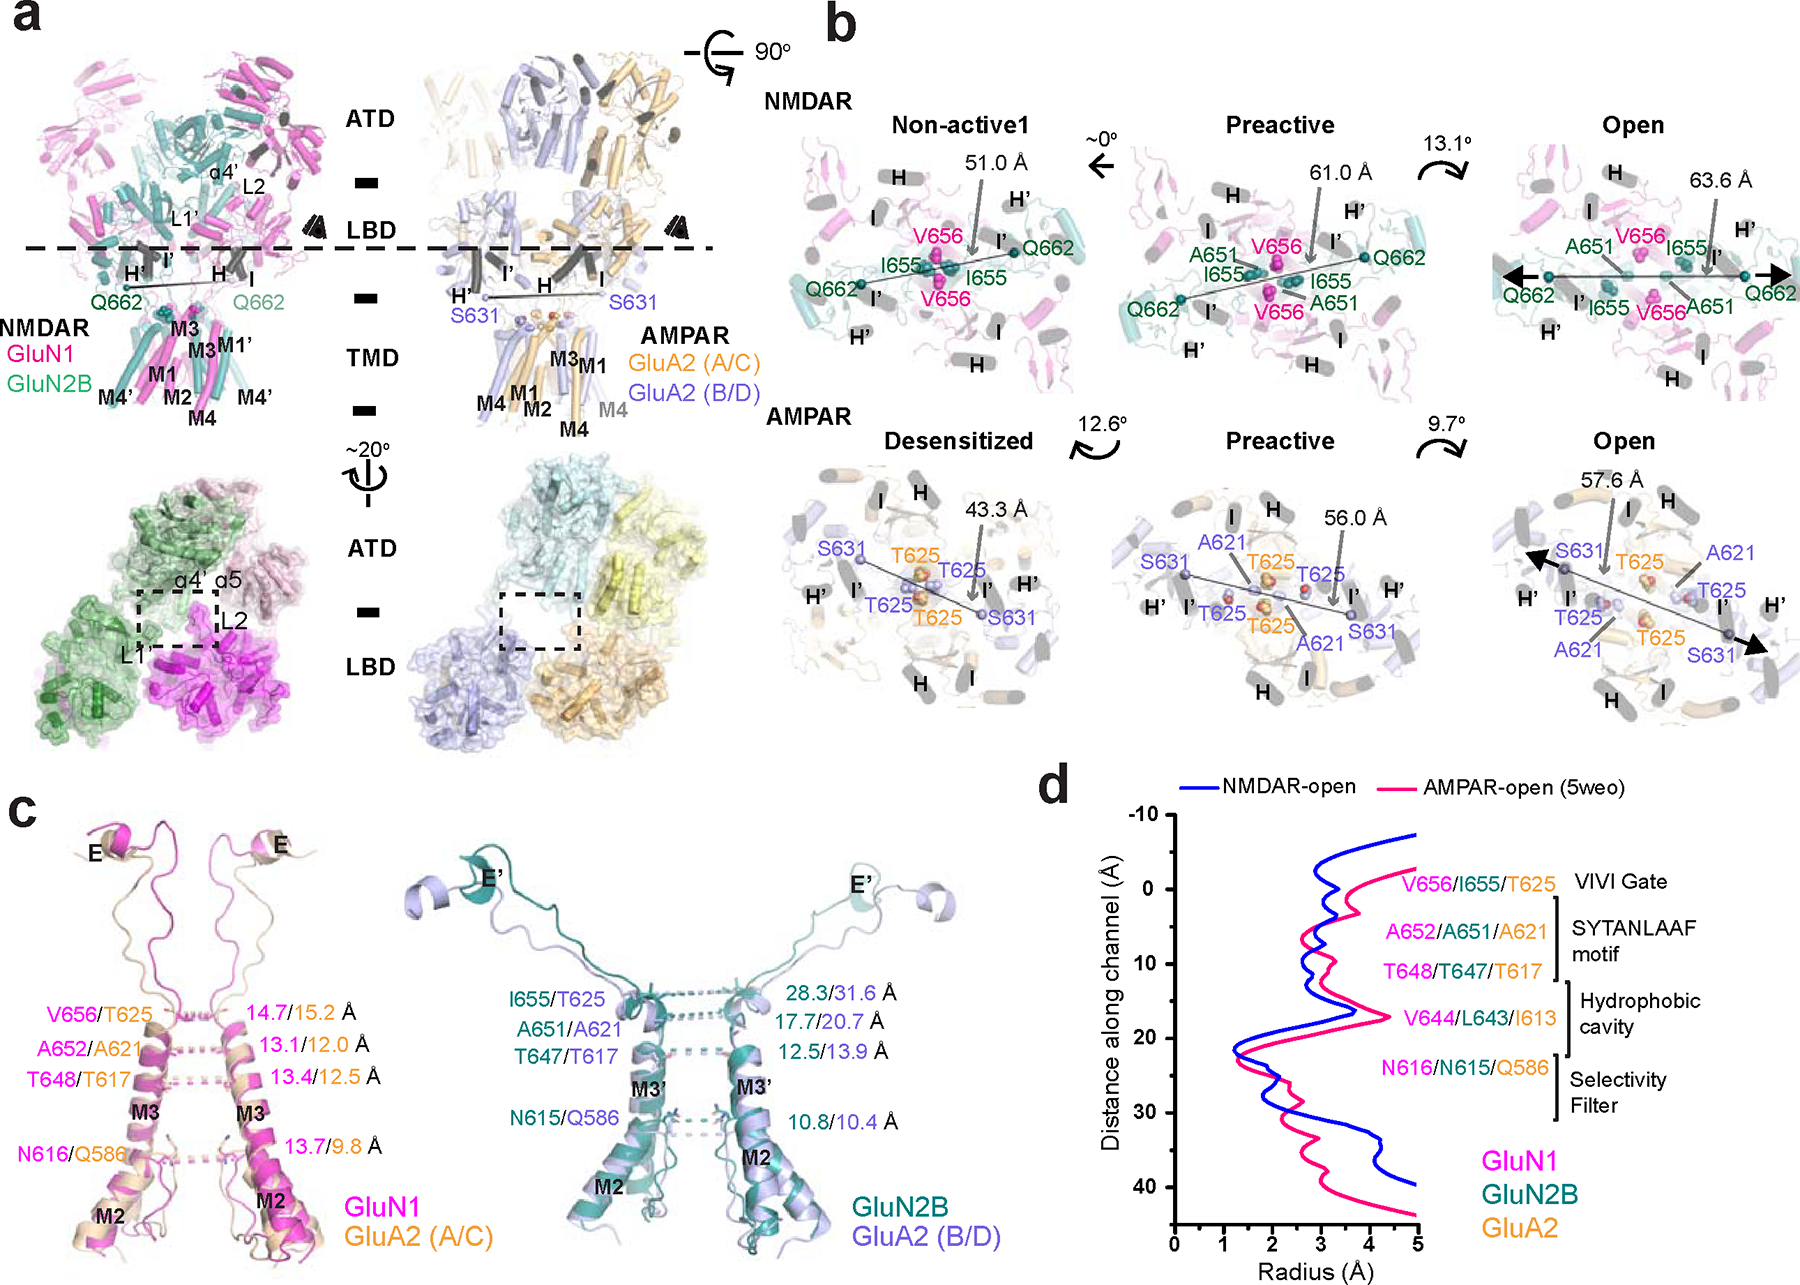
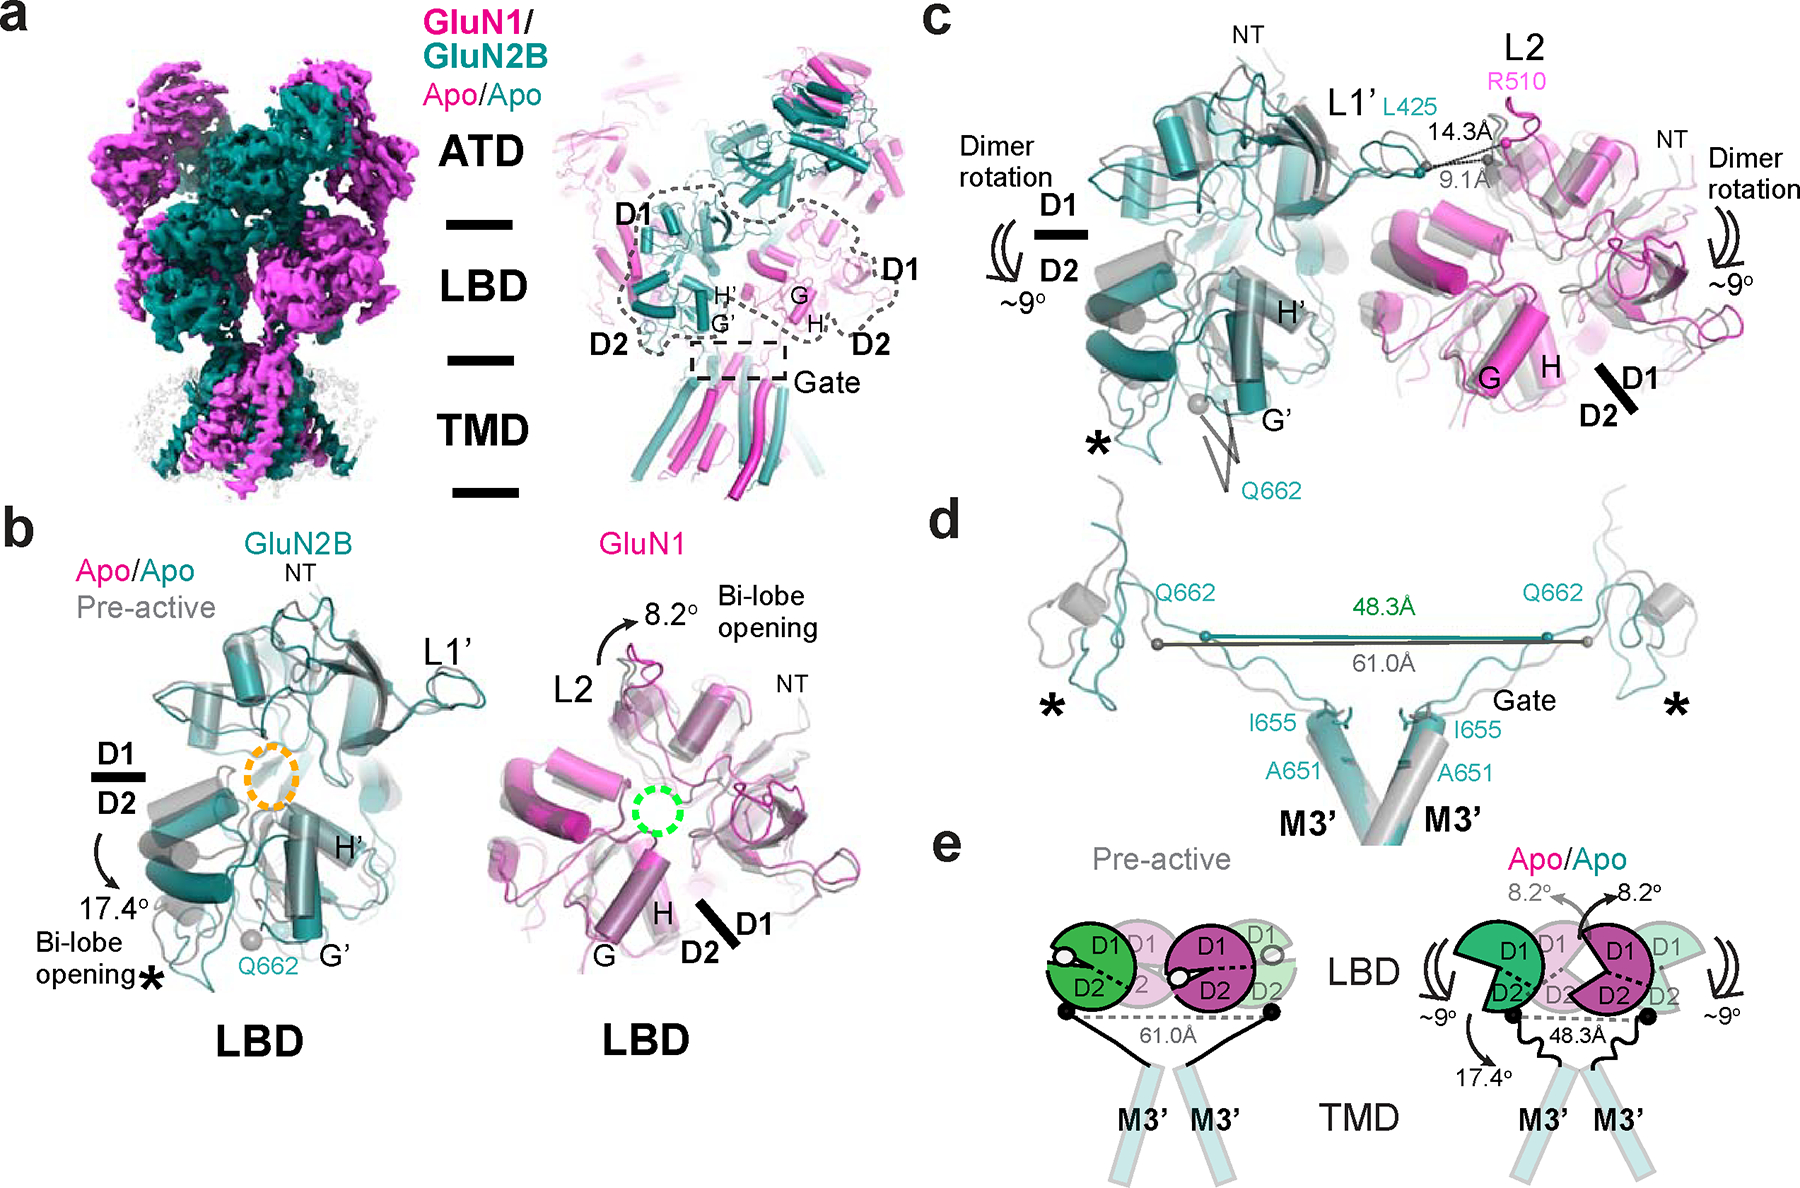
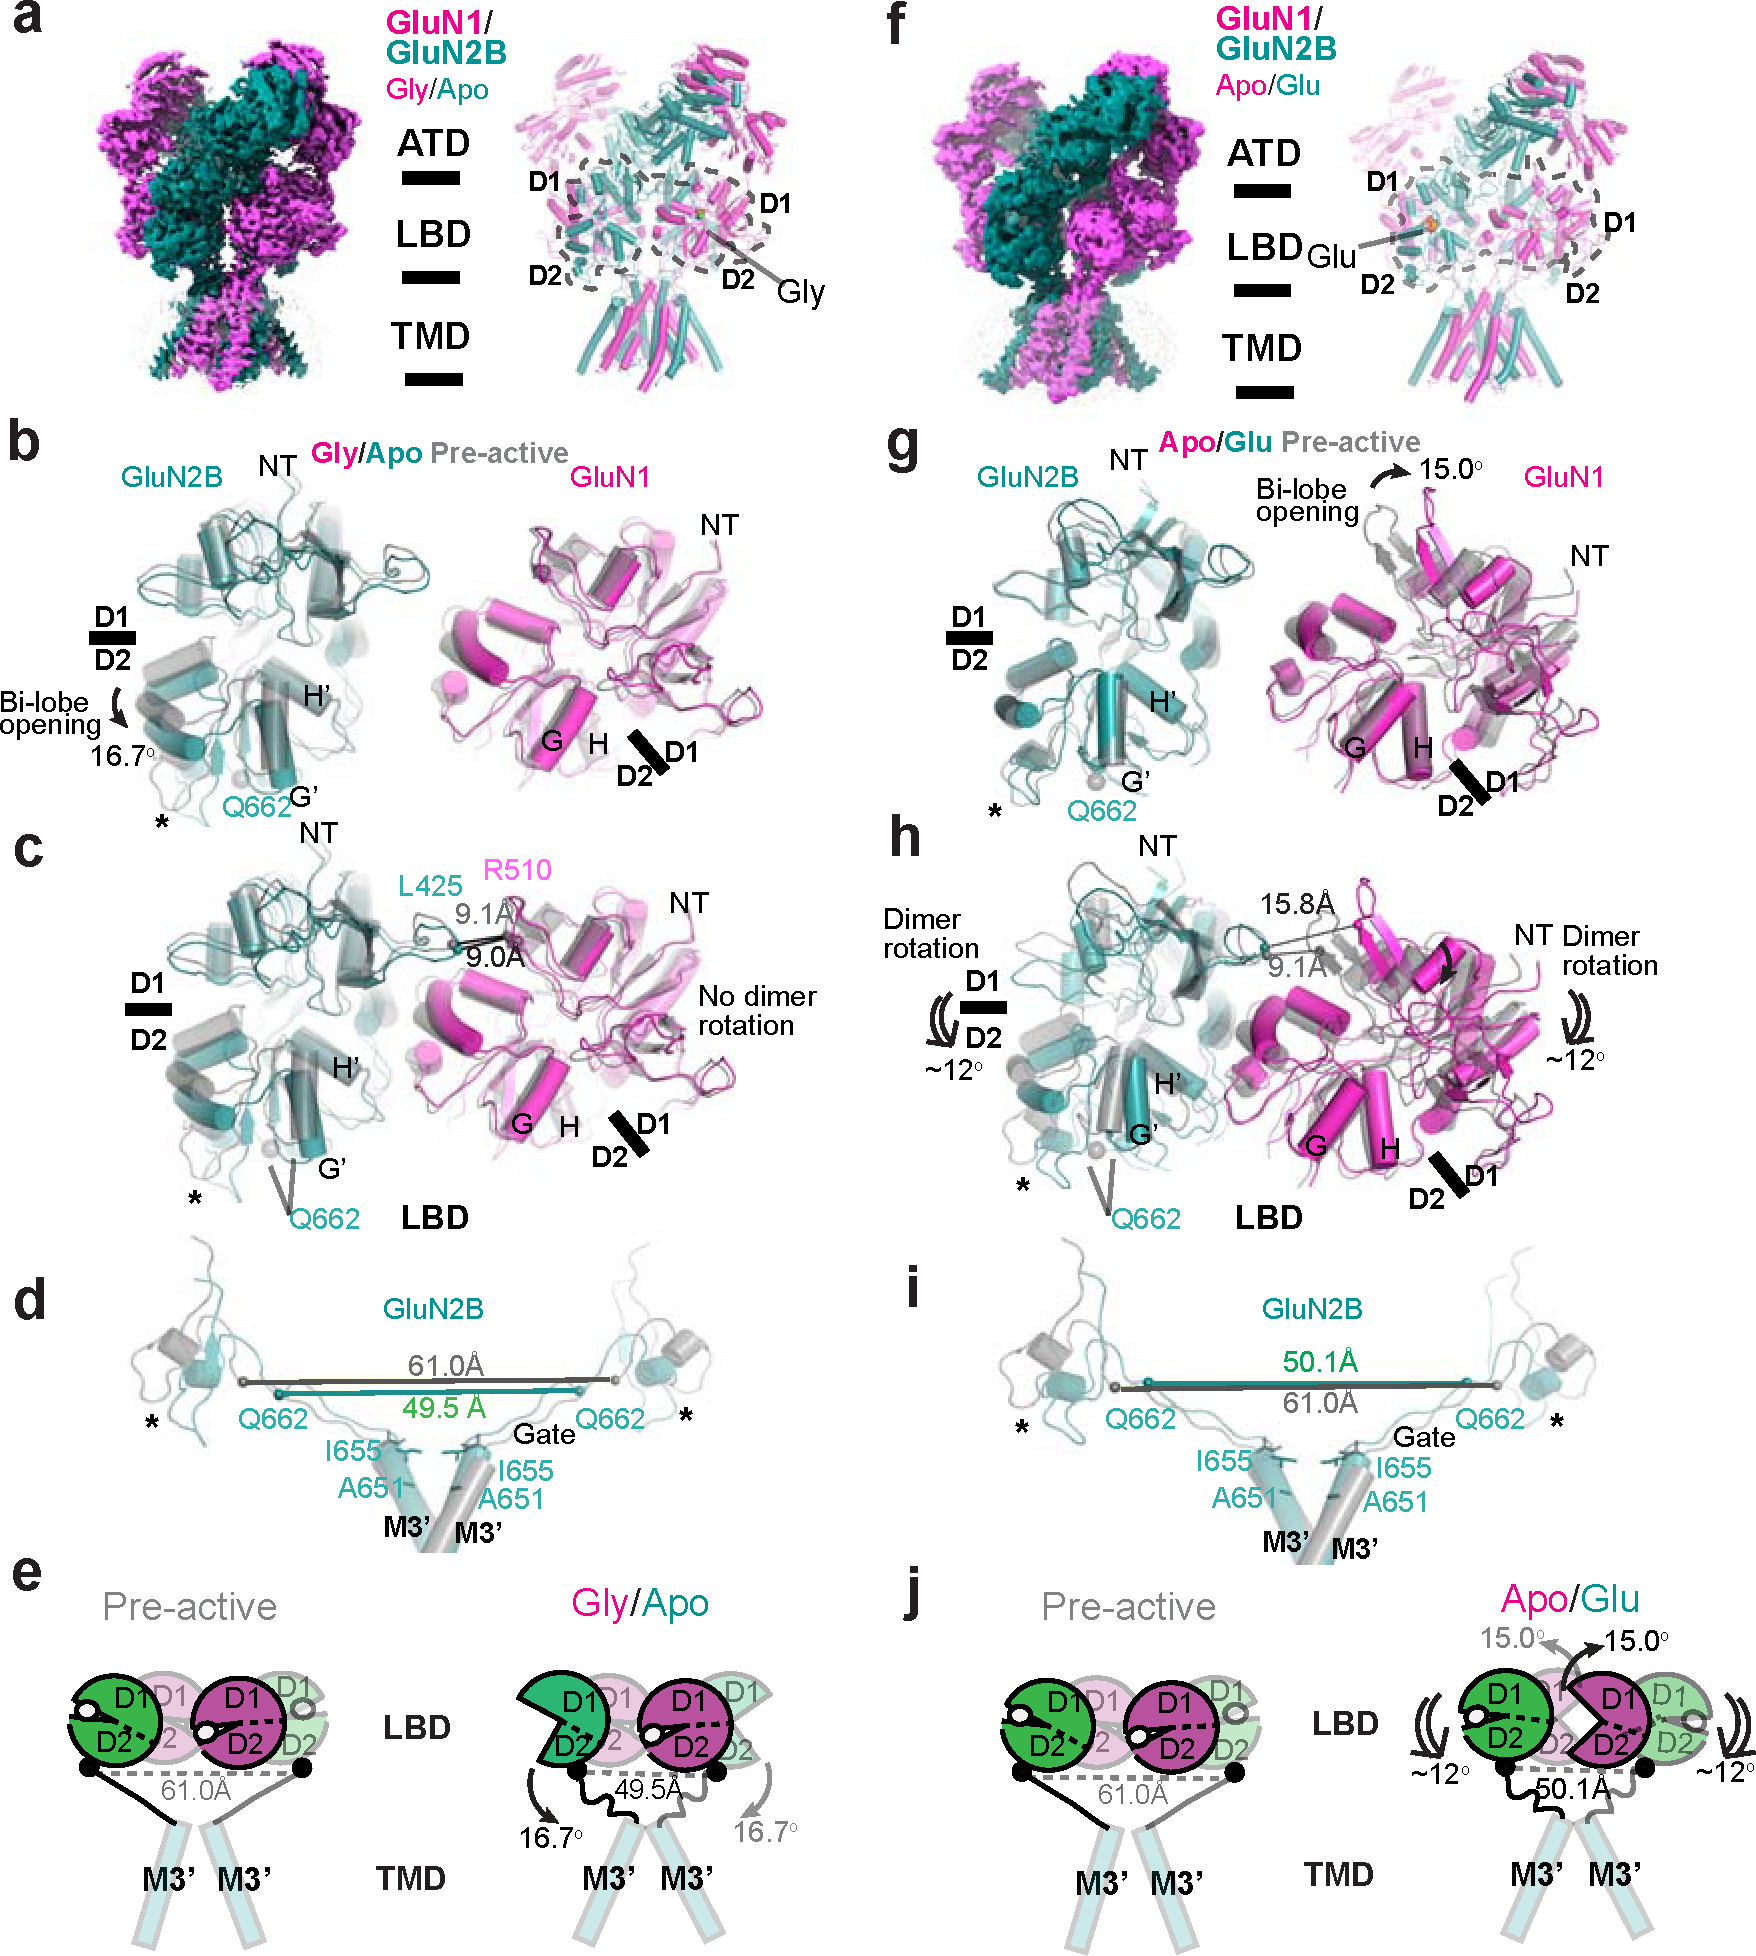
Glutamate transmission and activation of ionotropic glutamate receptors are the fundamental means by which neurons control their excitability and neuroplasticity1. The N-methyl-D-aspartate receptor (NMDAR) is unique among all ligand-gated channels, requiring two ligands-glutamate and glycine-for activation. These receptors function as heterotetrameric ion channels, with the channel opening dependent on the simultaneous binding of glycine and glutamate to the extracellular ligand-binding domains (LBDs) of the GluN1 and GluN2 subunits, respectively2,3. The exact molecular mechanism for channel gating by the two ligands has been unclear, particularly without structures representing the open channel and apo states. Here we show that the channel gate opening requires tension in the linker connecting the LBD and transmembrane domain (TMD) and rotation of the extracellular domain relative to the TMD. Using electron cryomicroscopy, we captured the structure of the GluN1-GluN2B (GluN1-2B) NMDAR in its open state bound to a positive allosteric modulator. This process rotates and bends the pore-forming helices in GluN1 and GluN2B, altering the symmetry of the TMD channel from pseudofourfold to twofold. Structures of GluN1-2B NMDAR in apo and single-liganded states showed that binding of either glycine or glutamate alone leads to distinct GluN1-2B dimer arrangements but insufficient tension in the LBD-TMD linker for channel opening. This mechanistic framework identifies a key determinant for channel gating and a potential pharmacological strategy for modulating NMDAR activity.


Conflict of interest statement

Conflict of Interest

SFT is a member of the medical advisory boards for the CureGRIN Foundation and the GRIN2B Foundation, is a member of the scientific advisory boards for Sage Therapeutics, Eumentis Therapeutics, and Neurocrine, is a Senior Advisor for GRIN Therapeutics, is co-founder of NeurOp, Inc and AgriThera, Inc., and is on the Board of Directors for NeurOp Inc. D.C.L. is on the Board of Directors for NeurOp Inc. Multiple authors are co-inventors on Emory-owned IP involving NMDA receptor modulators (RGF, NSA, SP, SFT, DCL). The remaining authors declare no competing interests.

Figures

Extended Data Figure 1.
Extended Data Figure 1.. Single-particle cryo-EM on glycine-, glutamate-, and EU-1622–240-bound rat GluN1–2B NMDAR.
a, A representative EM micrograph, 2D classes, and the 3D classification and refinement workflow. The scale bar on the micrograph equates to 49.5 nm. b, d, and g, Orientation distribution maps of the particles used in reconstructing the final map of the non-active1 (b), open C1 (d), and open C2 (g) structures. c, e, and f, Local resolution estimation calculated by ResMap for the non-active1 (c), open C1 (e), and open C2 (f) structures. h and k, Post-processing analysis of open (h) and non-active1 (k) state structures. The masked (blue) and unmasked (red) Fourier shell correlation (FSC) curves of two half maps (top), map vs. model (bottom). i and l, Representative zoom-in views of the cryo-EM density in conserved regions for both open (i) and non-active1 (l) states fitted with molecular models. A red arrowhead indicates the starting residue of the GluN2B M3’ helix bending in the open state structure. j, A zoom-in view of the cryo-EM density of the bound EU-1622–240 compound in the open state structure (red arrow).
Extended Data Figure 2.
Extended Data Figure 2.. Structural comparison of open state, pre-active, and non-active1 states.
a, Cartoon representation of GluN1–2B NMDARs in the open state. Dotted lines on the left panel enclose one GluN1–2B ATD dimer and two GluN1–2B LBD dimers, whereas the ones on the right panel enclose the GluN1–2B LBD heterodimer. The color codes are as in Figure 1. b-c, Comparison of the LBD dimer arrangements and the interfaces involving GluN2B ATD, GluN2B L1’, and GluN1 L2 (arrows) between the open and pre-active (gray) states (b) and the open and non-active1 (gray) states (c). The arrangements are similar between the open and pre-active states but show divergence between the open and non-active states, especially the positionings of the L1’ and L2 due to the dimer rotation (double-line arrows). d-e, Comparison of the GluN1–2B ATD dimers and GluN2B ATD bi-lobe structures between the open and pre-active (gray) states (d) and between the open and non-active1 states (e). Open and pre-active states exhibit similar conformations, whereas substantial changes are evident between the open and non-active1 states, as highlighted by the differences in the ɑ4’-ɑ5 distances (panel e, left). GluN2B ATD bi-lobe structure is ~13° more open in the open state than the non-active1 state (e, right).
Extended Data Figure 3.
Extended Data Figure 3.. PMF calculations.
a, All-atom Potential of Mean Force (PMF) calculations for the TMD channel highlight a more favorable free energy for Na+ ions around the VIVI gate and SYTANLAAF motif in the open state (blue), as opposed to the pre-active (green) and non-active1 (red) states, consistent with the gate opening and pore dilation in the open state structure. The placement of Cl is shown to be unfavorable, indicated by the positive free energy level (purple), consistent with the cation selectivity of the NMDAR channel. b, Block analysis of the PMF calculation. Each color represents an additional block where the PMF was rerun with two ns of additional data. The two final PMF blocks for all systems were within thermal energy, demonstrating convergence.
Extended Data Figure 4.
Extended Data Figure 4.. Single-particle analysis on rat GluN1–2B NMDAR in apo/apo state.
a, A representative EM micrograph, 2D classes, and the 3D classification and refinement workflow. The scale bar on the micrograph equates to 49.5 nm. b, An orientation distribution map of the particles used to reconstruct the final map. c, Local resolution estimation calculated by ResMap. d, Post-processing analysis. The masked (blue) and unmasked (red) Fourier shell correlation (FSC) curves of two half maps (top), map vs. model (bottom). e, Representative zoom-in views of the cryo-EM density in different conserved regions fitted with molecular models.
Extended Data Figure 5.
Extended Data Figure 5.. Single-particle analysis on rat GluN1–2B NMDAR in gly/apo state.
a, A representative EM micrograph, 2D classes, and the 3D classification and refinement workflow. The scale bar on the micrograph equates to 40.5 nm. b, An orientation distribution map of the particles used to reconstruct the final map. c, Local resolution estimation calculated by ResMap. d, Post-processing analysis. The masked (blue) and unmasked (red) Fourier shell correlation (FSC) curves of two half maps (top), map vs. model (bottom). e, Representative zoom-in views of the cryo-EM density in different conserved regions fitted with molecular models.
Extended Data Figure 6.
Extended Data Figure 6.. Single-particle analysis on rat GluN1–2B NMDAR in apo/glu state.
a, A representative EM micrograph, 2D classes, and the 3D classification and refinement workflow. The scale bar on the micrograph equates to 40.5 nm. b, An orientation distribution map of the particles used to reconstruct the final map. c, Local resolution estimation calculated by ResMap. d, Post-processing analysis. The masked (blue) and unmasked (red) Fourier shell correlation (FSC) curves of two half maps (top), map vs. model (bottom). e, Representative zoom-in views of the cryo-EM density in different conserved regions fitted with molecular models.
Extended Data Figure 7.
Extended Data Figure 7.. Structural comparisons between apo and pre-active states.
a, Cartoon representation of GluN1–2B NMDAR in the apo/apo state. The GluN1–2B ATD heterodimer and the channel gate are highlighted with dotted lines. b, A top-down view of the channel gate in the open, apo/apo, gly/apo, and apo/glu states. The gate residues are shown in spheres. c, Structural comparisons of GluN1–2B ATD heterodimers in different functional states. Distances between the GluN1 α5 and GluN2B α4’ in each state are shown for each functional state. d, Measurement of the central pore radii of the apo/apo, gly/apo, and apo/glu state structures.
Extended Data Figure 8.
Extended Data Figure 8.. Structural comparisons of GluN1–2B NMDAR in gly/apo and apo/glu states with apo/apo state.
a, Superposition of the gly/apo and apo/apo structures at GluN2B D2 (lower lobe) and GluN1 D1 (upper lobe) demonstrates no change in the bi-lobe orientation for GluN2B LBD and an 8.1° domain closure for GluN1 LBD (single-line arrow) in the gly/apo state. b, The GluN1 LBD bi-lobe closure is coupled to the 4° upward rotational movement of GluN1–2B LBD dimers relative to the membrane plane from the apo/apo to gly/apo (double-line arrows). c-d, These rotational movements are insufficient to create tension in the GluN2B LBD-M3’ linker for channel gating as measured by the distance between the GluN2B Gln662 residues. e, Superposition of the apo/glu and apo/apo structures at GluN2B D2 (lower lobe) and GluN1 D1 (upper lobe) displays 16.1° closure of the GluN2B LBD bi-lobe and 10.7° opening of the GluN1 LBD bi-lobe compared to the apo/apo state. f, These LBD-bi-lobe movements are coupled to an 8° downward rotational movement relative to the membrane plane compared to the apo/apo state (double-line arrows). g-h, The GluN2B LBD-M3’ linkers in the apo/glu state do not have sufficient tension for channel gating as in the gly/apo and apo/apo states. Asterisks indicate the location of the D2 loop.
Figure 1.
Figure 1.. Structural analysis of GluN1–2B NMDAR in open state.
a, The chemical structure of EU-1622–240 alongside a representative two-electrode voltage clamp (TEVC) recording of rat GluN1–2B NMDAR expressed in Xenopus oocytes. Recordings were performed in the presence of 30 μM glycine, 100 μM glutamate, and various concentrations of EU-1622–240 at a holding potential of −40 mV. The concentration-response curve, calculated from TEVC recordings, revealed a 5.3±0.57-fold increase in maximum NMDAR current with an EC50 of 0.75±0.1 μM (n=6, Hill coefficient nH=1.55±0.05). Data are presented as mean ± SEM. n= number of oocytes measured. b, Cryo-EM density and modeled structure of GluN1–2B NMDAR in the non-active1 state (left) and open state complexed with EU-1622–240. The GluN1 and GluN2B subunits are colored in magenta and deep teal, respectively, with glycine and glutamate and Gln662 Cɑs shown as spheres. c, Comparison of GluN2B TMD in non-active1, pre-active (PDB code: 6WI1), and open states. d, Top view of the channel pores across various states, highlighting the alterations in the opening of the M3/M3’ gates clustered with hydrophobic residues (GluN1 Ala652 and Val656 and GluN2B Ile655 and Ala651). A notable 13.1° rotation between the LBD and TMD in the open state compared to the pre-active state is critical for gate opening.
Figure 2.
Figure 2.. Pore analysis on the structures of GluN1–2B NMDARs in various functional states.
a-d, Pore radius measurement (a) and side views of the channel pores in open (b), pre-active (c), and non-active1 (d), as analyzed by the program, HOLE, which distinctively illustrate the gate widening and pore dilation specifically in the open state.
Figure 3.
Figure 3.. PAM site and channel gate determinants.
a, EU-1622–240 is exclusively bound to the open state as evident from the cryo-EM density (blue mesh) in a pocket formed by residues from GluN2B M1’, pre-M1’, and M4’. b, Comparison of the region around the PAM site between the open and pre-active states, where differences are shown by the Cα positions of Met654 on M3’ and Asn817 on M4’. The EU-1622–240 density is shown as blue mesh. c, Estimation of open probability (Po) by measurement of MTSEA potentiation in GluN1 Ala652Cys/GluN2B NMDARs. Representative TEVC traces (left) and the estimated Po for site-directed mutants based on MTSEA potentiation. (n from left to right = 41, 18, 10, 15, 19, 14, 22, and 12) d, Representative TEVC traces (left) and the changes in PAM activity ([EU-1622–240] = 3 μM) expressed as a percent of control for each mutant. The height of the bars represents the mean, and the whiskers represent ± 99% confidence interval (CI, n from left to right, 8, 6, 10, 7, 12, 7, 7, and 8). e-f, Disulfide crosslinking between Met654Cys and Asn817Cys locks a subset of receptors in the open state without agonists, which could be blocked by Mg2+ (red arrow). This current observed in the absence of agonists is diminished in the presence of DTT. WT or single-point mutants do not display this current (n in panel f from left to right = 16, 7, 30, 14, 10, 7, 16, and 6). For panels c and f, error bars represent mean ± SD. One-way ANOVA with post-hoc Dunnett’s (c, d) or Tukey’s test (f) was employed to determine the significant differences between the two experimental datasets. The asterisks denote p < 0.001 (***). n.s. denotes “not significant statistically”. TEVC recordings were conducted at a holding voltage of −60 mV. n = number of recordings from individual oocytes.
Figure 4.
Figure 4.. Comparison between NMDAR and AMPAR open states.
a, Side view of the open state GluN1–2B NMDAR and GluA2 AMPAR (PDB code: 5WEO) structures. The linker residues, GluN2B Gln662 and GluA2 Ser631 are shown as spheres. The ATD-LBD interaction modes are distinct between NMDAR and AMPAR, especially around the dimer of dimers interface, which involves the cluster of GluN1 L2, GluN2B L1’ and GluN2B ɑ4’ from the ATD. b, The NMDAR and AMPAR channel gates in different functional states are viewed from the LBD layer (‘eyes’ in panel a). The helices H and I are marked in black as references in both panel a and b. Gate residues are shown in spheres. The Cɑs of GluN2B Gln662 and GluA2 Ser631 in the LBD-M3 loop are connected with dotted lines to show the degree and direction of tensions necessary for channel gating. The angles between these connecting lines are shown with curved arrows between functional states. c, Structural comparisons of the pore-forming helices (M2 and M3) between the NMDAR and AMPAR open states. The distances between the Cαs of pore-forming residue pairs in the GluN1 and GluA2 A/C chains (left panel) and those in the GluN2B and GluA2 B/D chains (right panel) are shown. d, Radius measurements along the channel pores of the open NMDAR and open AMPAR structures.
Figure 5.
Figure 5.. Structural analysis of GluN1–2B NMDAR in apo/apo-state.
a, Cryo-EM density and modeled structure of GluN1–2B NMDAR in the apo/apo state. b, Comparison of LBDs in the apo/apo and pre-active (gray) states. Superposition of the apo/apo and pre-active structures at GluN2B D1 (upper lobe) and GluN1 D2 (lower lobe) demonstrates 17.4° and 8.2° domain openings, respectively, in the apo/apo state. Glutamate and glycine binding pockets are indicated by orange and cyan dotted ovals, respectively. c, In the apo/apo state, the GluN1–2B LBD dimers undergoes ~9° downward rotation toward the membrane plane compared to the pre-active state, which results in an increased distance between GluN2B L1’ and GluN1 L2 (represented by the distance between GluN1 Leu425 and Arg510). d-e, The tension in the GluN2B LBD-M3’ linkers is reduced in the apo/apo state compared to the pre-active state, which favors the closure of the channel gate. Asterisks in panels b-d indicate the location of the D2 loop in GluN2B.
Figure 6.
Figure 6.. Structural analysis of GluN1–2B NMDAR in gly/apo and apo/glu states reveals distinct mechanisms for favoring channel closure.
a, Cryo-EM density and a structural model of the gly/apo state. b, Superposition of the gly/apo and pre-active structures at GluN2B D1 (upper lobe) and GluN1 D2 (lower lobe) demonstrates 16.7° opening of the GluN2B LBD bi-lobe and no change in the GluN1 LBD in the gly/apo state. c, There is no rotational movement in the GluN1–2B LBD dimers in this state relative to the pre-active state. d-e, The tension in the GluN2B LBD-M3’ linkers is reduced in the gly/apo state compared to the pre-active state as a result of the GluN2B LBD bi-lobe opening. f, Cryo-EM density and a structural model of the apo/glu state. g, Superposition of the apo/glu and pre-active structures at GluN2B D1 and GluN1 D2 demonstrates ~0° and ~15° domain openings, respectively, in the apo/glu state. h, In the apo/glu state, the GluN1–2B LBD dimers undergoes ~12° downward rotation compared to the pre-active state, which results in an increased distance between GluN2B L1’ and GluN1 L2. i-j, The tension in the GluN2B LBD-M3’ linker is reduced in the apo/glu state compared to the pre-active state as a result of the dimer rotation toward the membrane plane. Asterisks in panels b-d and g-i indicate the location of the D2 loop in GluN2B.

References

    1. Hansen KB et al. Structure, Function, and Pharmacology of Glutamate Receptor Ion Channels. Pharmacol Rev 73, 298–487, doi: 10.1124/pharmrev.120.000131 (2021). - DOI - PMC - PubMed
    1. Mony L & Paoletti P Mechanisms of NMDA receptor regulation. Curr Opin Neurobiol 83, 102815, doi: 10.1016/j.conb.2023.102815 (2023). - DOI - PubMed
    1. Zhou C & Tajima N Structural insights into NMDA receptor pharmacology. Biochem Soc Trans 51, 1713–1731, doi: 10.1042/BST20230122 (2023). - DOI - PMC - PubMed
    1. Mayer ML, Westbrook GL & Guthrie PB Voltage-dependent block by Mg2+ of NMDA responses in spinal cord neurones. Nature 309, 261–263 (1984). - PubMed
    1. Nowak L, Bregestovski P, Ascher P, Herbet A & Prochiantz A Magnesium gates glutamate-activated channels in mouse central neurones. Nature 307, 462–465, doi: 10.1038/307462a0 (1984). - DOI - PubMed

Method References

    1. Hanson JE et al. Therapeutic potential of N-methyl-D-aspartate receptor modulators in psychiatry. Neuropsychopharmacology 49, 51–66, doi: 10.1038/s41386-023-01614-3 (2024). - DOI - PMC - PubMed
    1. Furukawa H, Simorowski N & Michalski K Effective production of oligomeric membrane proteins by EarlyBac-insect cell system. Methods Enzymol 653, 3–19, doi: 10.1016/bs.mie.2020.12.019 (2021). - DOI - PMC - PubMed
    1. Regan MC et al. Structural Mechanism of Functional Modulation by Gene Splicing in NMDA Receptors. Neuron 98, 521–529 e523, doi: 10.1016/j.neuron.2018.03.034 (2018). - DOI - PMC - PubMed
    1. Punjani A, Rubinstein JL, Fleet DJ & Brubaker MA cryoSPARC: algorithms for rapid unsupervised cryo-EM structure determination. Nature methods 14, 290–296, doi: 10.1038/nmeth.4169 (2017). - DOI - PubMed
    1. Pettersen EF et al. UCSF Chimera - A visualization system for exploratory research and analysis. Journal of Computational Chemistry 25, 1605–1612, doi: 10.1002/jcc.20084 (2004). - DOI - PubMed

LinkOut - more resources