. 2024 Aug;632(8024):451-459.
doi: 10.1038/s41586-024-07743-z. Epub 2024 Jul 31.

Propofol rescues voltage-dependent gating of HCN1 channel epilepsy mutants

Affiliations

Propofol rescues voltage-dependent gating of HCN1 channel epilepsy mutants

Elizabeth D Kim et al. Nature. 2024 Aug.

Abstract

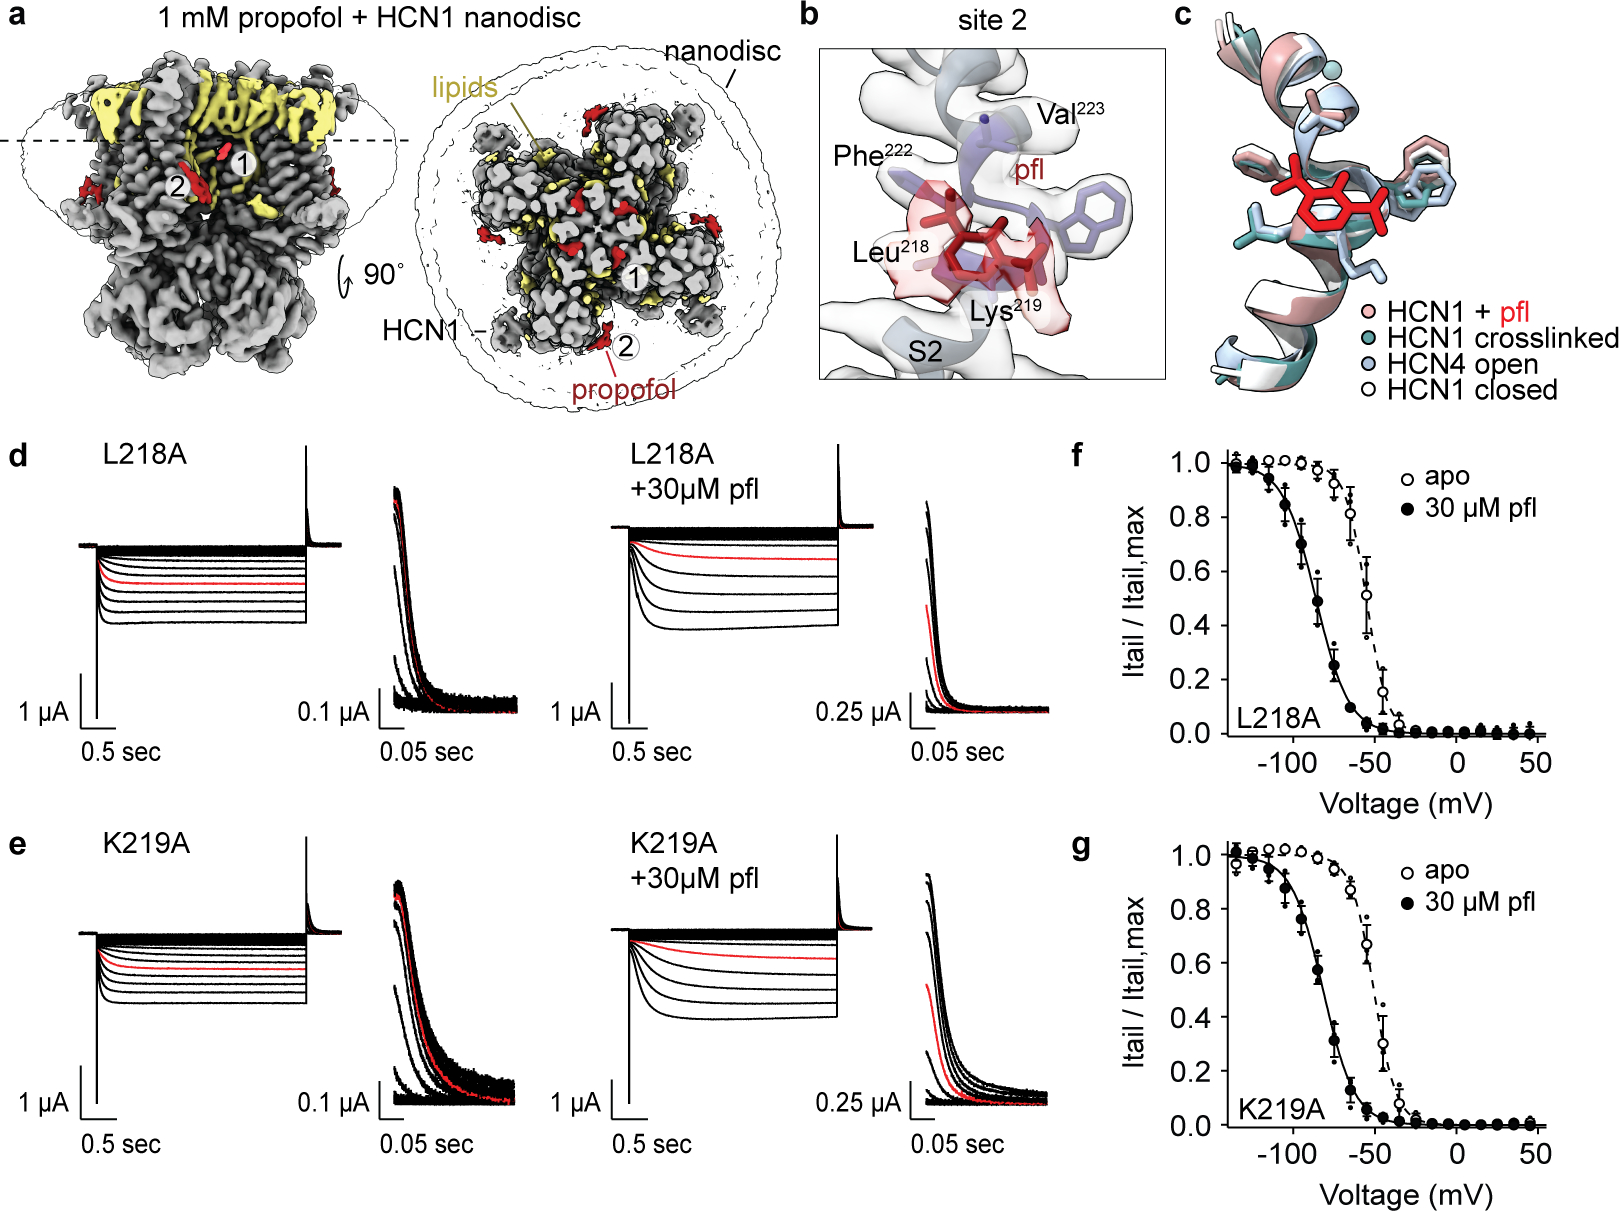
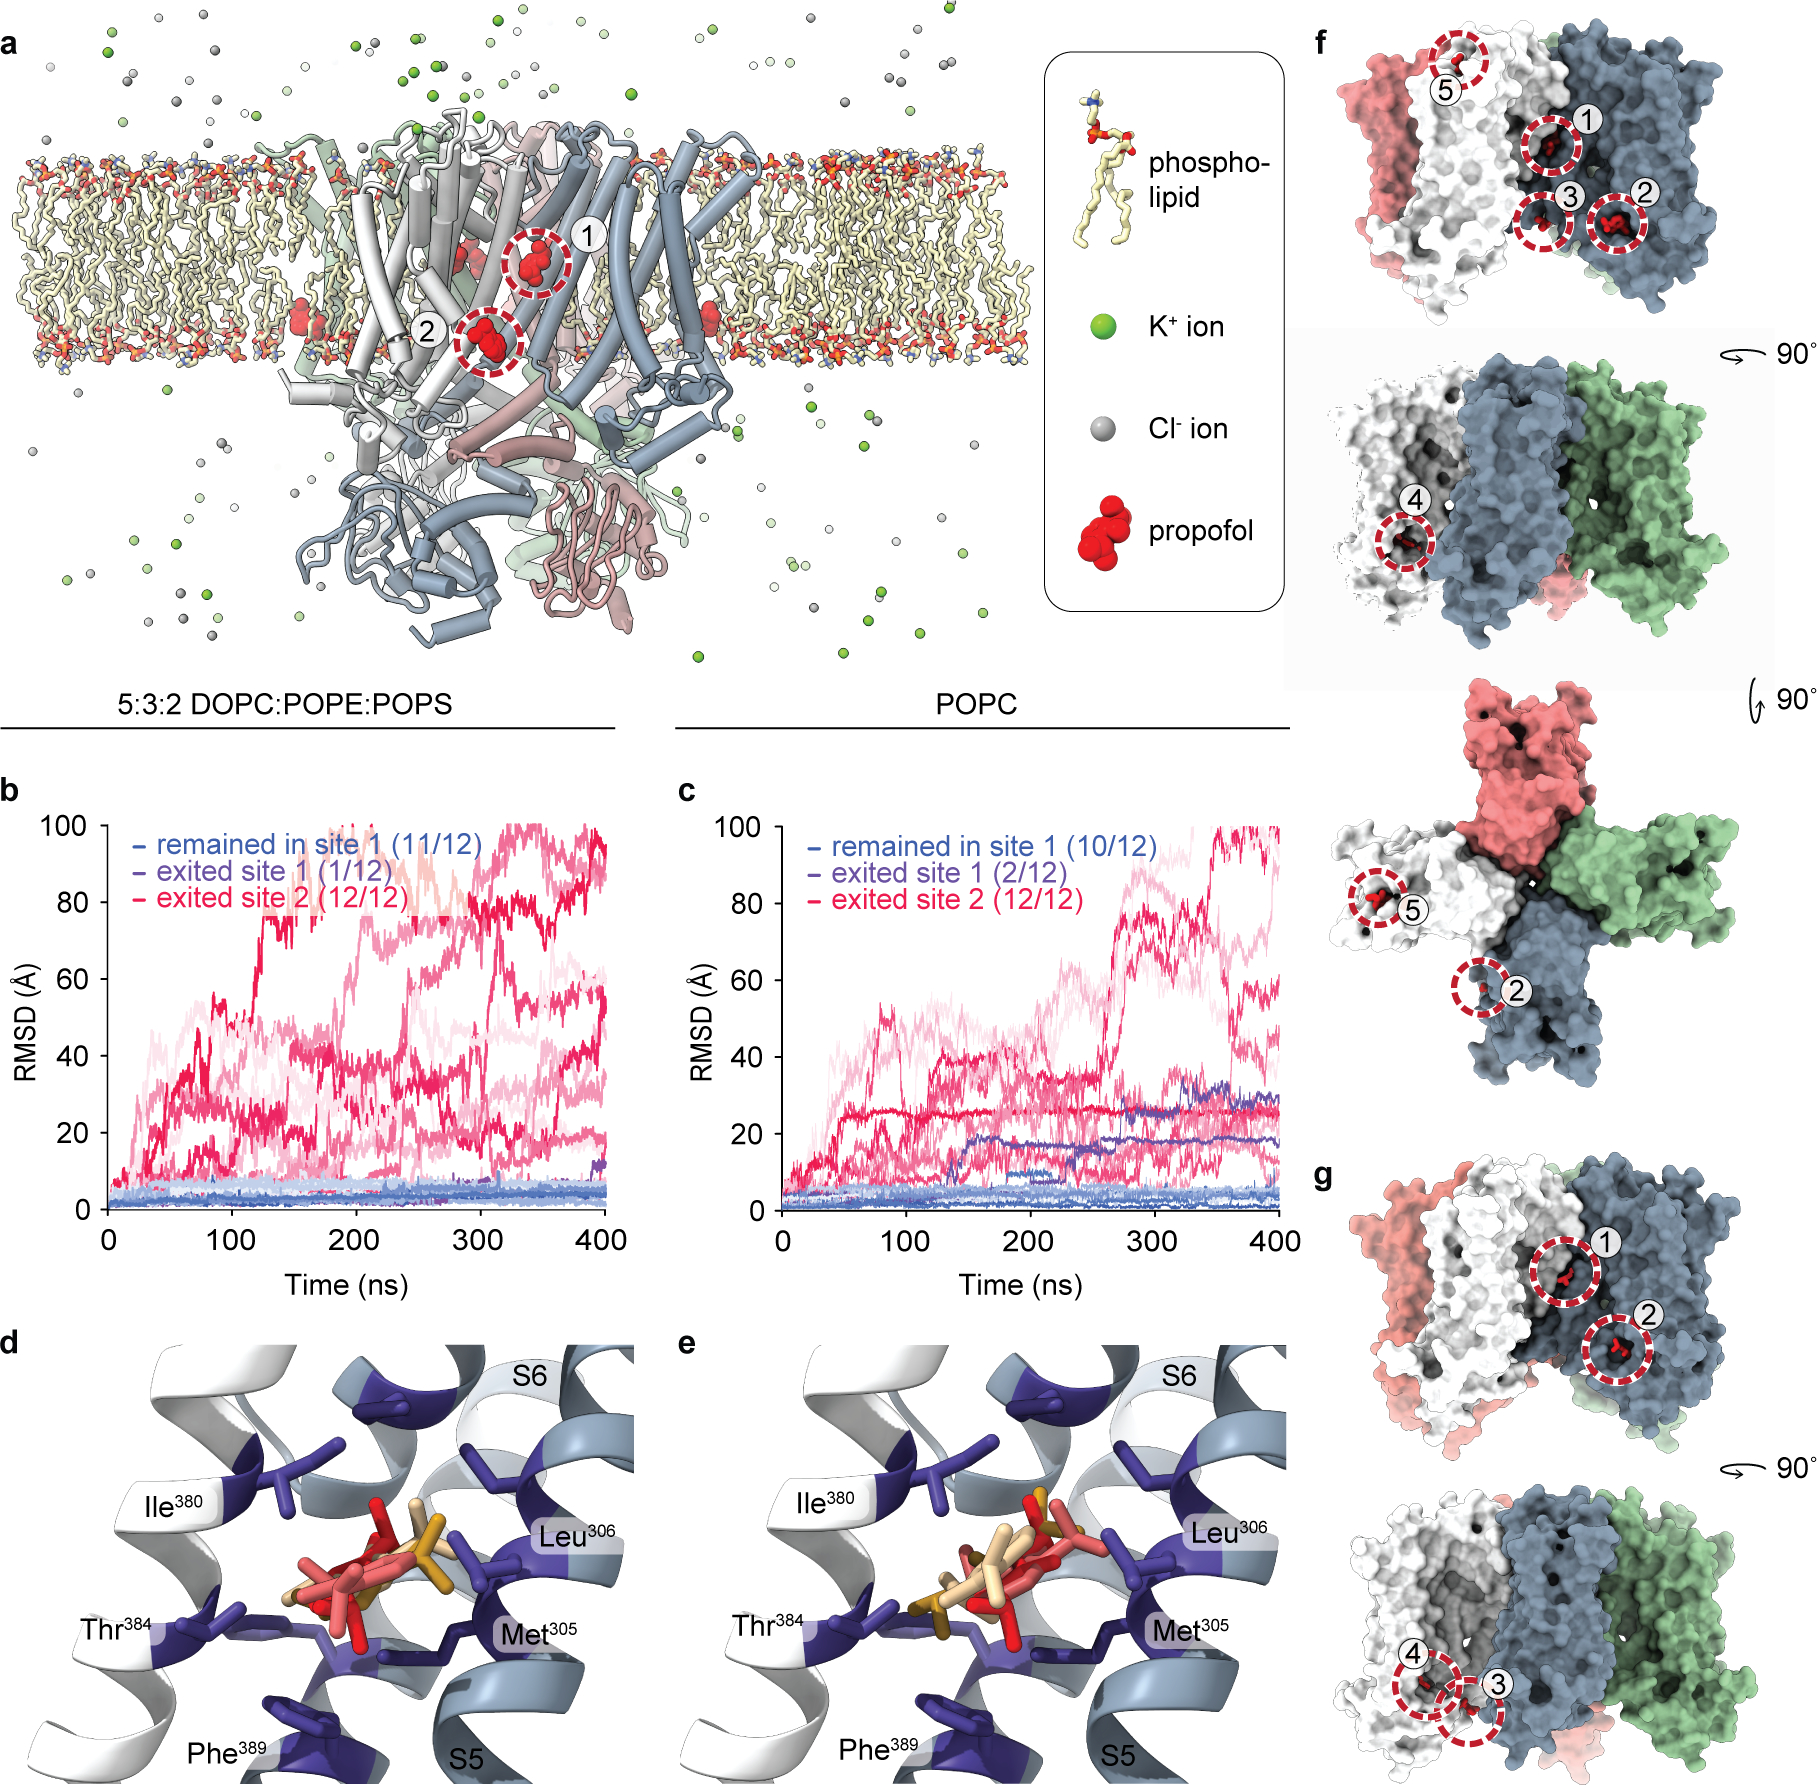
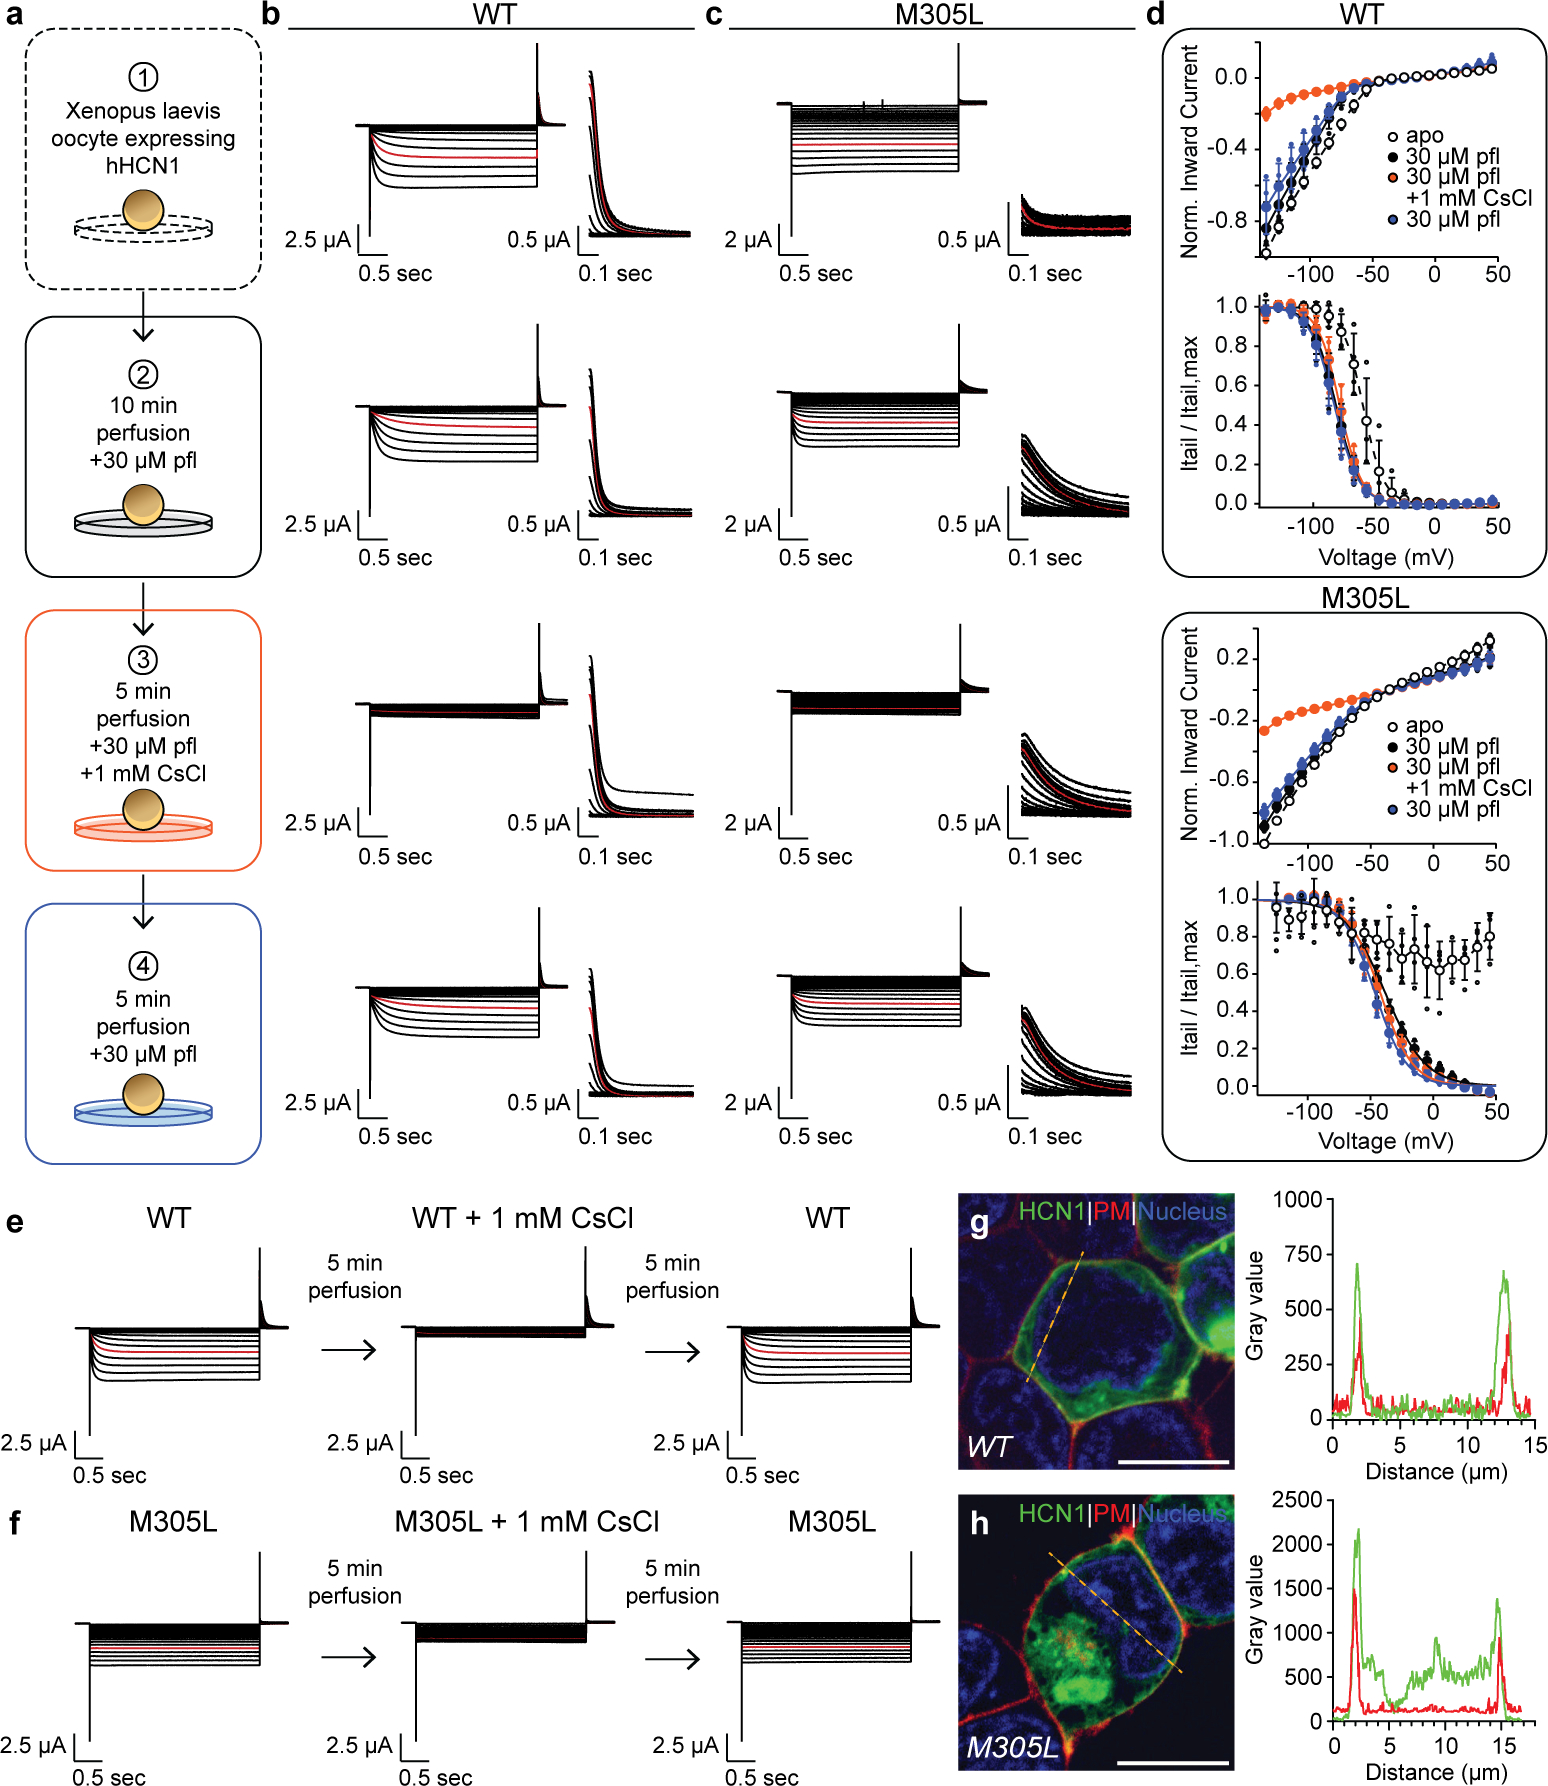
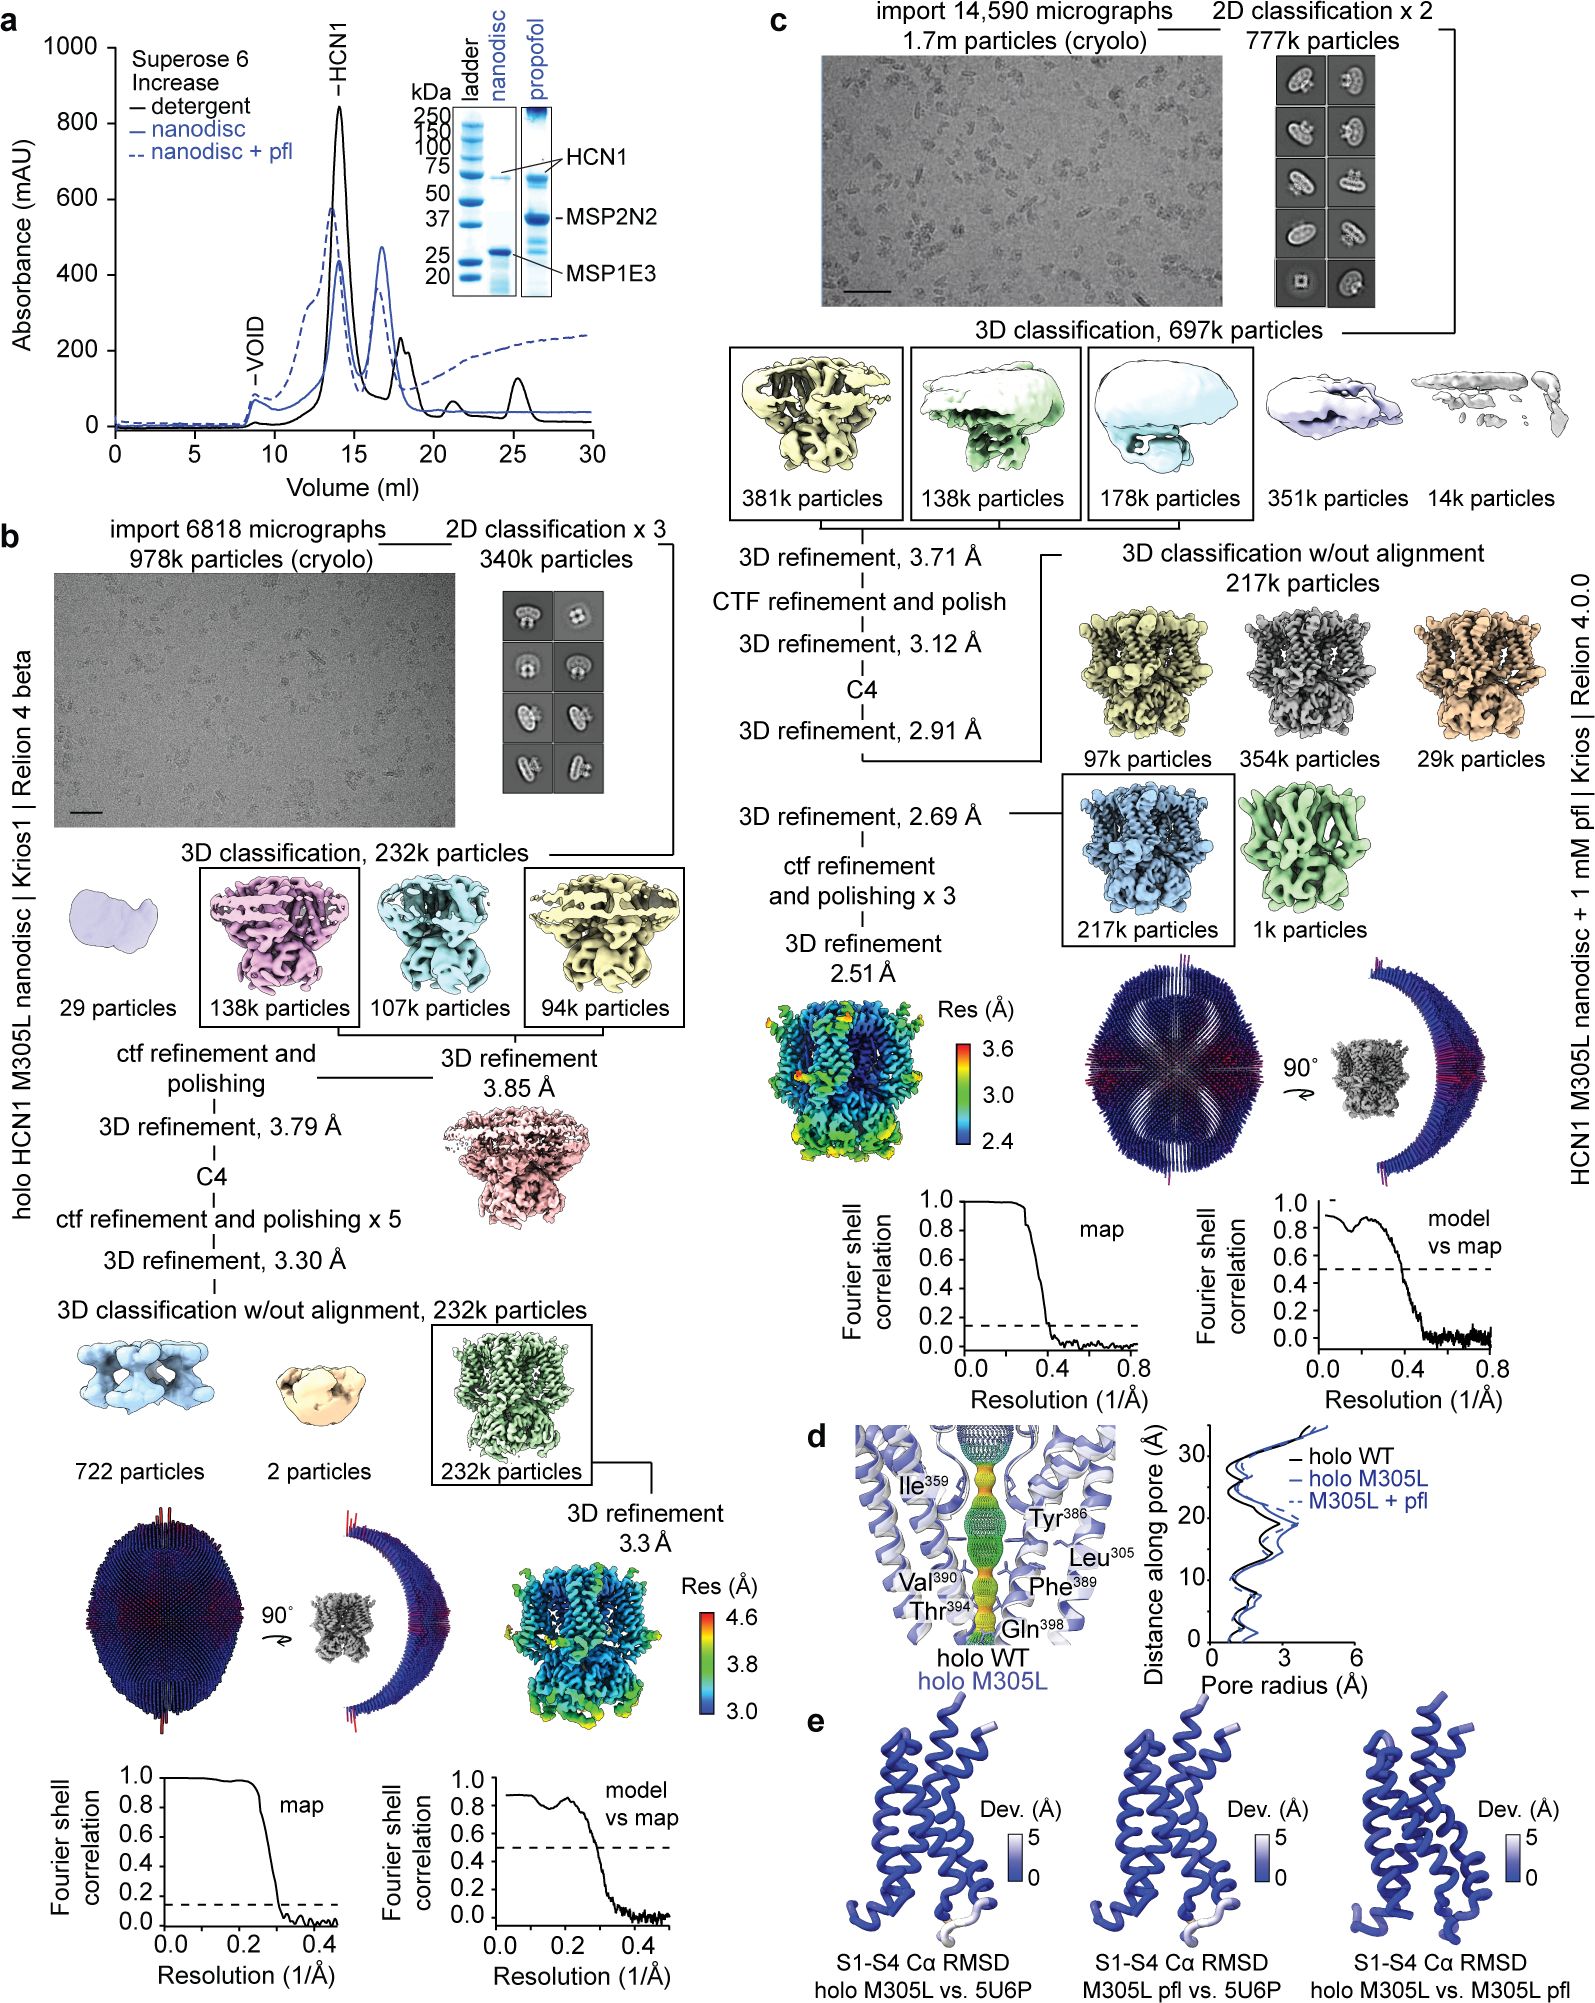
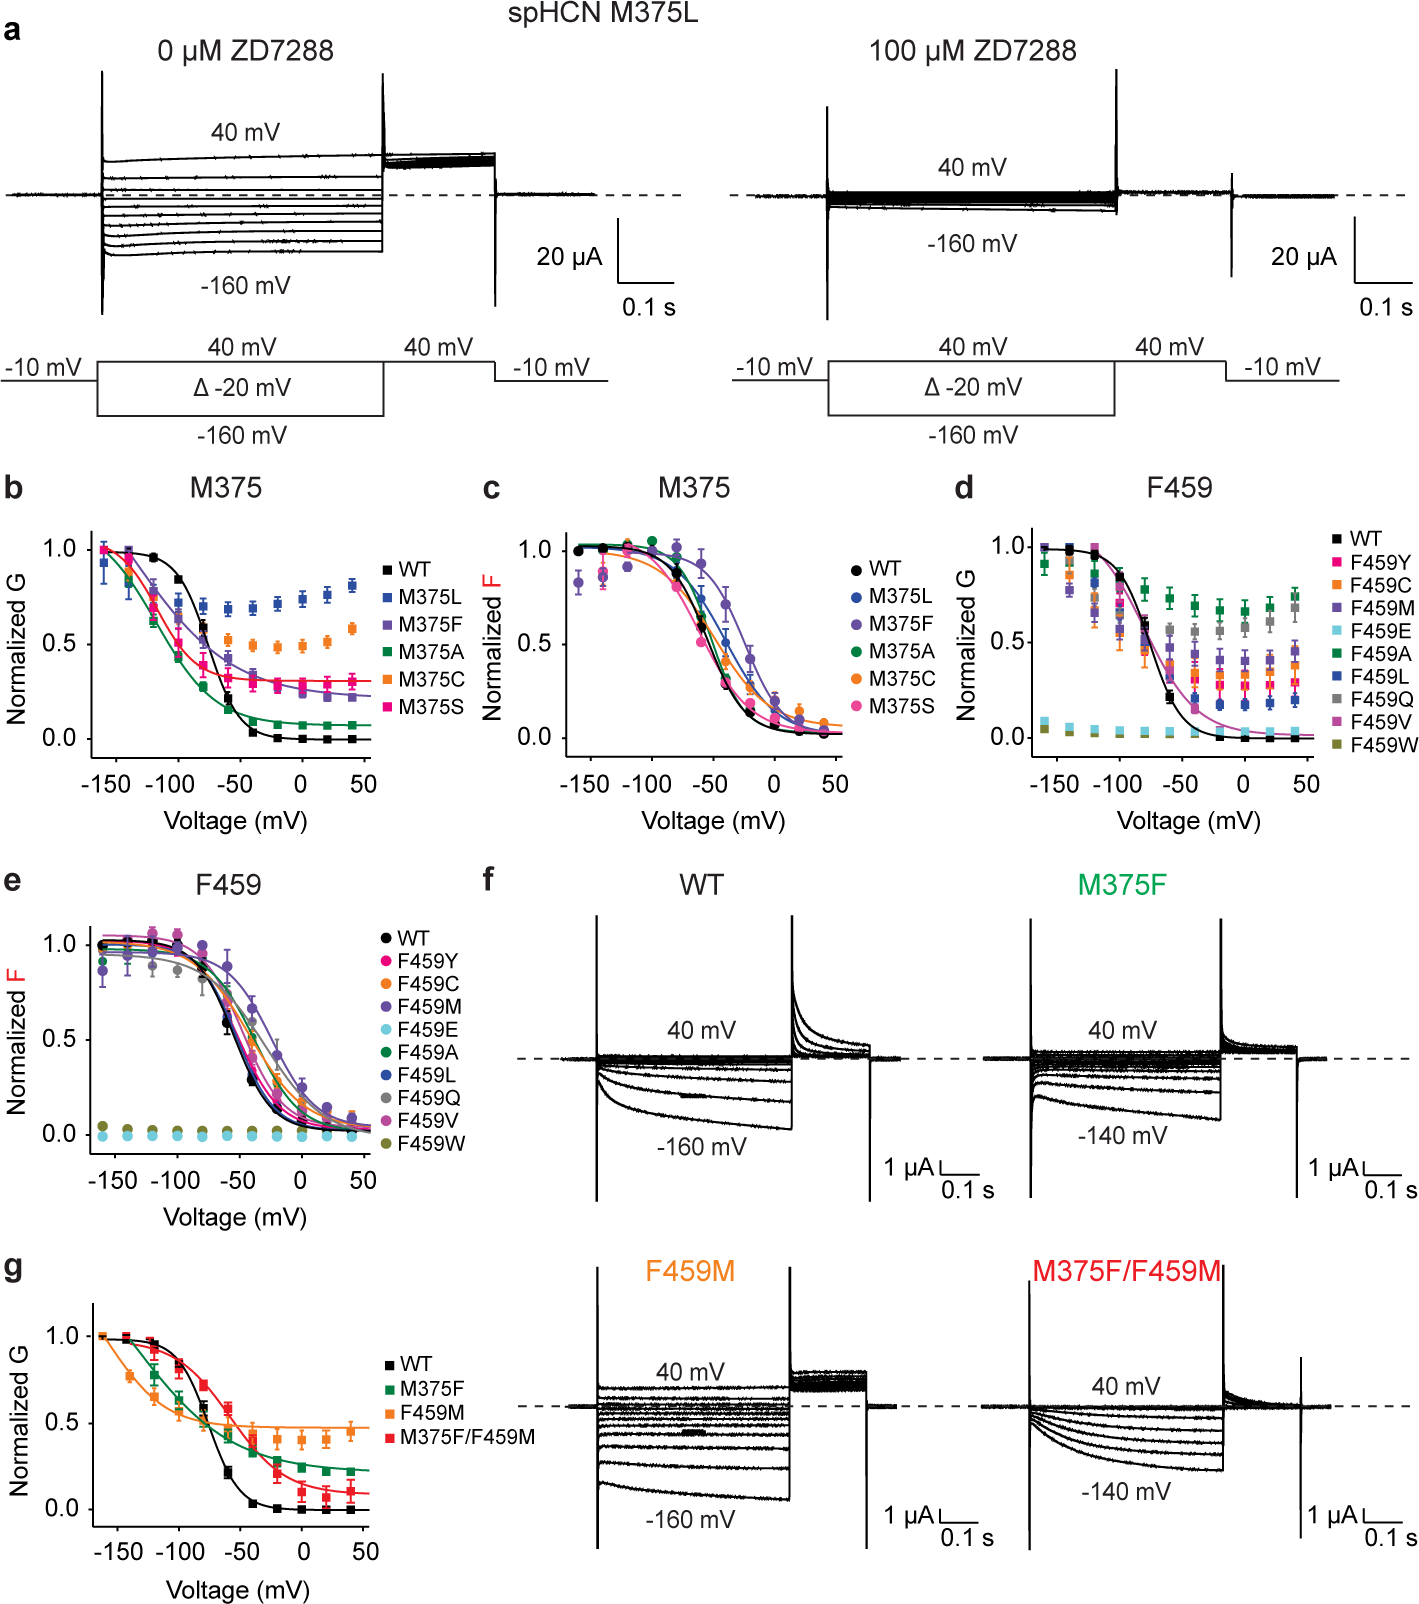
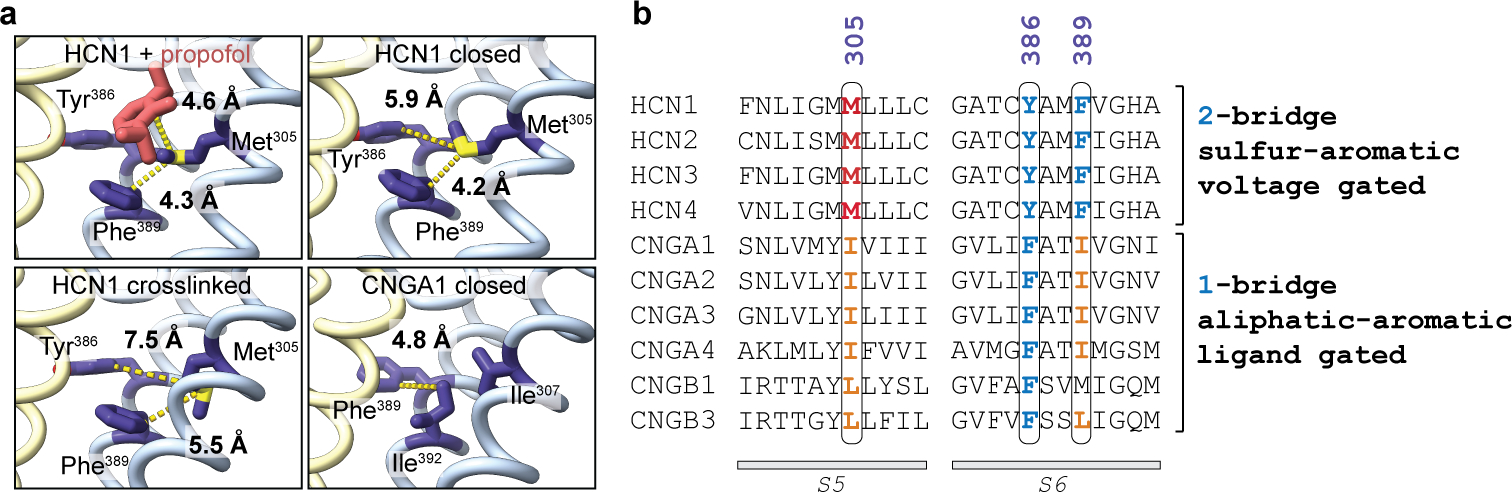
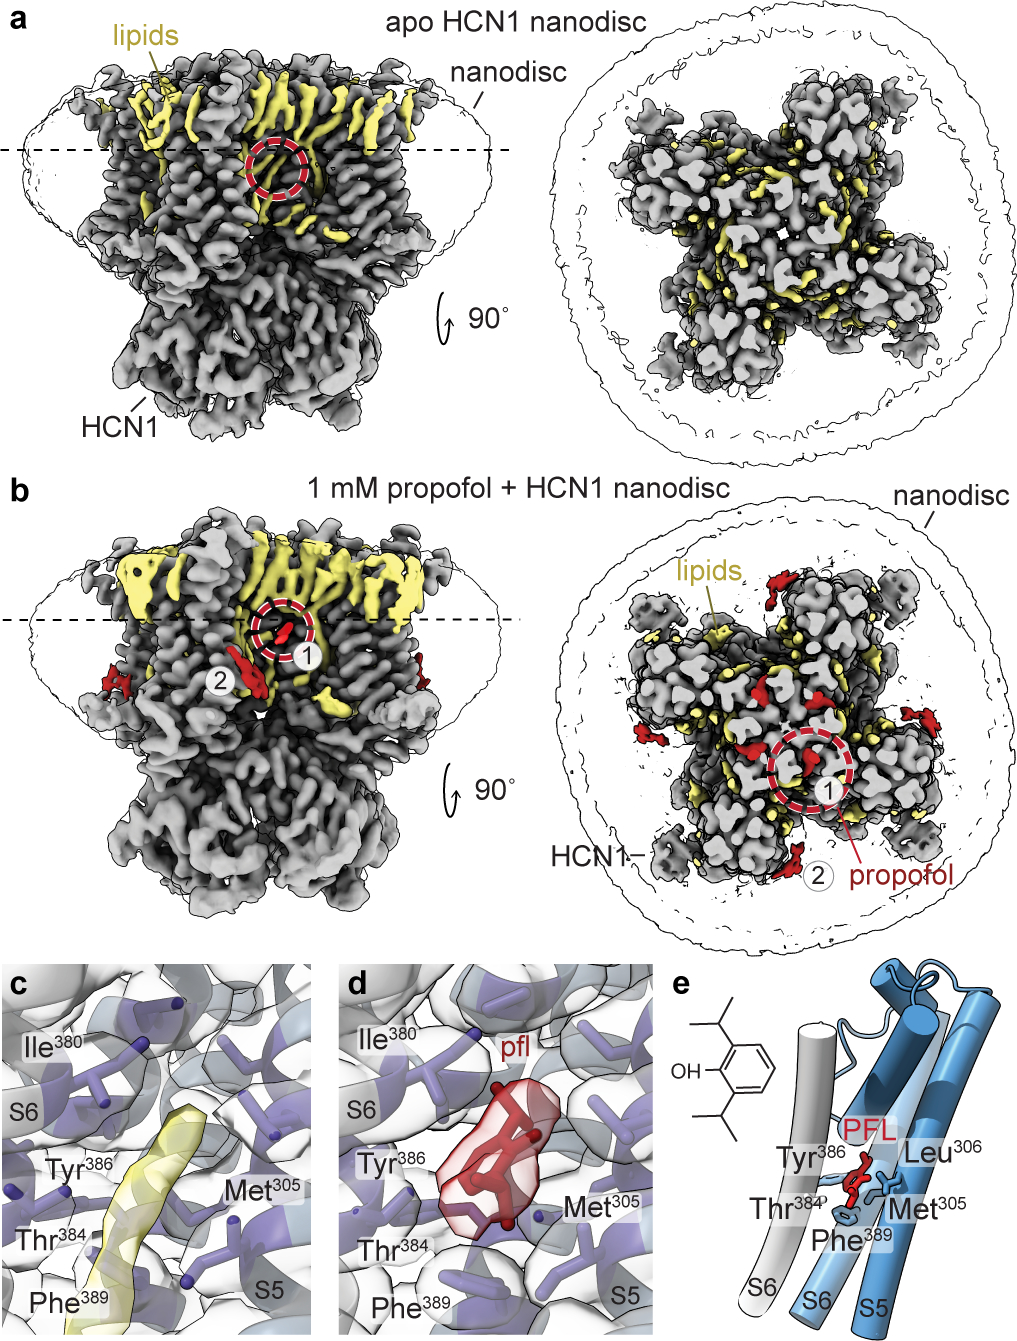
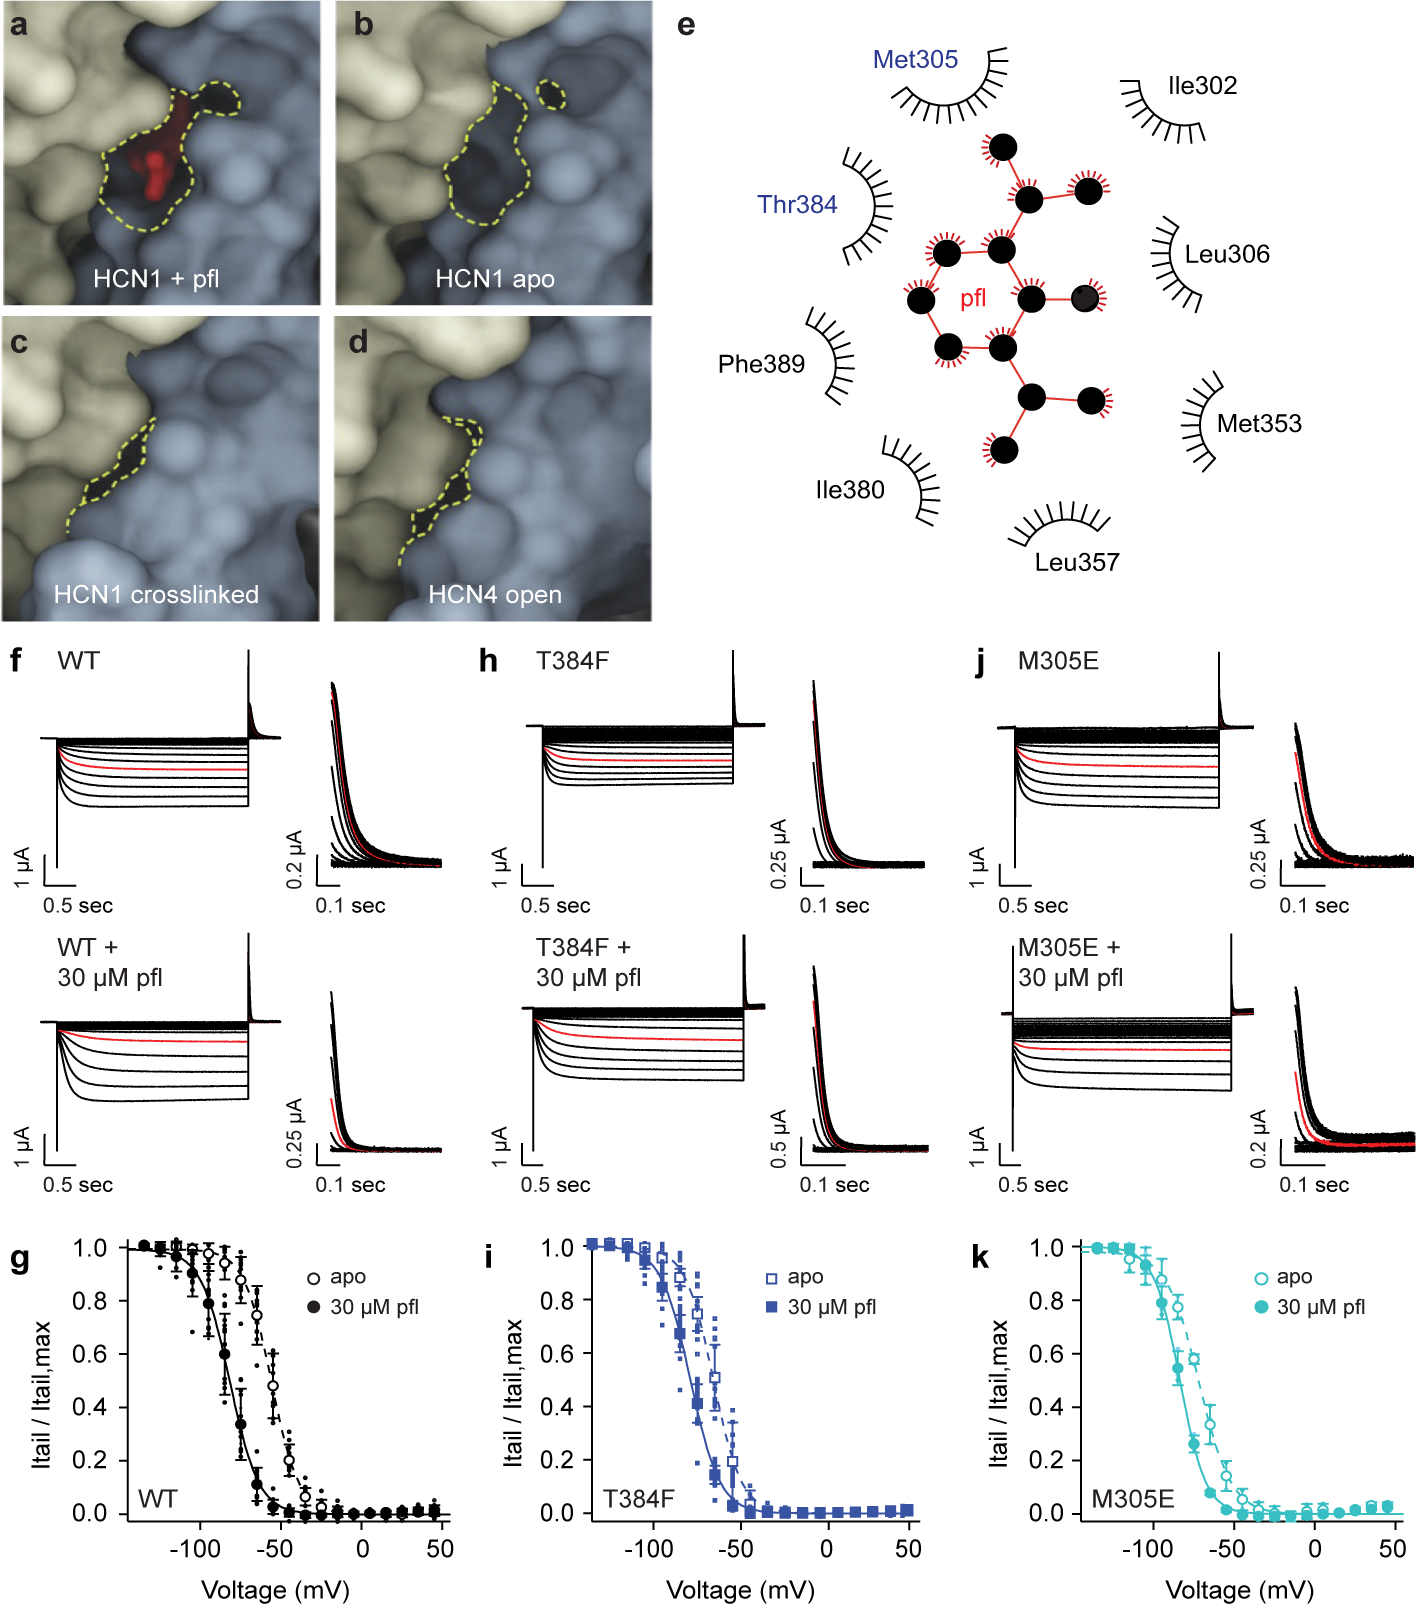
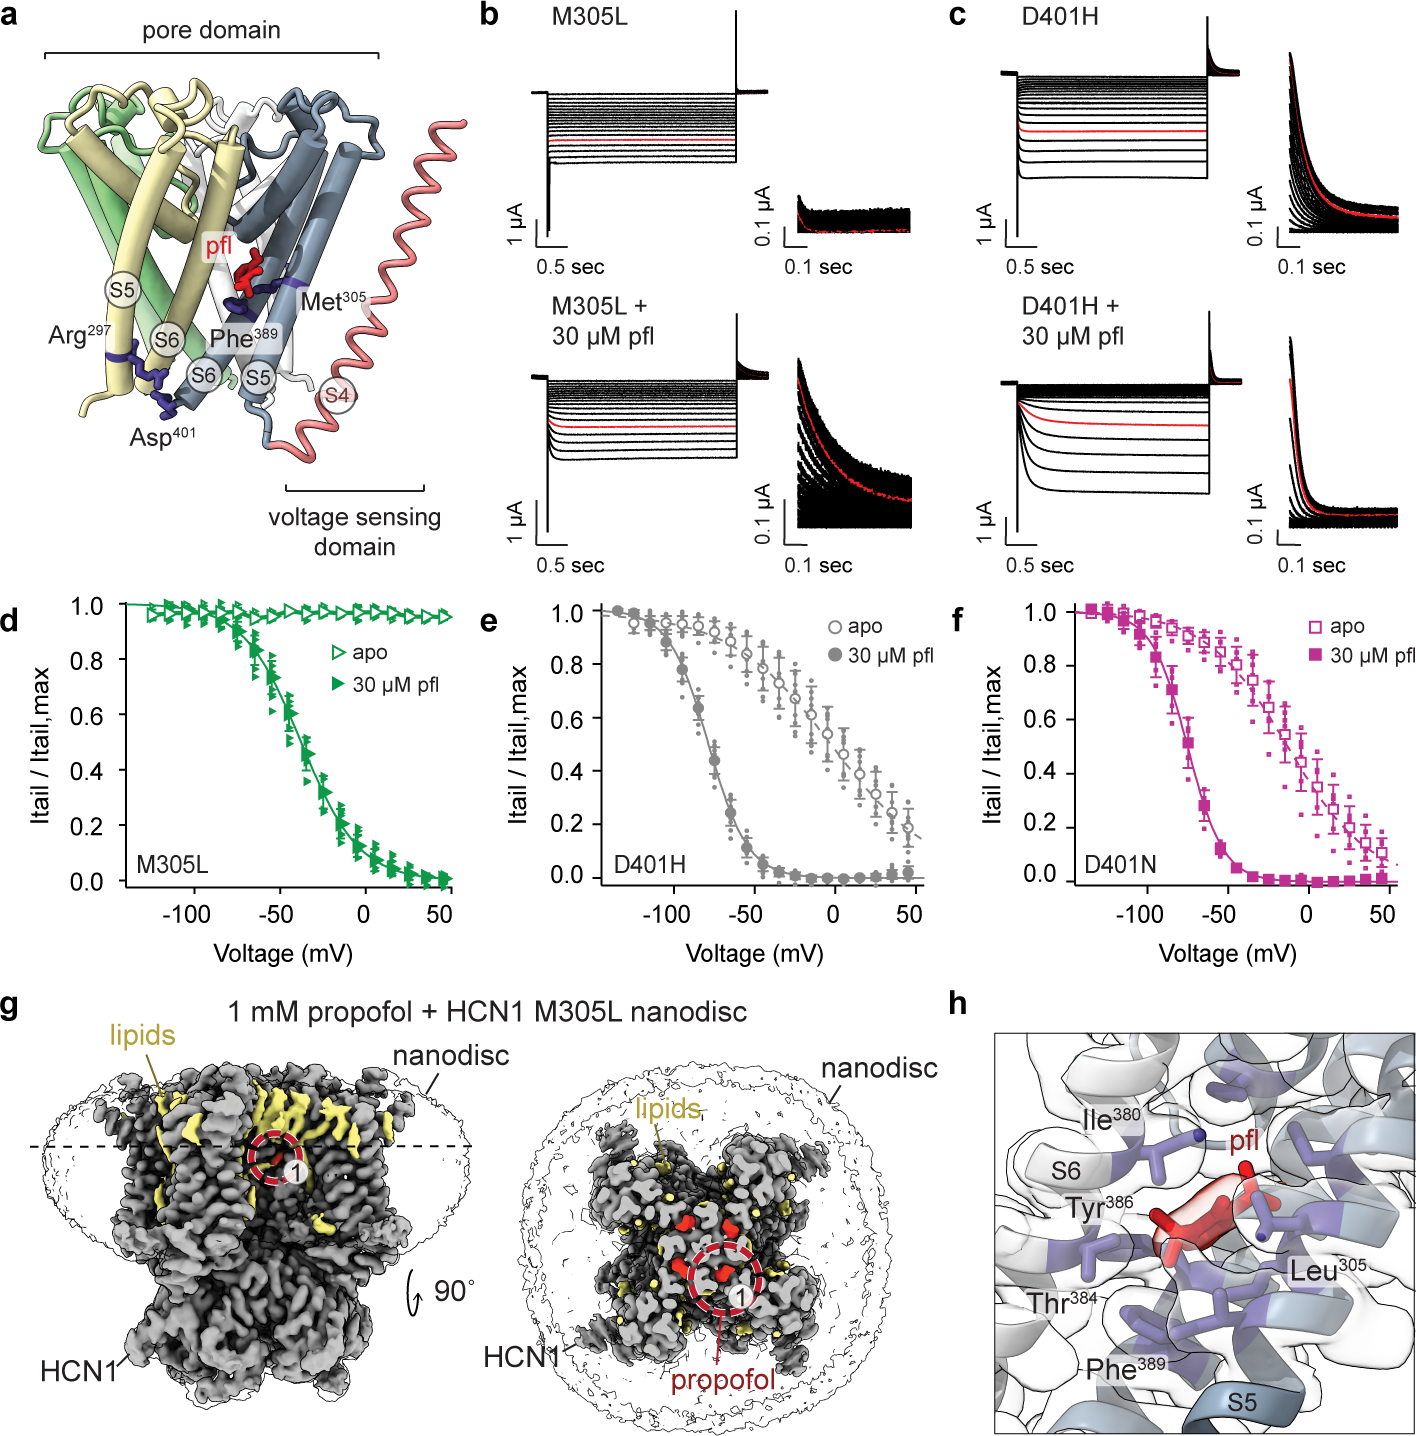
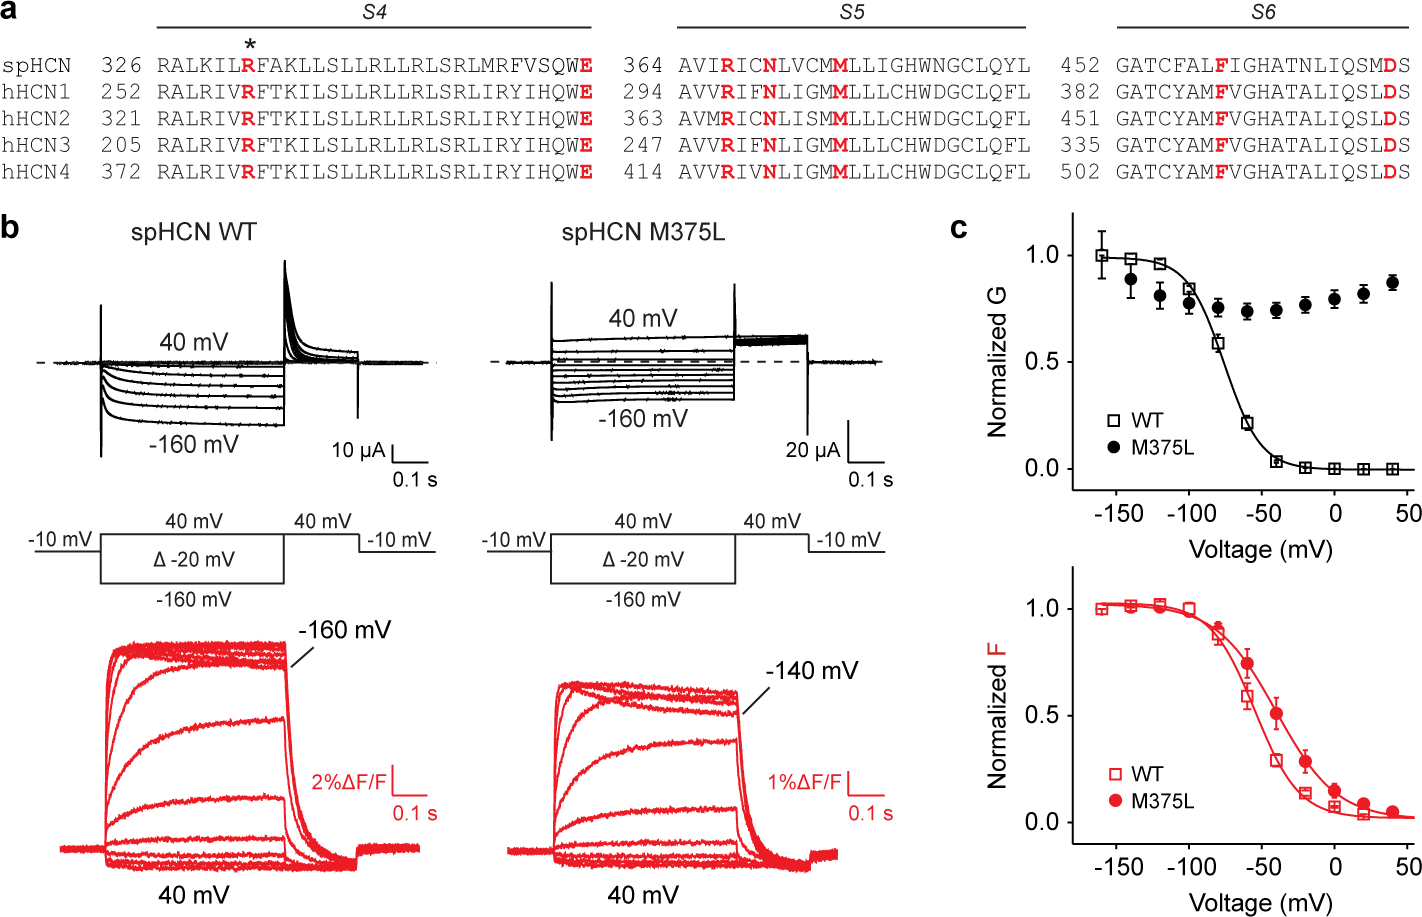
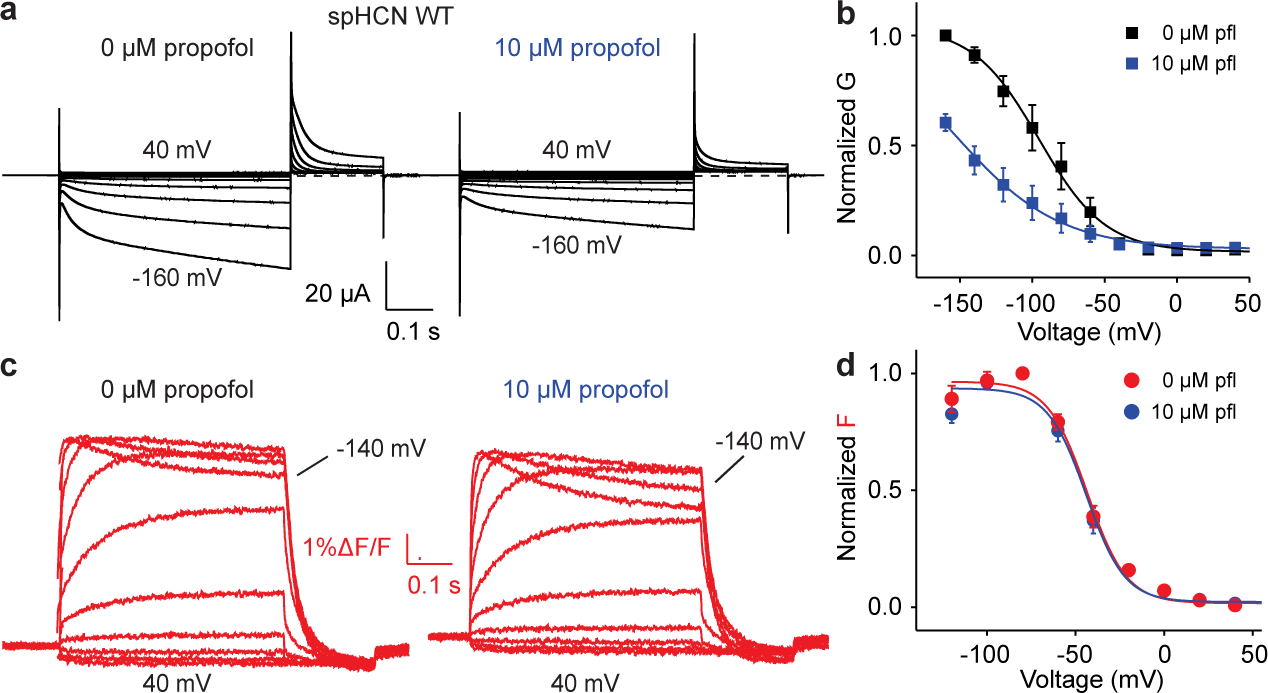
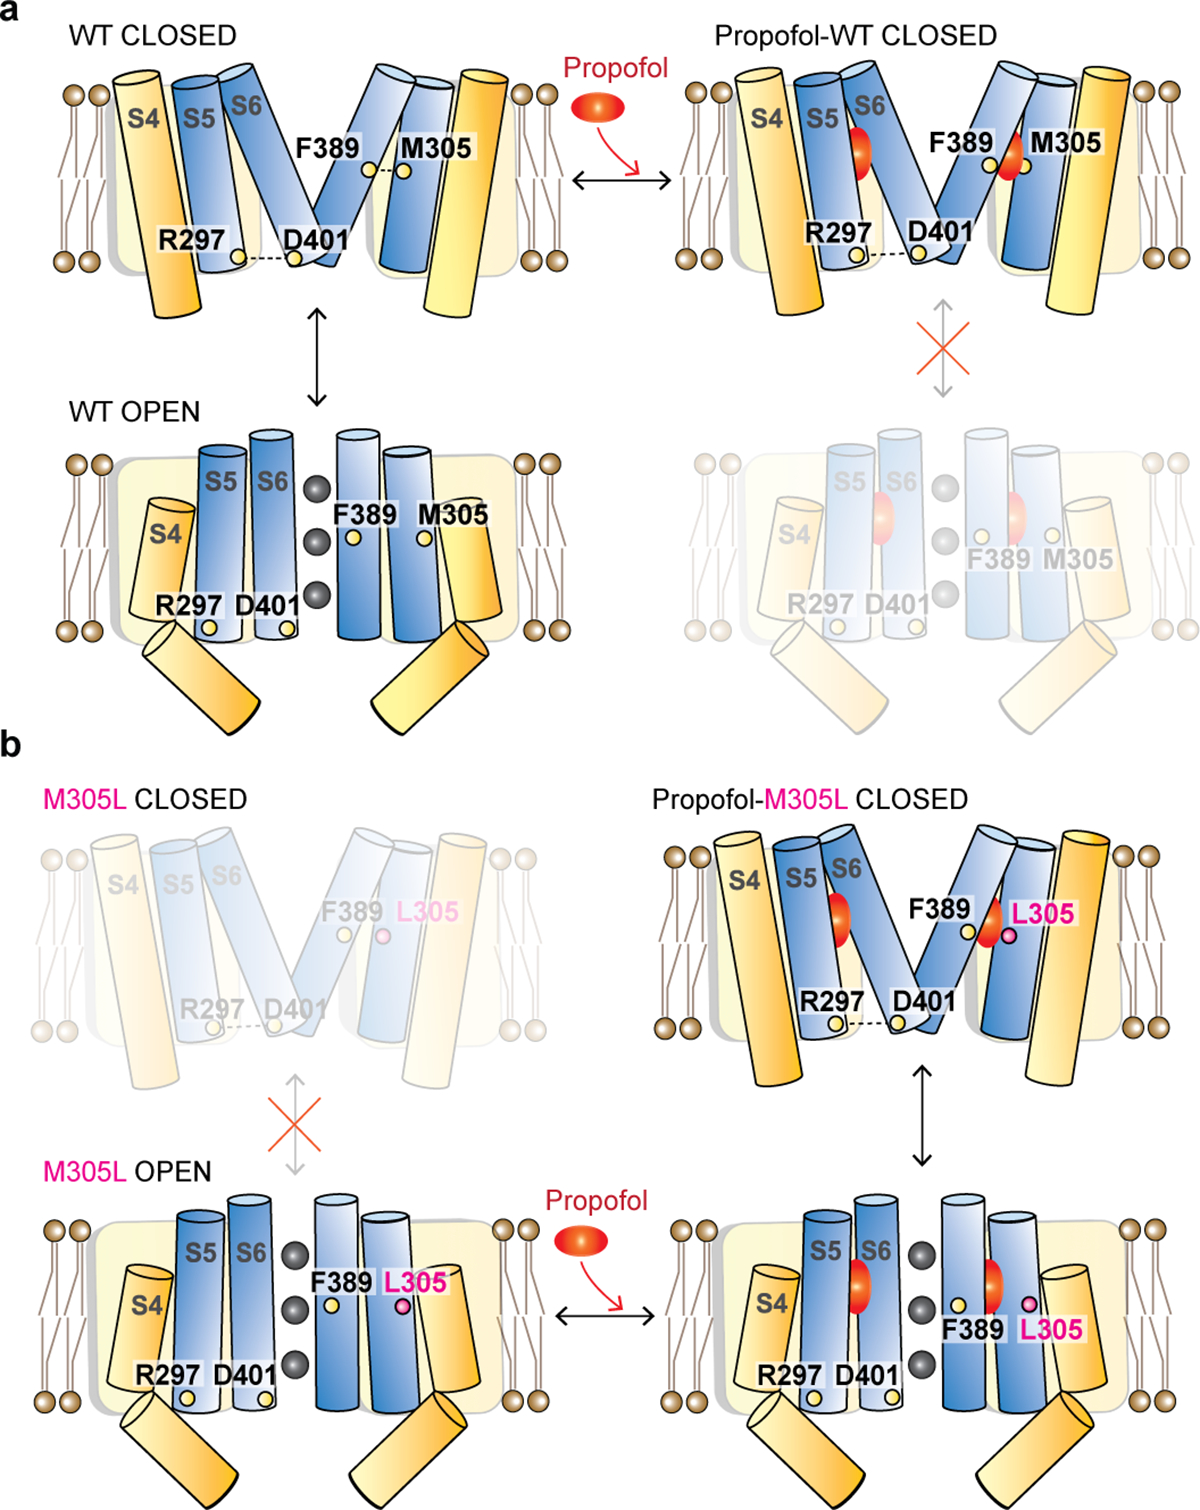
Hyperpolarization-activated cyclic nucleotide-gated (HCN) channels1 are essential for pacemaking activity and neural signalling2,3. Drugs inhibiting HCN1 are promising candidates for management of neuropathic pain4 and epileptic seizures5. The general anaesthetic propofol (2,6-di-iso-propylphenol) is a known HCN1 allosteric inhibitor6 with unknown structural basis. Here, using single-particle cryo-electron microscopy and electrophysiology, we show that propofol inhibits HCN1 by binding to a mechanistic hotspot in a groove between the S5 and S6 transmembrane helices. We found that propofol restored voltage-dependent closing in two HCN1 epilepsy-associated polymorphisms that act by destabilizing the channel closed state: M305L, located in the propofol-binding site in S5, and D401H in S6 (refs. 7,8). To understand the mechanism of propofol inhibition and restoration of voltage-gating, we tracked voltage-sensor movement in spHCN channels and found that propofol inhibition is independent of voltage-sensor conformational changes. Mutations at the homologous methionine in spHCN and an adjacent conserved phenylalanine in S6 similarly destabilize closing without disrupting voltage-sensor movements, indicating that voltage-dependent closure requires this interface intact. We propose a model for voltage-dependent gating in which propofol stabilizes coupling between the voltage sensor and pore at this conserved methionine-phenylalanine interface in HCN channels. These findings unlock potential exploitation of this site to design specific drugs targeting HCN channelopathies.


Conflict of interest statement

Competing interest declaration

GT and PG are co-inventors on patents related to the development of novel alkylphenols for the treatment of neuropathic pain. GT and PG serve on the Scientific Advisory Board for Akelos Inc. (New York, NY), a research-based biotechnology company that has a licensing agreement for the use of those patents.

Figures

Extended Data Fig. 1 |
Extended Data Fig. 1 |. CryoEM data processing of HCN1 WT nanodisc in the absence and presence of 1 mM propofol.
a, SEC chromatograms and SDS-PAGE of HCN1 WT nanodisc purifications in the presence and absence of propofol. For gel source data, see Supplementary Fig. 1. The cryoEM processing schematics are shown for b, apo HCN1 WT nanodisc and c, HCN1 WT nanodisc + pfl. Micrograph scale bar represents 50 nm. d, Backbone RMSD deviations between apo, propofol (pfl), and detergent (PDB 5U6O) structures.
Extended Data Fig. 2 |
Extended Data Fig. 2 |. Local cryoEM densities of propofol binding sites 1 and 2.
Shown are side and top views of the site 1 and site 2 densities from the 3D Refinement map, PostProcess map, DeepEMhancer map, and half map 1 for a, apo WT, b, WT + 1 mM propofol, c, holo M305L, and d, M305L + 1 mM propofol datasets. The HCN1 protein is in gray, tubular lipid densities in yellow, and the identified propofol densities in red. DeepEMhancer representations are used in the manuscript.
Extended Data Fig. 3 |
Extended Data Fig. 3 |. Site 2 is state-independent and does not confer propofol inhibition of HCN1 channels.
a, Overview of the propofol-HCN1 cryoEM map, from Fig 1B, highlighting binding site 1 and site 2. b, Zoomed in view of the residues surrounding the density at site 2. c, Overlay of HCN1 + 1 mM propofol (this study, red-brown), HCN1 crosslinked (PDB6 6UQF, cyan), HCN4 open (7NMN, light blue), and HCN1 closed (5U6O, white). Shown are the response of HCN1 d, L218A and e, K219A in the absence (left) and presence (right) of propofol by two electrode voltage clamp. Voltage clamp ranged from +45 mV to −135 mV with tail currents measured at +50 mV. The current response at −85 mV is highlighted in red. Corresponding Boltzmann fits are shown in f, f, L218A (apo: V1/2=55.3±4.0mV, k = 6.3 ± 0.8 mV, n = 3; pfl: V1/2=86.2±3.4mV, k = 10.1 ± 1.2 mV, n = 4, p < 0.0001) and g, K219A (apo: V1/2=50.7±2.8mV, k = 6.8 ± 0.4 mV, n = 4; pfl: V1/2=83.0±2.5mV, k = 10.2 ± 1.6, n = 4, p < 0.0001). L218A ΔV1/2=31.0±5.2mV and K219A ΔV1/2=32.3±3.7mV, compared to that of WT ΔV1/2=30.9±6.4mV. P-values were determined by two-way ANOVA using a Tukey post hoc test between apo and propofol V1/2, with significance defined as p < 0.05, and n denotes biological replicates. Empty and filled symbols with error bars represent mean ± standard deviation for normalized apo and propofol data, respectively.
Extended Data Fig. 4 |
Extended Data Fig. 4 |. Propofol makes hydrophobic contacts with and exhibits longer residence in site 1.
a, HCN1 was solvated in lipids (yellow-red-blue sticks) and propofol bound at site 1 and site 2 are shown in red spheres. K+ and Cl ions are shown in green and gray spheres, respectively. Waters are not shown for simplicity. RMSD of propofol from their originating position in a MD simulation of the HCN1 WT tetramer in a b, DOPC:POPE:POPS and c, pure POPC lipid bilayer. All 12 propofols unbound from site 2 in both lipid compositions, while 11 of 12 propofols remained bound to site 1 in the DOPC:POPE:POPS bilayer. In the POPC bilayer, 10 of 12 propofols remained at site 1. Propofol (red) at site 1 adopts multiple binding poses in both the d, DOPC:POPE:POPS and e, POPC lipid bilayers. Propofols at the center of each of the three highest populated clusters which contribute to 97% of the total frames are shown in stick model and colored by orange, red-brown, and yellow respectively. Distinct HCN1 subunits are shown in light gray and slate. Amino acid residues lining the binding pocket are in purple. f, Docking of propofol to HCN1 identified 5 transmembrane locations, labeled 1 through 5. Site 1 identified by cryoEM is equivalent to docking position 1. However, site 2 from the cryoEM experiment was not identified. g, Docking of propofol to HCN1 M305L found 4 transmembrane locations. The site 1 was identified, but not site 2. Positions 2 and 4 were also the same as those found in the WT docking experiment in f. For clarity, only the TMs of the channel is shown with individual subunits colored in slate, light grey, green, and red-brown. Docked propofol molecules are in red.
Extended Data Fig. 5 |
Extended Data Fig. 5 |. Perfusion of propofol to HCN1 M305L recovers voltage dependent gating.
a, Schematic of perfusion experiment design. Two electrode voltage clamp recordings were performed pre- and post-perfusion with 30 μM propofol for 10 min. To verify inward HCN1 currents, recording solution supplemented with 1 mM cesium chloride was perfused on and off the cell for 5 min. Shown are representative traces of n = 3 and 4 similar recordings with b, WT and c, M305L, respectively. d, For WT and M305L, the inward current is blocked by cesium while the outward depolarized tails remain intact. Corresponding Boltzmann fits are also shown for WT and M305L. Controls demonstrating inward current cesium block in the absence of 30 μM propofol are shown for e, WT and f, M305L and are representative traces of n = 3 similar recordings. Voltage clamp ranged from +45 mV to −125 mV with tail currents measured at +50 mV. The current response at −85 mV is highlighted in red. Empty and filled symbols with error bars represent mean ± standard deviation for normalized apo and propofol data, respectively. n represents the number of biological replicates. HEK293S GnTI cells transfected with HCN1 g, WT and h, M305L using Lipofectamine 2000 (Invitrogen). Nuclei are in blue, the plasma membrane in red, and HCN1 in green. Expression at the plasma membrane is demonstrated by colocalization (yellow). Shown is a representative cell of WT n = 20 and M305L n = 10 similar cells, over 3 independent transfections. Plotted to the right are intensity values across the dashed orange line. The scale bar represents 10 μm. For microscopy source data, see Supplementary Fig. 2.
Extended Data Fig. 6 |
Extended Data Fig. 6 |. CryoEM data processing of HCN1 M305L nanodisc in the absence and presence of 1 mM propofol.
a, SEC chromatograms and SDS-PAGE of HCN1 M305L nanodisc purifications in the presence and absence of propofol. The nanodiscs for M305L HCN1 holo without propofol were made using MSP1E3 while the ones for M305L HCN1 with propofol were made using MSP2N2. For gel source data, see Supplementary Fig. 1. The cryoEM processing schematics are shown for b, apo HCN1 M305L nanodisc and c, HCN1 M305L nanodisc + pfl. Micrograph scalebar represents 50 nm. d, Pore diagram comparison between holo M305L nanodisc, M305L + pfl, and holo WT detergent (PDB 5U6P) structures using HOLE. Red indicates regions that are smaller than a single water molecule to pass, green for a single water molecule, and blue is double the radius of a single water molecule. Both holo structures contain cAMP. e, Backbone RMSD deviations of the voltage sensing domain (S1-S4) between holo M305L, holo WT (PDB 5U6P), and M305L propofol structures.
Extended Data Fig. 7 |
Extended Data Fig. 7 |. Voltage-independent spHCN-M375L channels are blocked by the specific HCN channel blocker ZD7288 and the Met375-Phe459 interaction is important to close spHCN channels at positive voltages.
a, Representative current traces from spHCN M375L channels before (left) and after (right) the application of 100 μM ZD7288. Dashed lines indicate no currents. Met375 and Phe459 mutants show currents at positive voltages and similar voltage sensor movement. b, GV and c, FV relations from WT (black), M375L (blue), M375F (purple), M375A (green), M375C (orange) and M375S (pink) mutant spHCN channels. d, GV and e, FV relations from WT (black), F459Y (pink), F459C (orange), F459M (purple), F459E (cyan), F459A (green), F459L (blue), F459Q (gray), F459V (magenta) and F459W (dark yellow) mutant spHCN channels. f, Representative current traces from oocytes expressing WT, M375F, F459M and M375F/F459M spHCN channels. Dashed lines indicate no currents. g, GV relations from WT (black), M375F (green), F459M (orange) and M375F/F459M (red) spHCN channels. All GV1/2,FV1/2 and n numbers are shown in Extended Data Table 2. Data are represented as mean ± SEM. n indicates the number of biological replicates.
Extended Data Fig. 8 |
Extended Data Fig. 8 |. Met-aromatic interactions occur in voltage-gated HCN1 channels.
a, Local structure of HCN1 + propofol, HCN1 closed (PDB 5U6O), and HCN1 crosslinked (PDB 6UQF) around the Met305-Phe389 interaction. The homologous positions Ile307-Ile392 for the CNGA1 structure (PDB 7LFT) are also shown. Approximate distances between atoms (dashed yellow lines) are labeled between methionine, isoleucine, and the adjacent aromatic rings (purple). Propofol is colored in pink and adjacent protomers are in blue and yellow. b, Multiple sequence alignment between human HCN and CNG isoforms. Residue numbering follows the HCN1 amino acid sequence. The methionine, isoleucine, and aromatic positions labeled in panel a are highlighted in red, orange, and blue. A single aliphatic-aromatic interaction (1-bridge) exists in CNG channels which are ligand gated. In contrast, an interaction between methionine with two aromatic residues (2-bridge) occurs in HCN channels which are voltage gated.
Fig. 1 |
Fig. 1 |. Structural resolution of the propofol-HCN1 complex.
a-b, CryoEM maps of HCN1 WT reconstituted into lipid nanodiscs without and with propofol. In gray is the HCN1 protein density and in yellow are tubular lipid densities. The extracellular top view (right) is cross sectioned at the dashed line on the side view, perpendicular to the bilayer (left). Circled in the red dashed line is the focused region for panels c, apo HCN1 WT nanodisc and d, 1 mM propofol (pfl) + HCN1 WT nanodisc. Residues lining the binding site are colored in purple and propofol in red. Adjacent subunits are in gray and slate, respectively. The propofol density can accommodate multiple poses for propofol and our final model contains the same pose that was identified independently by a blind docking algorithm (Extended Data Fig. 4). e, The chemical structure of propofol and its location in the transmembrane domain, with adjacent subunits in grey and slate.
Fig. 2 |
Fig. 2 |. Site 1 appears to be a state dependent pocket and mutation of residues reduced druggability.
a-d, Space-filled models of HCN1 + propofol (pfl), HCN1 closed (PDB 5U6O), HCN1 with the VSD crosslinked in a hyperpolarized conformation (PDB 6UQF), and HCN4 in the open state (PDB 7NMN). Adjacent subunits are in blue and yellow and propofol is in red. The propofol pocket (dashed yellow lines) in the closed states is no longer present in the HCN1 crosslinked or HCN4 open state. e, LigPlot diagram showing site 1 hydrophobic contacts. Met305 and Thr384, probed by TEVC, are in blue and propofol in red. Currents and Boltzmann fits of HCN1 f-g, WT, h-i, T384F, and j-k, M305E to hyperpolarizing voltages in the absence and presence of propofol. Voltage clamp ranged from +45 mV to −125 mV with tail currents measured at +50 mV. The current response at −85 mV is highlighted in red. Boltzmann parameters for WT (apo: V1/2=58.2±3.4mV, k = 9.3 ± 1.7 mV, n = 22; pfl: V1/2=89.1±5.5mV, k = 9.5 ± 1.0 mV, n = 24, p < 0.0001), T384F (apo: V1/2=65.6±5.5mV, k = 7.4 ± 1.3 mV, n = 15; pfl: V1/2=79.0±3.5mV, k = 8.2 ± 0.7 mV, n = 11, p < 0.0001), and M305E (apo: V1/2=72.5±0.5mV, k = 10.1 ± 3.4 mV, n = 3; pfl: V1/2=83.8±1.9mV, k = 8.1 ± 0.7 mV, n = 3, p = 0.7909). P-values were determined by two-way ANOVA using a Tukey post hoc test between apo and propofol V1/2, with significance defined as p < 0.05. Error bars represent mean ± standard deviation and n denotes biological replicates.
Fig. 3 |
Fig. 3 |. Propofol restores function of disease-causing HCN1 mutants.
a, Schematic of the intraprotomer S5-S6 helix Met-Phe and interprotomer S5-S6 helix Arg-Asp salt-bridge interactions with respect to propofol (red). Individual pore domain subunits are highlighted in yellow, green, white, and blue. The S4 helix is in red-brown. b-c, TEVC currents of M305L and D401H in the absence and presence of propofol. Similar currents were observed for D401N. Voltage clamp ranged from +45 mV to −125 mV with tail currents measured at +50 mV. The response at −85 mV is in red. d-f, Tail currents fitted with a Boltzmann for M305L (pfl: V1/2=37.9±4.3mV, k = 16.9 ± 2.4 mV, n = 6), D401H (apo: V1/2=2.9±12.8mV, k = 32.1 ± 5.7 mV, n = 11; pfl: V1/2=78.5±2.3mV, k = 12.0 ± 1.5 mV, n = 12, p < 0.0001), and D401N (apo: V1/2=9.7±13.8mV, k = 27.8 ± 4.4 mV, n = 13; pfl: V1/2=76.1±8.1mV, k = 10.2 ± 1.3 mV, n = 11, p < 0.0001). P-values were determined by two-way ANOVA using a Tukey post hoc test between apo and propofol V1/2, with significance defined as p < 0.05. Error bars represent mean ± standard deviation and n denotes biological replicates. g, CryoEM map of HCN1 M305L with propofol (red). In gray is HCN1 and in yellow, lipid densities. The top view is cross sectioned at the side view dashed line. The red circle is the focused region for h, the propofol binding site. Subunits are in gray and slate. The propofol density can accommodate multiple poses and our model contains a similar pose to that uncovered by blind docking (Extended Data Fig. 4).
Fig. 4 |
Fig. 4 |. Homologous epilepsy-associated M305L mutant channels are voltage-independent but with intact voltage sensor movement.
a, Sequence alignment of S4, S5 and S6 of spHCN, hHCN1, hHCN2, hHCN3 and hHCN4 channels. Residue R332 (asterisk) was mutated to a cysteine for voltage clamp fluorometry. Residues investigated or mentioned in this study are labelled in red. b, Current (black) and fluorescence (red) traces from oocytes expressing spHCN WT and spHCN M375L channels in response to the voltage protocol indicated. Cells are held at −10 mV and stepped to voltages between +40 mV and −160 mV in −20 mV increments followed by a step to +40 mV. Dashed lines indicate no currents. c, Voltage dependence of currents (black) and fluorescence (red) from spHCN WT (empty squares, n=3) and spHCN-M375L (solid circles, n=4) channels. Data are represented as mean ± SEM and all n represent biologically independent replicates.
Fig. 5 |
Fig. 5 |. Propofol inhibits spHCN current without changing voltage sensor movement.
a, Representative current traces from spHCN WT channels from the same oocyte before (left) and after (right) the application of 10 μM propofol. Dashed lines indicate no currents. b, GV relations from spHCN channels before (black) and after (blue) the application of 10 μM propofol. The conductance at −160 mV was reduced by 46 ± 2% (n=3). c, Representative fluorescence traces from spHCN WT channels from the same oocyte before (left) and after (right) the application of 10 μM propofol. The amplitude of the fluorescence signal was slightly reduced after the application of propofol due to the photobleaching and/or internalization of labeled channels. d, FV relations (n=3) from spHCN channels before (red) and after (blue) the application of 10 μM propofol (pfl). Data are represented as mean ± SEM and all n represent biologically independent replicates.
Fig. 6 |
Fig. 6 |. The effect of propofol on wildtype and M305L channels.
a, Cartoon of HCN1 channels with and without propofol (only two subunits shown for simplicity). The closed state with S4 up is stabilized by interactions such as R297-D401 and M305-F389. Downward movement of individual S4s in response to hyperpolarization breaks interactions between S4 and S5. A break in S4, opens a crevice between S4 and S5, allowing S5 to swing outwards, and S6 to rotate and open the pore. Propofol binding stabilizes the closed state and strengthens the voltage sensor-to-gate coupling. b, Cartoon of HCN1 M305L channels with and without propofol. The closed states are destabilized due to the missing M305-F389 interaction. Propofol binding stabilizes the closed state and strengthens the voltage sensor-to-gate. The closed state with S4 up is stabilized by interactions such as R297-D401 and the propofol-M305L-F389 interaction.

Comment in

References

    1. Kaupp UB & Seifert R Molecular diversity of pacemaker ion channels. Annu Rev Physiol 63, 235–257 (2001). 10.1146/annurev.physiol.63.1.235 - DOI - PubMed
    1. DiFrancesco D Pacemaker mechanisms in cardiac tissue. Annu Rev Physiol 55, 455–472 (1993). 10.1146/annurev.ph.55.030193.002323 - DOI - PubMed
    1. Biel M, Wahl-Schott C, Michalakis S & Zong X Hyperpolarization-activated cation channels: from genes to function. Physiol Rev 89, 847–885 (2009). 10.1152/physrev.00029.2008 - DOI - PubMed
    1. Tibbs GR et al. An anchor-tether ‘hindered’ HCN1 inhibitor is antihyperalgesic in a rat spared nerve injury neuropathic pain model. Br J Anaesth (2023). 10.1016/j.bja.2023.06.067 - DOI - PMC - PubMed
    1. Bleakley LE et al. Cation leak underlies neuronal excitability in an HCN1 developmental and epileptic encephalopathy. Brain 144, 2060–2073 (2021). 10.1093/brain/awab145 - DOI - PMC - PubMed

MeSH terms