. 2024 Aug;632(8025):630-636.
doi: 10.1038/s41586-024-07748-8. Epub 2024 Jul 31.

Immunological memory diversity in the human upper airway

Affiliations

Immunological memory diversity in the human upper airway

Sydney I Ramirez et al. Nature. 2024 Aug.

Erratum in

Abstract

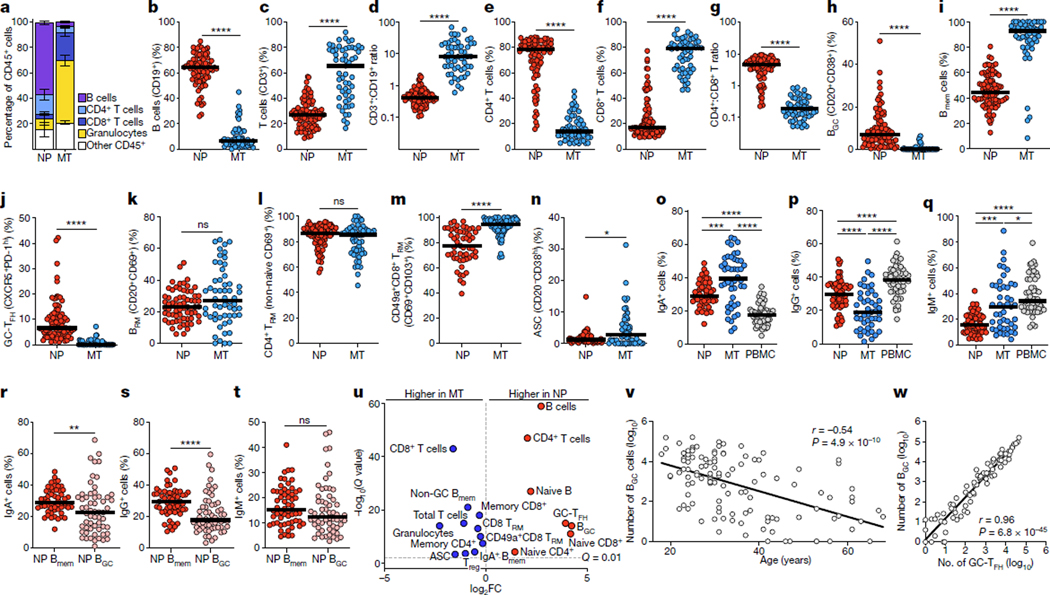
The upper airway is an important site of infection, but immune memory in the human upper airway is poorly understood, with implications for COVID-19 and many other human diseases1-4. Here we demonstrate that nasal and nasopharyngeal swabs can be used to obtain insights into these challenging problems, and define distinct immune cell populations, including antigen-specific memory B cells and T cells, in two adjacent anatomical sites in the upper airway. Upper airway immune cell populations seemed stable over time in healthy adults undergoing monthly swabs for more than 1 year, and prominent tissue resident memory T (TRM) cell and B (BRM) cell populations were defined. Unexpectedly, germinal centre cells were identified consistently in many nasopharyngeal swabs. In subjects with SARS-CoV-2 breakthrough infections, local virus-specific BRM cells, plasma cells and germinal centre B cells were identified, with evidence of local priming and an enrichment of IgA+ memory B cells in upper airway compartments compared with blood. Local plasma cell populations were identified with transcriptional profiles of longevity. Local virus-specific memory CD4+ TRM cells and CD8+ TRM cells were identified, with diverse additional virus-specific T cells. Age-dependent upper airway immunological shifts were observed. These findings provide new understanding of immune memory at a principal mucosal barrier tissue in humans.


Conflict of interest statement

Competing interests S.C. has consulted for GSK, JP Morgan, Citi, Morgan Stanley, Avalia NZ, Nutcracker Therapeutics, University of California, California State Universities, United Airlines, Adagio, Sanofi and Roche. LJI has filed for patent protection for various aspects of T cell epitope and vaccine design work. The other authors declare no competing interests.

Figures

Extended Data Fig. 1 |
Extended Data Fig. 1 |. NP swab sampling reveals diverse URT cell populations.
a. Total viable CD45+ immune cells collected per NP swab (n = 315 swabs). b. Example flow gating of CD45+ immune cell populations upstream of the TRM and putative BRM population gates shown in Fig. 1d c. Left: total viable CD45EpCAM+ (CD326) epithelial cells collected per NP swab (n = 164 swabs); Right: example CD45 × EpCAM gating with CD45EpCAM+ epithelial cell populations in the lower right quadrant. d. Epithelial cell UMAP from scRNA-seq of the approximately 8,000 epithelial cells derived from the same 12 NP swabs/donors as Fig. 1e. e. Dot plot demonstrating expression patterns of epithelial cell cluster defining genes. f. UMAP from Fig. 1e split by donor to show the contribution of NP swabs from each donor. g. Feature plots of gene (top panels) vs surface protein (bottom panels) expression for CD45, CD19, CD3E RNA and their corresponding proteins for the combined immune cell UMAP shown in Fig. 1e. h. Feature plots of gene (top panels) vs surface protein (bottom panels) expression for CD4 and CD8A RNA and their corresponding proteins for the T cell subset UMAP shown in Fig. 1f. Related to Fig. 1.
Extended Data Fig. 2 |
Extended Data Fig. 2 |. Characterization of adaptive immune populations of the human URT.
a. B cell subset UMAP generated from the approximately 35,000 B cells from Fig. 1e, with subset identities assigned by gene expression. b-c. (b) B cell and (c) T cell profiles (percentage of each lymphocyte subset for each donor) for each of the 12 swab donors whose B and T cell data are shown in Extended Data Fig. 2a and Fig. 1f, respectively. d. GSEA of the T cell subsets in Fig. 1f for the MAIT gene signature: NES = normalized enrichment score; -log(padj) = negative log10 Benjamini-Hochberg adjusted p-values (see Methods for details). MAIT were identified by a combination of gene expression and scTCRseq analysis (see Methods for details). e. Feature plot of FAS expression with the CD4+ TMem cluster from Fig. 1f circled. f-g. The clusters labelled TFH and Treg in Fig. 1f were named based on their most prominent cell type. Subset UMAPs generated from each of the (f) ~3,700 cell TFH and (g) ~1,500 Treg cluster cells from Fig. 1f showing additional cell types identified by subset analysis. Within the TFH cluster: mantle TFH (mTFH), GC-TFH, and GC-TFH with a type 1 IFN signaling signature (GC-TFHIFN). Within the Treg cluster: Treg, TH17, TFH, and TFR. See Fig. 1j for gene expression profiles. Virus-specific T cells were identified in these clusters and are indicated by colored halos based on the key shown in panels f,g. h. Example gating for T cell sorting for scRNA-seq/scTCR-seq based on AIM marker expression. i. SARS2 spike- and non-spike—specific TFH counts identified by AIM assay for each donor. j. SARS2-specific TFH counts (number per breakthrough infection donor swab) plotted by days post-COVID symptom onset. k. SARS2-specific T cell subsets identified in NP swabs split by donor. Related to Fig. 1.
Extended Data Fig. 3 |
Extended Data Fig. 3 |. Experimental workflow for defining personalized SARS2-specific T cell TCR references to identify upper airway antigen-specific T cells.
a. Workflow diagram for the 12 participants who underwent paired sample collection of peripheral blood (to isolate PBMCs) and NP swabs for CITE-seq plus scRNA-seq/scTCR-seq. SARS2-specific NP T cells were identified based on TCR overlap between NP swabs and blood. b-d. Representative flow plots for stimulated PBMC-derived SARS2-specific (b) CD4 T cells as OX40+CD40L+, (c) CD4 T cells as OX40+41BB+, and (d) CD8 T cells as CD69+41BB+ by AIM assay from a convalescent COVID-19 control donor with robust CD4 and CD8 S and non-S responses. e-g. Frequency of SARS2-specific (e) OX40+41BB+ CD4 T cells, (f) OX40+CD40L+ CD4 T cells, and (g) CD69+41BB+ CD8 T cells by AIM assay. For e-g the dotted line = limit of quantitation. h-j Stimulation index (SI) = fold-change above negative control for SARS2-specific CD4 (h) OX40+41BB+ and (i) OX40+CD40L+ and CD8 (j) CD69+41BB+ T cell responses by AIM assay. For h-j the dotted line = SI of 2. For e-j, data is shown from the 12 donors in panel a; positive responses are greater than the dotted line and negative responses are set to baseline (0.5 × LOQ or SI = 1); bar = geomean; dots are color-coded based on COVID-19 status as per the legend. Related to Fig. 1. Panel a was created using BioRender (https://Biorender.com).
Extended Data Fig. 4 |
Extended Data Fig. 4 |. Adult adenoids are URT secondary lymphoid organs with functional GCs.
a. Example gating for NP swab (adenoid) BGC and GC-TFH. ASC = antibody secreting cells. b. Top panels: flow plots showing intracellular Ki67 and BCL6 staining for BGC compared with non-BGC; Bottom panels: histograms showing intracellular BCL6 expression in GC-TFH, non-TFH CD4+ T cells, and BGC. c. UMAP showing the cell cycle phases of the BGC in Fig. 2b. d. Dot plot showing expression of additional BGC genes (related to Fig. 2c). e. A B cell clonal lineage from the NP swab of donor 4379, represented as linear phylogenic trees by B cell type (left) and by isotype (right). Related to Fig. 2.
Extended Data Fig. 5 |
Extended Data Fig. 5 |. Adenoids and nasal turbinate mucosa have distinct immune cell profiles.
a. Example gating for B and T cell subsets and B cell isotypes from NP and MT swabs shown in Fig. 3 and in b-h. b-h. Additional differences between NP (adenoid) and MT swab populations: (b) % naive B of total B cells, (c) % naive CD4+ of total T cells, (d) % naive CD8+ of total CD8+ T cells, (e) %Treg of CD4+ T cells, (f) %CD8+ TRM (CD69+CD103+) of CD8+ T cells (g) % non-naive CD4+ of total CD4+ T cells, and (h) % non-naive CD8+ of total CD8+ T cells. For b-h: Pairwise testing by Mann-Whitney; bars = median, two-tailed p-values: *** = p < 0.001, **** = p < 0.0001 (n = 38 donors; 88 NP and 55 MT swabs). i. Example flow plots for putative BRM (CD69+ B cells), CD4+ TRM (CD69+CD103+/−), CD8+ TRM (CD69+CD103+), BGC (CD19+CD20+CD38+), and GC-TFH (CXCR5+PD-1hi) in blood (PBMC). j-o. Additional correlations related to adenoid atrophy with aging: (j) frequency of BGC (% of total B cells) per NP swab vs age (n = 138 donors; 1 swab/donor), (k) BGC per NP swab in log10 vs % naive B (of total B cells) (n = 233 swabs), (l) frequency of GC-TFH (% of CD4+ T cells) per NP swab vs age (n = 138 donors; 1 swab/donor), (m) GC-TFH in log10 per NP swab vs age (n = 119 donors; 1 swab/donor), (n) frequency of naive B (% of total B cells) per NP swab vs age (n = 138 donors; 1 swab/donor), (o) naive B per NP swab in log10 vs age (n = 138 donors; 1 swab/donor); For j, k, n, and o: Spearman r and two-tailed p-values. For l-m: Pearson r and two-tailed p-values. Related to Fig. 3.
Extended Data Fig. 6 |
Extended Data Fig. 6 |. Multimodal validation of SARS2-specific URT mucosal B cells.
a. Example flow gating related to SARS2 probe staining for SARS2 S-, RBD-, and N-specific B cells. b. Proportion of IgG+ SARS2-specific Bmem in NP (n = 58 subjects) and MT swabs (n = 11 subjects) versus PBMC (n = 24 subjects). Bars = median. Pairwise comparisons by Mann-Whitney; two-tailed p-values: ns = not significant, * = p ≤ 0.05, **** = p ≤ 0.0001. Please see Methods for additional details. c. % SARS2 N-, RBD-, and spike (S)-specific IgA+ or IgG+ Bmem of total Bmem over time post-breakthrough infection by flow cytometry with fluorescent probe staining (n = 32–41 subjects). Dotted line = limit of detection. d. Select differences in gene expression patterns between NP swab putative BRM (orange) and PBMC-derived atypical Bmem (teal). PBMC-derived atypical Bmem often express TBX21. e. Gating strategy for sorting SARS2 S-, RBD-, and N-specific Bmem in PBMC for scRNA-seq/scBCR-seq. f. SARS2-specific B cells from the 3 breakthrough infection donors in Fig. 4h color-coded by method used for assigning Ag-specificity. g. Heat map of human bone marrow PB and early vs late PC gene expression by NP ASC cells in Fig. 4k based on published gene signatures. h. UMAP related to Fig. 4k showing BPC belonging to donor 4809 that are from the SARS2-specific clones 2 and 3 shown in Fig. 4l, and BPC belonging to a non-SARS2-specific clone (4809_10). Related to Fig. 4.
Extended Data Fig. 7 |
Extended Data Fig. 7 |. Expansion of SARS2 Omicron BA.4/5 variant-specific Bmem in the upper airway.
a. UMAP plots demonstrating the distribution of Omicron-specific clones 2 and 3 from donor 4809 across the B cell clusters from Fig. 4d. b. Two SARS2 Omicron-specific B cell clonal lineages from donor 4809 represented as linear phylogenic trees as in Fig. 4l. Tip sizes represent the number of cells with identical features. Tip colors represent the isotype. Tip labels represent validated antibodies. c. ELISA IgG dilution curves for ancestral and Omicron BA.4/5 RBD for the antibodies generated for SARS2-specific B cell validation (related to Fig. 4m summary data). Mean and standard deviation (error bars) for three independent experiments are shown for controls and the 23 mAb in Fig. 4m. d. Timeline of vaccination, breakthrough infection, and NP swab collection for single-cell experiments for donor 4809. Related to Fig. 4.
Fig. 1 |
Fig. 1 |. Distinct human upper airway cell populations sampled by NP swabs.
a, Number of viable cells per NP swab; each dot represents one NP swab per donor, black line is the median (n = 170 swabs). b, Representative flow cytometry plots of NP swab total B cells and T cells (top), and CD4+ and CD8+ T cells (bottom). c, URT CD45+, B cell and T cell stability over time, calculated as percentage change from median frequency for each donor; individual donor data in grey (n = 20 donors). d, Representative flow cytometry of URT CD4+ and CD8+ TRM cells, and putative BRM cell populations; stability of these populations over time as percentage change from median; individual donor data in grey (n = 20 donors). e, Combined Seurat UMAP for approximately 70,000 cells from 12 NP swabs (n = 12 donors); doughnut plot shows representative proportions of each cell type by scRNA-seq/CITE-seq. f, T cell subset UMAP generated from the approximately 19,000 T cells in e; T cell subset identities assigned by gene expression profiling and CITE-seq. g, Dotplot of select cluster-defining genes for T cell subsets in f. Protein markers (CITE-Seq) in bold with ‘Prot’. h, GSEA analysis of T cell subsets in f. i,j, Dotplots of select genes from subset analysis of TFH cell (i) and Treg cell (j) dominated clusters from f. k,l, SARS2-specific T cells in NP swabs determined experimentally by AIM assay (spike (S) or non-spike SARS2 antigen-specific) and personalized SARS2-specific TCR repertoire datasets for each subject (k), or identified bioinformatically using public datasets (l). m, SARS2-specific CD4+ versus CD8+ T cells, overlaid on UMAP from f. n, SARS2-specific T cell subtypes from km. See Extended Data Figs. 2d–g,i–k and 3 for further details and stratifications. abs(NES), absolute value of the normalized enrichment score; CTL, cytotoxic T lymphocyte; DC, dendritic cell; mono/mac, monocyte/macrophage; mTFH, mantle TFH; NK, natural killer; ns, not significant; Padj, adjusted P value; Teff, effector T.
Fig. 2 |
Fig. 2 |. Upper airway mucosal BGC cells and GC-TFH cells consistently sampled by NP swabs.
a, Representative flow cytometry plots of GC populations from NP swabs (BGC: CD20+CD38+ of CD19+ B cells and GC-TFH: CXCR5+PD-1hi of CD4+ T cells). b, BGC cell subset UMAP of approximately 5,500 cells from the BGC cell clusters shown in Extended Data Fig. 2a, demonstrating distinct dark zone (DZ) and light zone (LZ)/intermediate (Int) states. c,d, Characterization of BGC cells from NP swabs by scRNA-seq transcriptomic profiling (c) and GSEA (d). e, Schematics and representative images of endoscopic-guided MT and NP (adenoid) swab sampling from the same donor. f, Immunophenotyping from paired swabs collected by endoscopy compared with control adenoid tissue (from a different donor). g, Stability of URT GC populations (BGC cells and GC-TFH cells) from NP swabs over time by flow cytometry (data shown for NP swabs from original longitudinal cohort donors with BGC cell counts greater than 100; n = 15 donors). h, Clonal lineage of a BGC cell from an NP swab, represented as a phylogenic tree. Each tip of the tree represents a unique heavy chain (HC) sequence determined by its transcriptomic profile; coloured by heavy chain constant region gene (isotype). Grey dotted lines indicate intervals of five estimated heavy chain nucleotide mutations. Panel e was created in part using BioRender (https://Biorender.com).
Fig. 3 |
Fig. 3 |. Nasal cavity and nasopharynx mucosa possess distinct adaptive immune cell populations.
a, Parts of a whole graph demonstrating average percentages of principal immune cell populations in MT versus NP swabs (n = 38 donors). Error bars, s.e.m. bn, Differences in immune cell frequencies, ratios and subsets in MT versus NP swabs by flow cytometry (n = 88 NP and 55 MT swabs; 38 donors); see Extended Data Fig. 4a for gating strategy: percentage of total CD19+ B cells and CD3+ T cells (of live CD45+) (b,c); ratio of B cells to T cells (b:c) (d); percentage of CD4+ (e) and CD8+ T cells (f); ratio of CD4+ to CD8+ T cells (e:f) (g); percentage of BGC cells (h), Bmem cells (CD20+CD38IgD) (i) and BRM cells (CD20+CD69+) (k) of total B cells; percentage GC-TFH cells of total T cells (j); percentage CD4+ TRM cells of non-naive CD4+ T cells (l); percentage CD49a+ of CD69+CD103+CD8+ TRM cells (m); percentage of antibody-secreting cells (CD20CD38hi) of total B cells (n). oq, Differences in B cell isotype profiles in MT and NP swabs and PBMCs (frequency of IgA+ (o), IgG+ (p) and IgM+ (q)), n = 58 NP and 46 MT swab, 56 PBMC samples; 22 donors. rt, Differences in isotype profiles of NP Bmem cells versus BGC cells (IgA+ (r), IgG+ (s) and IgM+ (t)), n = 58 NP swabs; 22 donors. Bars in bt, median (pairwise comparisons by Mann–Whitney test); *P ≤ 0.05, **P ≤ 0.01, ***P ≤ 0.001, ****P ≤ 0.0001. u, Volcano plot summarizing significant differences in NP versus MT populations. v, Correlation between number of BGC cells sampled per NP swab and age across healthy adults; Pearson r and P values (n = 117 donors; one swab per donor). w, Correlation between number of BGC cells and GC-TFH cells sampled per NP swab (n = 80 donors; one swab per donor); Pearson r and P values.
Fig. 4 |
Fig. 4 |. SARS2-specific upper airway mucosal B cells.
a,b, Frequencies of SARS2 nucleocapsid (N)-, RBD-, and spike-specific IgA+ (a) and IgG+ Bmem cells (b) in NP and MT swabs and PBMCs. Bars, median. Pairwise comparisons by Mann–Whitney; *P ≤ 0.05, **P ≤ 0.01, ***P ≤ 0.001, ****P ≤ 0.0001. c, Longitudinal probe staining of SARS2 nucleocapsid-, RBD- and spike-specific NP Bmem cells by flow cytometry (for gating strategy, see Extended Data Fig. 6a; n = 29–47 donors). Grey lines, data for individual donors. Dotted line, limit of detection. d, Seurat UMAP, 9,462 NP B cells from breakthrough donors 4202, 4809 and 4379 (one NP swab per donor) coloured by B cell subsets. e, Expression of genes of interest for cells in d. f,g, SHM (f) and class-switch recombination (CSR) (g) (isotype) analysis of cells in d. h, SARS2 RBD-, spike- and nucleocapsid-specific B cells overlaid on UMAP from d. i, Phenotypes of SARS2-specific B cells. Two cells that were class switched (IgG1, IgA1) with moderate-to-high SHM were reclassified from naive to class switched resting Bmem cells (Resting BCSR). j, Isotypes (left) and heavy chain (HC) SHM (right) for early and late BPC. k, SARS2 RBD-, spike-specific BPC. l, Phylogenic trees representing Omicron-specific B cell clonal lineages from donor 4809. Tip sizes, number of cells with identical features; colours, cell type; labels, validated antibodies and KD by SPR; *KD for BA.4/5 spike. m, Summary of ELISA, PSV neutralization and SPR data for ancestral (D614G), Omicron BA.4/5 spike, RBD for antibodies in l. B, binding of ancestral and Omicron; O, Omicron-specific. Grey, undetectable binding/neutralization. n, Comparison of heavy chain mutations for donor 4809 RBD- and nucleocapsid-specific BGC. Student’s t-test, ****P ≤ 0.0001.

References

    1. Sette A & Crotty S Immunological memory to SARS-CoV-2 infection and COVID-19 vaccines. Immunol. Rev. 310, 27–46 (2022). - PMC - PubMed
    1. Allie SR & Randall TD Resident memory B cells. Viral Immunol. 33, 282–293 (2020). - PMC - PubMed
    1. Topol EJ & Iwasaki A Operation nasal vaccine-lightning speed to counter COVID-19. Sci. Immunol. 7, eadd9947 (2022). - PubMed
    1. Zheng MZM & Wakim LM Tissue resident memory T cells in the respiratory tract. Mucosal Immunol. 15, 379–388 (2022). - PMC - PubMed
    1. Poon MML et al. Tissue adaptation and clonal segregation of human memory T cells in barrier sites. Nat. Immunol. 24, 309–319 (2023). - PMC - PubMed

MeSH terms

Substances