. 2024 Aug;632(8027):1174-1180.
doi: 10.1038/s41586-024-07774-6. Epub 2024 Jul 31.

Structural switch in acetylcholine receptors in developing muscle

Affiliations

Structural switch in acetylcholine receptors in developing muscle

Huanhuan Li et al. Nature. 2024 Aug.

Abstract

During development, motor neurons originating in the brainstem and spinal cord form elaborate synapses with skeletal muscle fibres1. These neurons release acetylcholine (ACh), which binds to nicotinic ACh receptors (AChRs) on the muscle, initiating contraction. Two types of AChR are present in developing muscle cells, and their differential expression serves as a hallmark of neuromuscular synapse maturation2-4. The structural principles underlying the switch from fetal to adult muscle receptors are unknown. Here, we present high-resolution structures of both fetal and adult muscle nicotinic AChRs, isolated from bovine skeletal muscle in developmental transition. These structures, obtained in the absence and presence of ACh, provide a structural context for understanding how fetal versus adult receptor isoforms are tuned for synapse development versus the all-or-none signalling required for high-fidelity skeletal muscle contraction. We find that ACh affinity differences are driven by binding site access, channel conductance is tuned by widespread surface electrostatics and open duration changes result from intrasubunit interactions and structural flexibility. The structures further reveal pathogenic mechanisms underlying congenital myasthenic syndromes.


Conflict of interest statement

Competing interests

The authors declare no competing interests.

Figures
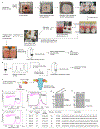
Extended Data Figure 1:
Extended Data Figure 1:. Isolation and identification of ACh receptors from bovine skeletal muscle.
a, Overview of methods for isolation of AChRs from one kg bovine muscle tissue. b, A method for preparation of ACh-bound receptors. c, Schematic of the fluorescently-labeled α-bungarotoxin detection assay. d, e, Identification of receptor from both hard pellet (d) and soft membrane pellet (e) using the fluorescently-labeled α-bungarotoxin detection assay. f, A final sample reveals strong tryptophan and α-bungarotoxin FSEC peaks. For df, chromatograms were obtained using a Sepax SRT SEC-500 column on a Shimadzu HPLC, flow rate of 0.35 mL/min. g, h, SDS-PAGE gels of purified bovine receptor bound with either short chain toxin (g) or ACh (h); for gel source data, see Supplementary Figure 1. This gel is representative of two gels run on independently purified receptors. i, Mass spectrometry identification of bovine receptor subunits.
Extended Data Figure 2:
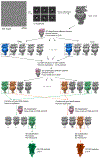
Extended Data Figure 2:. Cryo-EM data processing of toxin-bound receptors.
All steps were carried out in Cryosparc v4 (see Methods for details).
Extended Data Figure 3:
Extended Data Figure 3:. Map quality enables subunit assignment.
a, b, Different map features of γ (a) and ε (b) subunits. Three types of structural features help to clearly distinguish the fetal and adult receptors and likely enabled facile classification of particles in cryo-EM data processing. First, glycosylation patterns are distinct. The γ subunit is glycosylated at Asn52 (γN52-glycan) located in the extracellular domain (ECD) β-sheet region (β5), while the ε is glycosylated at Asn86 (εN86-glycan) in a short loop adjacent to the N-terminus of the η2 helix on the apex of the ECD. Second, the C-termini of the γ and ε subunits differ in both length and conformation. The C-terminal extension in γ is larger and stabilized mainly by hydrophobic interactions with the ECD (c), while the C-terminus of the ε subunit is short, and stabilized by a disulfide bond (d). Third, there are amino acid differences in the initial N-terminal helix of each subunit, for example the fetal isoform has a glycine (γG31), and the adult has a histidine residue (εH29) at the corresponding position. To show glycosylation density clearly here, the threshold for the glycosylation map regions is lower than for the protein residues.
Extended Data Figure 4:
Extended Data Figure 4:. Cryo-EM data processing of ACh-bound receptors.
All steps were carried out in Cryosparc v4 (see Methods for details).
Extended Data Figure 5:
Extended Data Figure 5:. Cryo-EM FSC plots, local resolution, and angular distribution.
ac, Masked FSC curve, local resolution, and angular distribution of particles for fetal ACh receptor + toxin. df, as ac but for adult ACh receptor + toxin. gI, As ac but for fetal ACh receptor + ACh. jl, As ac but for adult ACh receptor + ACh.
Extended Data Figure 6:
Extended Data Figure 6:. Structures of fetal and adult ACh receptors in different states.
ad, Structures of fetal and adult receptors bound to either toxin or ACh; top and side views. e, αε interface labeled as an example to indicate domains, helices, glycans, and ACh binding pocket. fj, ECD of each subunit to show the glycans. ko, Different C-terminus from each subunit. p, Toxin densities in the αε and αδ interfaces. Density is shown for three residues on the tip of the toxin molecules inserting into the ACh binding pocket to illustrate confidence in interpreting interactions. q, r, Representative lipid densities in the TMD region. q, A phospholipid binds to the bottom of the TMD in the adult resting-like structure. The surrounding residues around the phospholipid are shown as sticks in the β-α interface. r, A phospholipid binds to the top of the TMD in the adult resting-like structure. The surrounding residues around the phospholipid are shown as sticks in the α-δ interface.
Extended Data Figure 7:
Extended Data Figure 7:. Structural basis of ACh sensitivity and conductance.
a, b, Close-up views of fetal αγ (a) and adult αε (b) ACh binding pockets. Residues are shown as sticks and waters as cyan spheres. The αγ interface has two extra interactions, a disulfide bond and a hydrogen bond, compared to αε. c, d, Sequence alignments of the residues involved in these interactions. e, f, Accessible area and volume of ACh binding pocket in fetal and adult interfaces calculated using the program CASTp (http://sts.bioe.uic.edu/castp). The accessible volumes are shown as semi-transparent red chambers. g, h, Structures of fetal ECD (g) and ICD (h) show the non-negatively charged residues; γQ35, γN38, γT105, γY127 in ECD and γQ456, γT458, γS462, γG463 in ICD. i, j, Structures of adult ECD (i) and ICD (j) show the negatively charged residues at the corresponding positions of fetal receptor; εD33, εD36, εE103, εE125 in ECD and εD436, εE438, εE442, εE443 in ICD. k, l, Electrostatic potential of ICD outer surfaces of fetal (k) and adult (l) receptors reveal differences from MA helices; red, negative; blue, positive. m, n, ICD structures of fetal muscle receptor (m) and 5-HT3A receptor (n, PDB 6BE1) show that both have several positively charged resides in their MA helices; in the fetal receptor, γR452, γR454, γH459, and γK465 have been replaced by εS432, εT434, εA439, and εS445 in adult. o, p, Single subunit structure of the α7 nicotinic ACh receptor (o) and 5-HT3A receptor, (p) in both resting and activated states show that the M4-MA junctions are disrupted during channel opening. q, Sequence alignments of MA helices of bovine and human muscle isoforms reveal differently charged residues; negative, red; positive, blue.
Extended Data Figure 8:
Extended Data Figure 8:. Electrophysiology analysis of gating residues and congenital myasthenic syndrome sites in the ε subunit.
a, Representative whole cell patch-clamp electrophysiology recordings from the adult wild type AChR and mutants. b, c, Representative single channel cluster duration histograms fitted by a sum of exponentials for adult wild type (b) and βF6′S mutant (c) AChRs; fitted curves for each component (dashed lines) and their sum (bold lines, the peak is indicated by a black line) are displayed; n ≥ 5 cells for each recording. d, Representative single channel recordings from βL9′S and βF6′S/L9′S mutants. eh, As in b, c, but for fetal wild type (e, n = 3), γT316A mutant (f, n = 3), γG461E mutant (g, n = 4) and γG461A mutant (h, n = 3). The γT316A mutant subtly shortens the longer duration component of opening and the γG461E mutant slightly reduces the frequency of the longer duration component of opening while the γG461A mutant decreases the channel open time. i, Coupling region of ε subunit showing a site of two mutations causing fast channel CMS in patients. εE204 and εR238 form an electrostatic interaction network with εE65 on the β1β2-loop and εD158 on the Cys-loop, which couple ACh binding to channel opening. Both εE204K and εR238W mutations would destabilize this network and thereby diminish coupling efficiency, which would slow the rate of channel opening, leading to fast-channel syndrome. j, k, Slow channel mutant examples at the TMD interface (top view) of α and ε subunits. εL289 (j) and εV279 (k) on M2 nestle into a pocket formed by several hydrophobic residues at the α-ε TMD interface. εL289F and εV279F mutations would result in clashes with nearby residues in the observed resting-like conformation, which could thereby destabilize the resting state in favor of a longer-lived activated state, consistent with the slow-channel CMS phenotype,. l, Examples of point mutants that cause receptor deficiency CMS, shown as yellow spheres.
Extended Data Figure 9:
Extended Data Figure 9:. State transition and gates in fetal AChR.
a, Comparison of fetal resting-like (light grey) and desensitized (colored) state structures reveals ECD conformational changes upon ACh binding. b, c, Conformational changes in the coupling region (b) and the TMD regions (c) triggered by ACh binding; colors as in a. d, Close-up top view of L9′ and F6′ changes in different fetal receptor states; colors as in a. e, Permeation pathway in the resting-like state pore region; red dots indicate pore diameters less than 2.2 Å. f, As in e, but for the fetal desensitized state; red dots here indicate < 4.1 Å. g, Pore profiles of fetal resting-like and desensitized structures. h, i, Sequence alignments of 6′ and 9′ at M2 helices among Cys-loop family receptors; h, among different species; i, in humans. j, k, Structural comparisons of fetal and adult receptors at different state reveal high similarity. l, m, Structures and conformations of the 6′ and 9′ residues in M2 helices in the apo (l) and open (m) heteromeric glycine receptors.
Figure 1:
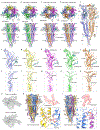
Figure 1:. NMJ and AChR structures in fetal and adult stages of development.
a, b, Cartoons of immature (a) and mature (b) NMJ synapses illustrating differences in biophysical properties of fetal and adult AChRs, including ACh sensitivity and ion conductance. c, d, Cryo-EM maps of fetal AChRs bound to neurotoxin in a resting-like state (c) and ACh in a desensitized state (d), top and side views. e, f, Cryo-EM maps of adult AChRs bound to neurotoxin in a resting-like state (e) and ACh in a desensitized state (f), top and side views. Unique glycosylation for γ subunit (γN52-glycan) and ε subunit (εN86-glycan) assignment is indicated as cyan colored densities.
Figure 2:
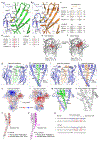
Figure 2:. Structural basis of ACh sensitivity.
a, b, Cryo-EM densities highlight the fetal αγ (a) and adult αε (b) interfaces for ACh binding; top views. The ACh density in each interface is shown in the upper-left corners. c, d, Cartoon structures of αγ (c) and αε (d) ACh binding pockets. ACh molecules are shown as yellow sticks. Interacting protein residues are shown as sticks and the interacting water molecules are shown as cyan spheres. e, f, Surface representations of αγ and αε interfaces reveal different compactness of ACh binding pockets. The accessible pocket volume is 91.8 Å3 in the fetal αγ interface, and 201.2 Å3 in the adult αε interface; also see Extended Data Figure 7e and 7f.
Figure 3:
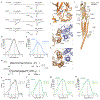
Figure 3:. Electrostatics endow the adult receptor with high conductance.
a, Side view of adult receptor with β subunit removed shows the ion permeation pathway (yellow dashed lines with arrows) that determines channel conductance. be, Electrostatic potential of ECD (b, c) and ICD (d, e) inner surfaces of fetal and adult receptors reveal different charge properties. Red, negative; blue, positive. f, Sequence alignment of γ and ε subunits. g, Superposition of the pore regions of fetal and adult structures reveals the K/Q at M2 20′ influences cation flux. h, Structural comparison reveals the residue differences on M2 helices. γV18′ and εI18′ insert into a pocket surrounded by hydrophobic residues. Corresponding residues in g and h are shown as sticks. i, Representative single-channel recordings from adult wild type and εE/K mutant (εD436K/εE438K/εE442K/εE443K) at different voltages. O, open; C, closed. j, Single channel conductance statistics for wild type (n = 5 independent cells, 53.28 ± 1.52 pS) and εE/K mutant (n = 7, 42.27 ± 2.14 pS). Error bars denote the mean ± s.e.m.; Welch’s t-test was used.
Figure 4:
Figure 4:. State transitions and gates in adult AChR.
a, Comparison of adult resting-like (light grey) and desensitized (colored) state structures reveals ECD conformational changes upon ACh binding. Toxin removed for clarity. b, c, Conformational changes in the coupling region (b) and the TMD regions (c) induced by ACh binding; colors as in a. d, Close-up top view of L9′ and F6′ orientations in different states; protein residues are shown as sticks; colors as in a. e, Permeation pathway in the resting-like state pore region; red dots indicate pore diameters less than 2.3 Å. f, As in e, but for the adult desensitized state; red dots here indicate pore diameters less than 4.1 Å. Pore lining residues in e and f are shown as sticks except βG2′, shown as a sphere. g, Pore profile of adult resting-like and desensitized structures. h, Comparison of whole cell patch clamp electrophysiology of adult wild type and mutants. i, Apparent desensitization rates (τ) of adult wild type (n = 5 independent cells, 0.40 ± 0.08 s), βF6′S (n = 6, 0.24 ± 0.02 s), βL9′S (n = 6, 1.84 ± 0.13 s), βF6′S/L9′S (n = 10, 0.87 ± 0.07 s) mutants. Welch’s analysis of variance (ANOVA) with Dunnett’s multiple comparisons test was used. Mean ± s.e.m.; boxes indicate the 25th to 75th percentiles, whiskers indicate the minimum and maximum values, and the central line shows the median; all data points are shown. j, Representative single-channel recordings from adult wild type and βF6′S mutant. O, open; C, closed.
Figure 5:
Figure 5:. Channel open time.
a, Structural comparison of fetal and adult TMD and ICD regions. b, c, Close-up views of different interactions in fetal and adult TMD regions. Interacting residues are shown as sticks. d, Representative single-channel recordings from fetal wild type, γT316A and γG461A mutants. O, open; C, closed. e, f, Close-up views of two key residues from the M4 helices and their interactions.
Figure 6:
Figure 6:. Structural context for congenital myasthenic syndromes.
a, CMS mutations mapped on adult ε subunit; blue, cyan, and yellow spheres indicate fast-, slow-channel, and receptor deficiency mutations respectively. For additional deficiency mutations also see Extended Data Figure 8j. b, Interaction between loops C and F in the desensitized state. ACh is shown as yellow sticks. c, εV285 at 13′ of εM2 forms a ring with four other valines to influence ion permeation. Gray arrow represents permeation pathway. d, The ε C-terminus forms a disulfide bond with the ECD. Corresponding residues in panel b, c, and d are shown as sticks. e, Sequence alignment indicates a conserved disulfide bond in the ε C-terminus among mammalian muscle receptors.

References

    1. Sanes JR & Lichtman JW DEVELOPMENT OF THE VERTEBRATE NEUROMUSCULAR JUNCTION. Annual Review of Neuroscience 22, 389–442 (1999). 10.1146/annurev.neuro.22.1.389 - DOI - PubMed
    1. Missias AC, Chu GC, Klocke BJ, Sanes JR & Merlie JP Maturation of the Acetylcholine Receptor in Skeletal Muscle: Regulation of the AChR γ-to-ϵ Switch. Developmental Biology 179, 223–238 (1996). 10.1006/dbio.1996.0253 - DOI - PubMed
    1. Mishina M et al. Molecular distinction between fetal and adult forms of muscle acetylcholine receptor. Nature 321, 406–411 (1986). 10.1038/321406a0 - DOI - PubMed
    1. Sakmann B & Brenner HR Change in synaptic channel gating during neuromuscular development. Nature 276, 401–402 (1978). 10.1038/276401a0 - DOI - PubMed
    1. Hesselmans LFGM, Jennekens FGI, Van Den Oord CJM, Veldman H & Vincent A Development of innervation of skeletal muscle fibers in man: Relation to acetylcholine receptors. The Anatomical Record 236, 553–562 (1993). 10.1002/ar.1092360315 - DOI - PubMed

Methods references

    1. de la Rosa G, Corrales-García LL, Rodriguez-Ruiz X, López-Vera E & Corzo G Short-chain consensus alpha-neurotoxin: a synthetic 60-mer peptide with generic traits and enhanced immunogenic properties. Amino Acids 50, 885–895 (2018). 10.1007/s00726-018-2556-0 - DOI - PubMed
    1. Punjani A, Rubinstein JL, Fleet DJ & Brubaker MA cryoSPARC: algorithms for rapid unsupervised cryo-EM structure determination. Nature Methods 14, 290–296 (2017). 10.1038/nmeth.4169 - DOI - PubMed
    1. Punjani A, Zhang H & Fleet DJ Non-uniform refinement: adaptive regularization improves single-particle cryo-EM reconstruction. Nature Methods 17, 1214–1221 (2020). 10.1038/s41592-020-00990-8 - DOI - PubMed
    1. Sanchez-Garcia R et al. DeepEMhancer: a deep learning solution for cryo-EM volume post-processing. Communications Biology 4, 874 (2021). 10.1038/s42003-021-02399-1 - DOI - PMC - PubMed
    1. Kimanius D, Dong L, Sharov G, Nakane T & Scheres SHW New tools for automated cryo-EM single-particle analysis in RELION-4.0. Biochemical Journal 478, 4169–4185 (2021). 10.1042/BCJ20210708 - DOI - PMC - PubMed

MeSH terms

LinkOut - more resources