. 2024 Aug;25(8):3707-3737.
doi: 10.1038/s44319-024-00198-3. Epub 2024 Jul 31.

The DNA repair protein DNA-PKcs modulates synaptic plasticity via PSD-95 phosphorylation and stability

Affiliations

The DNA repair protein DNA-PKcs modulates synaptic plasticity via PSD-95 phosphorylation and stability

Cristiana Mollinari et al. EMBO Rep. 2024 Aug.

Abstract

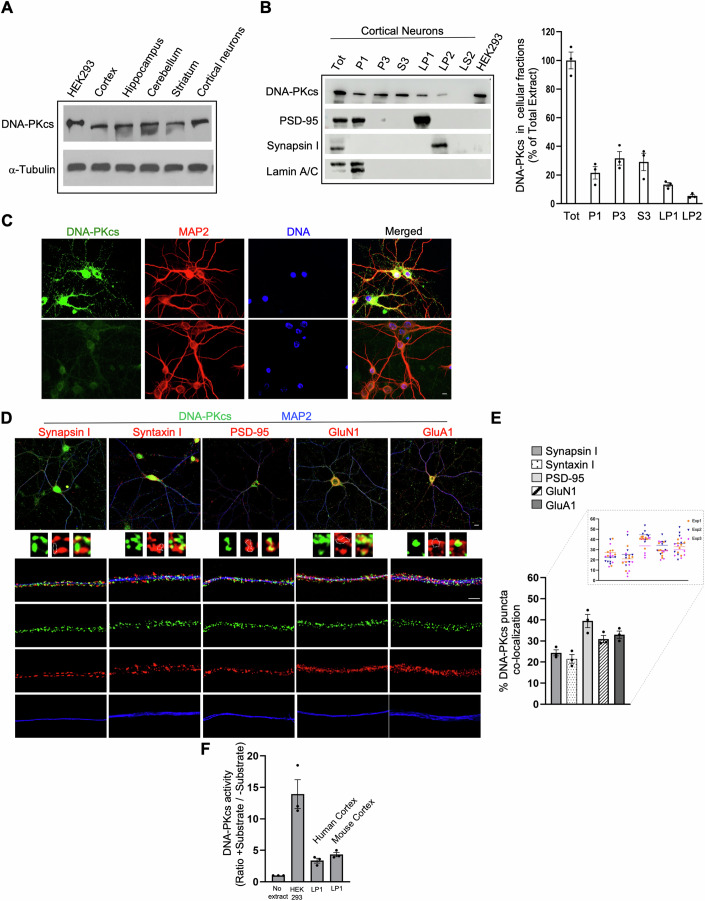
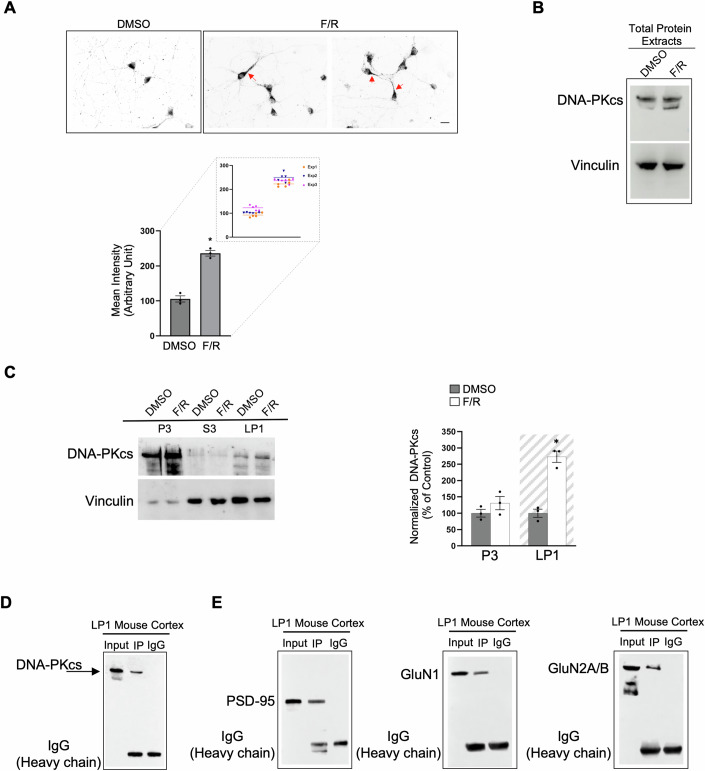
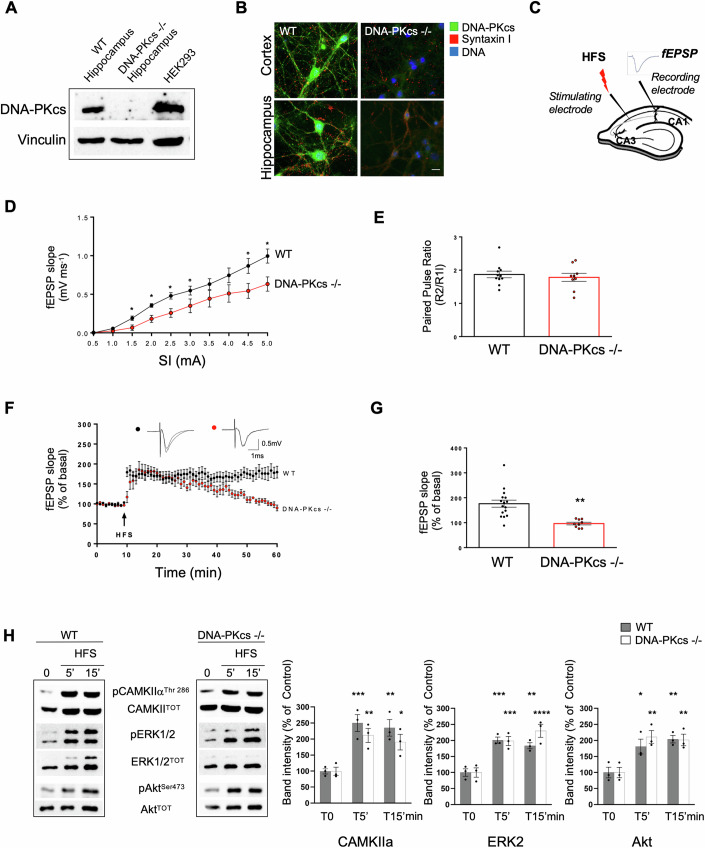
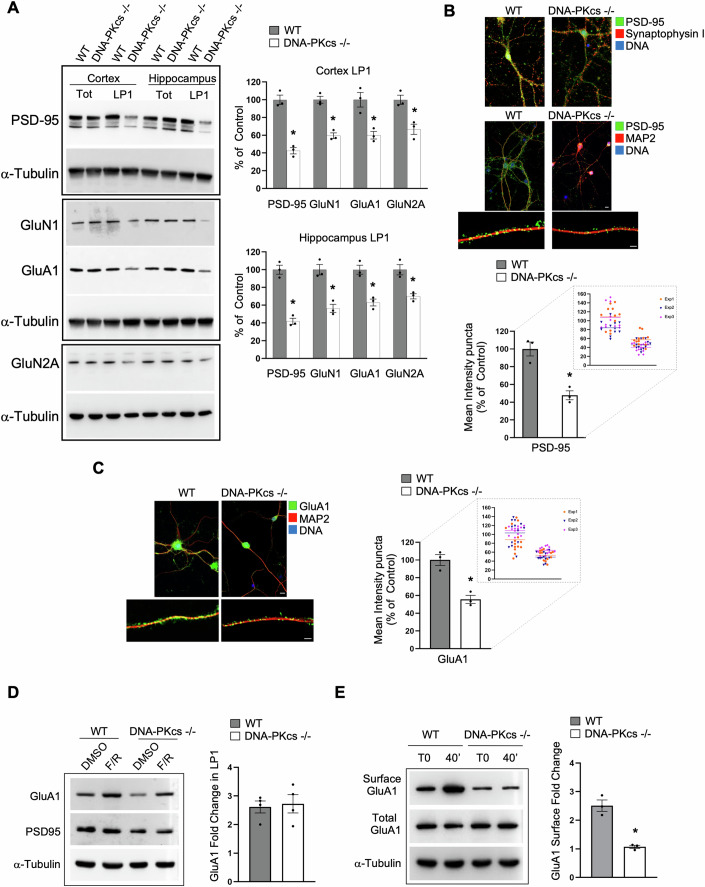
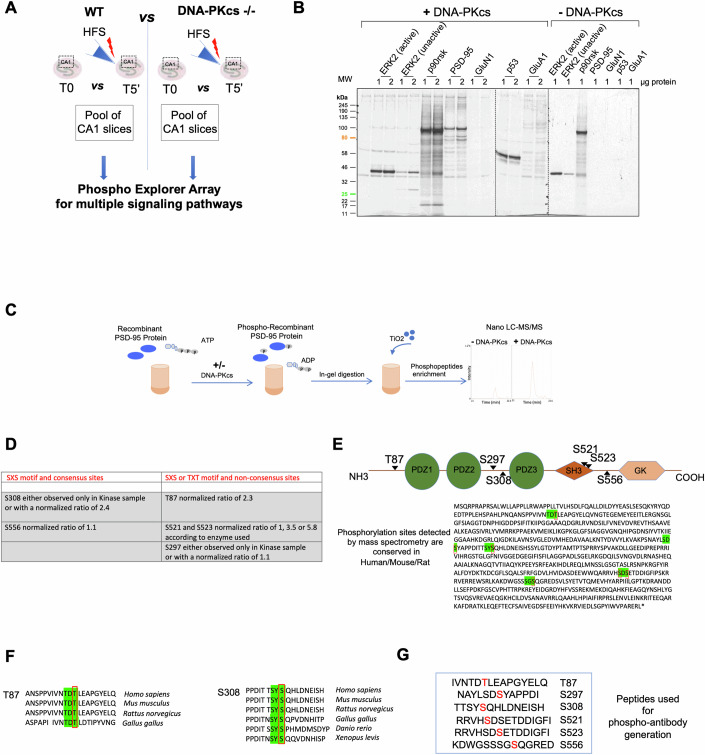
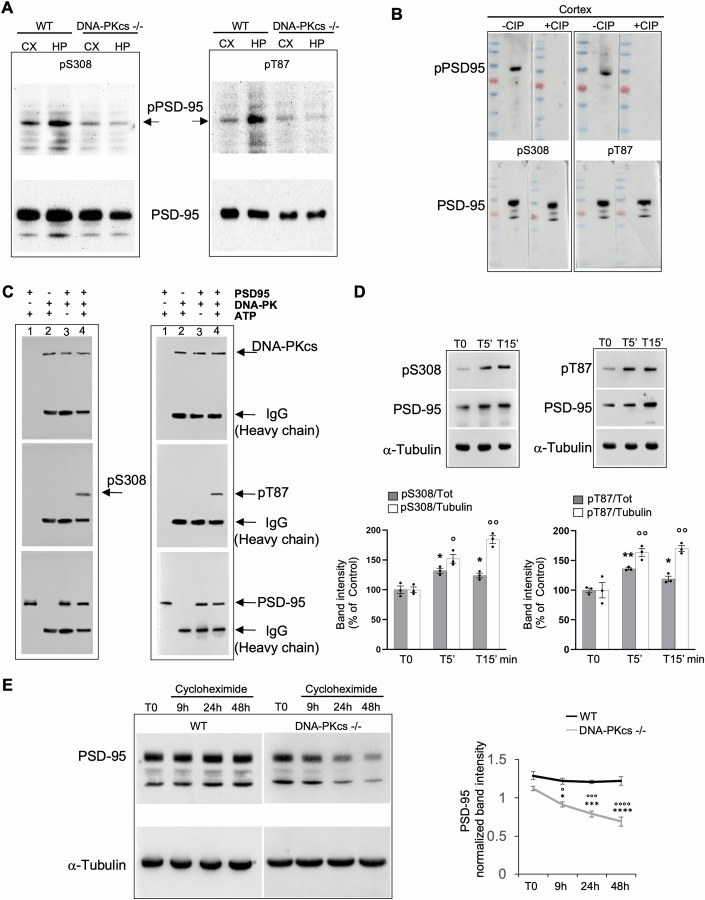
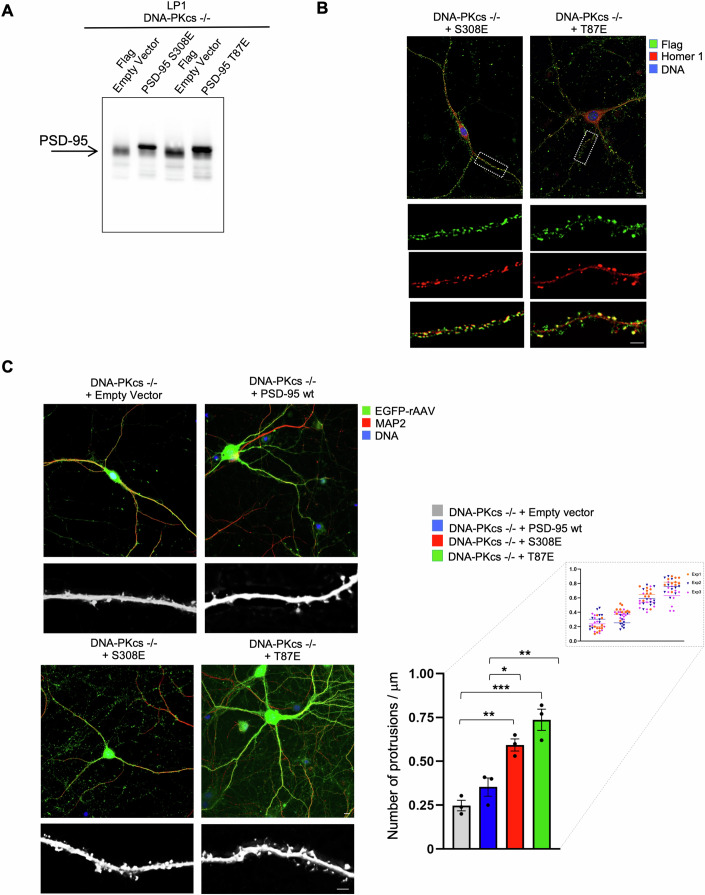
The key DNA repair enzyme DNA-PKcs has several and important cellular functions. Loss of DNA-PKcs activity in mice has revealed essential roles in immune and nervous systems. In humans, DNA-PKcs is a critical factor for brain development and function since mutation of the prkdc gene causes severe neurological deficits such as microcephaly and seizures, predicting yet unknown roles of DNA-PKcs in neurons. Here we show that DNA-PKcs modulates synaptic plasticity. We demonstrate that DNA-PKcs localizes at synapses and phosphorylates PSD-95 at newly identified residues controlling PSD-95 protein stability. DNA-PKcs -/- mice are characterized by impaired Long-Term Potentiation (LTP), changes in neuronal morphology, and reduced levels of postsynaptic proteins. A PSD-95 mutant that is constitutively phosphorylated rescues LTP impairment when over-expressed in DNA-PKcs -/- mice. Our study identifies an emergent physiological function of DNA-PKcs in regulating neuronal plasticity, beyond genome stability.

Keywords: Cognitive Function; DNA Repair; DNA-PKcs; PSD-95 Phosphorylation; Synaptic Plasticity.


Conflict of interest statement

The authors declare no competing interests.

Figures

Figure 1
Figure 1. DNA-PKcs is localized in synaptosomal membranes where it exerts kinase activity.
(A) Representative Western Blot analysis showing the expression of DNA-PKcs protein in different mouse brain regions at similar levels and in mouse primary cortical neurons. HEK293 cells were used as positive control. α-Tubulin was used as a loading control. (B) Western Blots representing the biochemical fractionation of mouse cortical neurons (DIV 21) showing the synaptic localization (LP1) of DNA-PKcs. Equal amounts of protein (70 μg) were loaded for each fraction (n = 3 independent experiments). Fractions were loaded on the gel and the specificity of the fractionation procedure was confirmed by using specific markers for subcellular compartments: Lamin A/C for the nuclear fraction (P1), PSD-95 for the synaptosomal membrane fraction (LP1) and Synapsin I for the synaptic vesicle fraction (LP2). Histogram data represent the percentage with respect to a total protein extract of DNA-PKcs in the different cellular fractions. Results are expressed as mean ± SEM. (C) Representative confocal fluorescence images of mouse primary cortical neurons (DIV 21) labeled with the anti-DNA-PKcs antibody (green channel), the neuronal marker MAP2 (red channel), and DNA dye (blue, DAPI). DNA-PKcs is strongly expressed in neurons and is distributed both in the cell soma and dendrites. DNA-PKcs antibody specificity is confirmed by the absence of immunofluorescence when the antibody is preincubated with an excess of recombinant DNA-PKcs protein (lower panel). Scale Bar 5 μm. (D) Representative triple immunofluorescence THUNDER images of mouse primary cortical neurons (DIV 21) showing the distribution of DNA-PKcs (green channel) similar to synaptic proteins such as Synapsin I, Syntaxin I, PSD-95, GluN1, and GluA1 (red channel). Scale Bar 5 μm. Images of neurites from a single neuron show the punctate co-localization of DNA-PKcs with pre- and postsynaptic proteins. Single-channel images are provided to better evaluate the localization of each protein. Insets represent enlargements of a dendritic tract showing DNA-PKcs co-localization with pre- and postsynaptic proteins. White dotted edges in the red channels highlight the position of DNA-PKcs protein with respect to synaptic proteins. Scale Bar 2 μm. (E) Histogram data represent the percentage of DNA-PKcs puncta co-localization with the different synaptic proteins analyzed. Results are expressed as mean ± SEM; n = 3 independent experiments. Data distribution is shown in the enlargement; n = 21 neurons/each synaptic marker. (F) DNA-PKcs kinase activity assay performed using human and mouse cortical membrane fractions. Protein extracts from HEK293 cells (200 μg), LP1 human cortex fraction (200 μg), and mouse LP1 fraction (1 mg) were subject to DNA-PKcs immunoprecipitation and the phosphorylation assay was performed. The assay performed without protein extract was used as a negative control. Data were expressed as ratio of values in presence/absence of the DNA-PKcs substrate p53 (presented as mean values ± SEM of kinase activity; n = 3 independent experiments). P1, nuclei and large debris; S3, cytosolic fraction; P3, light membrane fraction; LP1, synaptosomal membrane fraction; LP2, synaptic vesicle-enriched fraction; LS2, supernatant from LP2; IP, immunoprecipitated. Source data are available online for this figure.
Figure 2
Figure 2. DNA-PKcs increases in synaptosomal membrane fraction following synaptic stimuli and is associated with postsynaptic proteins.
(A) Immunofluorescence images of mouse primary cortical neurons (DIV 9), labeled with an anti-DNA-PKcs antibody, unstimulated (DMSO), or after chemical LTP induced by forskolin/rolipram stimulation (F/R). F/R treatment induces an increase of DNA-PKcs protein levels in neurites proximal to the cell body (red arrows). Histogram data represent the mean intensity of DNA-PKcs immunolabelling in DMSO and F/R treated cells. Bars in the plots represent means ± SEM (n = 3 independent experiments, *p < 0.05 Statistics by Student’s t-test). Data distribution is shown in the enlargement; n = 15 neurons/each treatment. Scale Bar 5 μm. (B) Western Blot showing no increase of DNA-PKcs in total protein extract from primary cortical neurons after F/R stimulation. Vinculin was used as a loading control. (C) Representative Western Blot showing the biochemical fractionation of mouse primary cortical neurons (DIV 9) unstimulated (DMSO) or after F/R treatment. Following F/R stimulation, DNA-PKcs is enriched in the synaptosomal membrane fraction (LP1). Vinculin was used as a loading control. Histogram data represent the percent change in DNA-PKcs band intensity in P3 and LP1 (gray background) fractions in F/R stimulated cells with respect to DMSO-treated cultures. Statistics by Student’s t-test (unpaired, two-tailed) for F/R vs DMSO in P3 fraction (p = 0.241; n = 3 independent experiments) and for F/R vs DMSO in LP1 fraction (*p < 0.05; n = 3 independent experiments). Bars in the plots represent means ± SEM. (D) Immunoprecipitation of DNA-PKcs from LP1 (500 μg) mouse cortex. Western Blot analysis using the anti-DNA-PKcs antibody shows the full-length protein in the Input and IP lanes. IgG control antibody isotype is also shown (n = 3 independent experiments). (E) Immunoprecipitation of DNA-PKcs from LP1 mouse cortex. Western Blot analysis using anti-PSD-95, anti-GluN1, and anti-GluN2A/B antibodies indicates that DNA-PKcs pulls down the three postsynaptic proteins (IP lanes). IgG were loaded as non-specific antibody IP control (n = 3 independent experiments). Source data are available online for this figure.
Figure 3
Figure 3. DNA-PKcs −/− mice show impaired basal synaptic transmission and long-term potentiation with normal signaling pathways.
(A) Western Blot showing that DNA-PKcs is undetectable in the hippocampus of DNA-PKcs −/− mice. HEK293 cells were used as positive control. Vinculin was used as a loading control. (n = 3 mice). (B) Triple immunofluorescence images of cortical and hippocampal neurons (DIV 21) showing the lack of DNA-PKcs labeling in mutant mice confirming the specificity of the anti-DNA-PKcs antibody. Scale Bar 5 μm. (n = 3 cultures). (C) Schematic representation of hippocampal slice showing stimulating and recording electrode positions. (D) Input-output (I/O) curve of fEPSP slope (mV/ms) versus stimulus (mA) at the Schaffer collaterals-CA1 pyramidal cell synapse in WT and DNA-PKcs −/− mice. Each point on the I/O curve was obtained by averaging responses over 2–5 min of recording and progressively increasing the stimulus strength. A reduction in I/O ratio is shown in DNA-PKcs −/− (n = 10) with respect to WT (n = 12) mice (*p < 0.01 and °p < 0.05; Mann–Whitney U-test). Error bars indicate SEM. (E) Comparable paired-pulse stimulation ratio (PPR) in WT (n = 11) and DNA-PKcs −/− (n = 9) mice (p = 0.351; Mann–Whitney U-test). Error bars indicate SEM. (F) DNA-PKcs −/− slices show an impairment in LTP. Time courses of fEPSP slope after HFS; data are expressed as mean ± SEM of n = 16 (WT) and n = 9 (DNA-PKcs −/−) slices (one slice tested per experiment). Slices were obtained from at least four mice for each experimental set. Insets show fEPSP recorded in basal condition and 60 min after HFS. (G) The graph summarizes the LTP magnitude in the two genotypes. LTP is expressed as the mean percentage variation of the slope from baseline (calculated in the time windows 5–10 min) and after HFS (calculated in the time windows 50–60 min). **p < 0.001 by Mann–Whitney U-test. Error bars indicate SEM. (H) Representative Western blots of phosphorylated and total forms of CaMKIIα, ERK1/2, and Akt at different times after delivery of HFS. Densitometric quantification of the immunoreactive bands indicates no significant differences in phosphorylation levels of these proteins between WT and DNA-PKcs −/− CA1 slices at the different time points analyzed (T5’ CaMKIIα: WT: 250 ± 26.5%, DNA-PKcs −/−: 211 ± 22%; p = 0.529; n = 3 mice; T15’ CaMKIIα: WT: 235 ± 26%, DNA-PKcs−/−: 190 ± 24.2%; p = 0.399; n = 3 mice; T5’ ERK2: WT: 201 ± 9.5%, DNA-PKcs−/−: 198 ± 14.1%; p = 0.998; n = 3 mice; T15’ ERK2: WT: 184 ± 9.5%, DNA-PKcs −/−: 230 ± 20.4%; p = 0.100; n = 3 mice; T5’ Akt: WT: 181 ± 23.1%, DNA-PKcs −/−: 211 ± 20%; p = 0.591; n = 3 mice; T15’: WT: 204 ± 12%, DNA-PKcs −/−: 201 ± 18%; p = 0.999; n = 3 mice). Values represent the percent changes in protein phosphorylation, normalized to the total protein, with respect to control (T0) for each time point. *p < 0.05 vs control values (T0), **p < 0.005 vs control values (T0), ***p < 0.001 vs control values (T0); ****p < 0.0001 vs control values (T0). Statistics by two-way ANOVA followed by Tukey’s post hoc analysis. Results are expressed as mean ± SEM; n = 3 independent experiments. HSF high-frequency stimulation, fEPSP field excitatory postsynaptic potential, PPF paired-pulse facilitation, LTP long-term potentiation. Source data are available online for this figure.
Figure 4
Figure 4. Reduced postsynaptic protein levels and delivery of GluA1 in synaptosomal membranes of DNA-PKcs −/− neurons.
(A) Western blots of total (Tot) and synaptosomal membrane extracts (LP1) from WT and DNA-PKcs −/− cortex and hippocampus demonstrating reduction of postsynaptic proteins specifically in LP1 fractions of mutant mice. Histogram data for the cortex and hippocampus represent the normalized percent change in protein band intensity in DNA-PKcs −/− mice with respect to WT (100%). (PSD-95 in LP1 from cortex: WT: 100 ± 5.2%, DNA-PKcs −/−: 42.5 ± 3.5%; *p < 0.05; GluN1 in LP1 from cortex: WT: 100 ± 3.9%, DNA-PKcs −/−: 59.5 ± 3.2%; *p < 0.05; GluA1 in LP1 from cortex: WT: 100 ± 8.2%, DNA-PKcs −/−: 60 ± 4.2%; *p < 0.05; GluN2A in LP1 from cortex: WT: 100 ± 5.1%, DNA-PKcs −/−: 66.7 ± 5.7%; *p < 0.05); (PSD-95 in LP1 from hippocampus: WT: 100 ± 5.1%, DNA-PKcs −/−: 41.8 ± 3.4%; *p < 0.05; GluN1 in LP1 from hippocampus: WT: 100 ± 5.8%, DNA-PKcs −/−: 56.4 ± 4.5%; *p < 0.05; GluA1 in LP1 from hippocampus: WT: 100 ± 5%, DNA-PKcs −/−: 63 ± 3.9%; *p < 0.05; GluN2A in LP1 from hippocampus: WT: 100 ± 5.8%, DNA-PKcs −/−: 70 ± 2.9%; *p < 0.05). α-Tubulin was used as a loading control. Results are expressed as mean ± SEM. Statistics by Student’s t-test (unpaired, two-tailed) (n = 3 mice). (B) Upper panel, fluorescence THUNDER images of cortical neurons (DIV 21) from WT and DNA-PKcs −/− mice, triple labeled with anti-PSD-95 antibody (green channel), Synaptophysin I (red) and DNA dye (blue, DAPI). Lower panel, triple fluorescence images of primary cortical neurons (DIV 21) from WT and DNA-PKcs −/− mice, labeled with anti-PSD-95 and anti-MAP2 (red channel) antibodies. Scale Bar 5 μm. High-magnification images of neurites confirm the reduction of PSD-95 staining in mutant neurons. Scale Bar 2 μm. Histogram data represent mean intensity ± SEM of fluorescence of PSD-95 labeling, plotted as a percentage of control and show a significant reduction of PSD-95 protein in mutant neurons. Statistics by Student’s t-test (unpaired, two-tailed) (n = 3 independent cultures, *p < 0.05). Data distribution is shown in the enlargement; WT n = 33 neurons, DNA-PKcs −/− n = 36 neurons. (C) Immunofluorescence THUNDER images of primary cortical neurons (DIV 21) from WT and DNA-PKcs −/− mice, labeled with anti-GluA1 (green channel), anti-MAP2 (red channel) antibodies and DNA dye (blue, DAPI). High-magnification images of neurites confirm the reduction of GluA1 staining in mutant neurons. Scale Bar 2 μm. Histogram data represent mean intensity ± SEM of fluorescence of GluA1 labeling, plotted as percentage of control, and show a significant reduction of GluA1 expression in DNA-PKcs −/− neurons. Statistics by Student’s t-test (unpaired, two-tailed) (n = 3 independent cultures, *p < 0.05). Scale Bar 5 μm. Data distribution is shown in the enlargement; WT n = 39 neurons, DNA-PKcs −/− n = 36 neurons. (D) Western blot analysis of synaptosomal membranes purified from WT and DNA-PKcs −/− neurons unstimulated (DMSO) or after F/R stimulation. Although synaptosomal membranes from DNA-PKcs −/− neurons have a lower expression of the GluA1 receptor subunit, after chemical stimulation, GluA1 incorporation in DNA-PKcs −/− synapses is as efficient as in WT. Band intensities, quantified and normalized by PSD-95, are expressed as fold change. α-Tubulin was used as a loading control. Error bars in histograms indicate SEM. Statistics by Student’s t-test (unpaired, two-tailed) (n = 4 independent experiments, p = 0.1579). (E) Representative Western blot analysis of surface and total levels of GluA1 (assessed using cell-surface biotinylation) on hippocampal slices at T0 or 40 min after HFS delivery in WT and DNA-PKcs −/− mice. The levels of surface GluA1 remain constant up to 40 min following HFS in DNA-PKcs −/− slices (1.07 ± 0.055 folds change; p = 0.3791) as compared with WT slices that show an increased level of surface GluA1 after HFS (2.51 ± 0.2 folds change; p < 0.01). The surface-to-total ratio was calculated and expressed as mean ± SEM. Statistics by Student’s t-test (unpaired, two-tailed) (n = 3 independent slices per each experimental group, *p < 0.05). Source data are available online for this figure.
Figure 5
Figure 5. The lack of DNA-PKcs affects neuronal morphology.
(A) Histogram representing the percentage of apoptotic nuclei (expressed as pyknotic/total ratio) in WT and DNA-PKcs −/− cultures, showing no differences in the two experimental groups. Results are expressed as mean ± SEM. Statistics by Student’s t-test (unpaired, two-tailed) (n = 3 different cultures; p = 0.4443). Data distribution is shown in the enlargement; WT n = 30 fields, DNA-PKcs −/− n = 30 fields. (B) Representative confocal fluorescence images of primary cortical neurons (DIV 9 and DIV 21) from WT and DNA-PKcs −/− mice labeled with anti-MAP2 (green channel) and DNA dye (propidium iodide, red channel) illustrating that, with the same number of cells, DNA-PKcs −/− neurons have a less complex network of neurites as compared with WT neurons. Scale Bar 5 μm. (C) Upper panel, representative tracing images (skeletons) of neurons from WT and DNA-PKcs −/− cultures. Lower panel, Sholl analysis performed on primary cortical neurons from WT and DNA-PKcs −/− mice confirms a reduced neurite complexity in DNA-PKcs −/− cultures as indicated by a significant reduction in the number of intersections in the range of 0–30 μm distance from the cell body. A sample of six neurons was taken for each group (n = 3 cultures). A number of intersections was counted in a 100-µm radius from the soma along the dendritic tree. Statistics by two-way ANOVA followed by Bonferroni post hoc analysis. Results are expressed as mean ± SEM. *p < 0.05; ***p < 0.001; ****p < 0.0001 DNA-PKcs −/− vs WT. (D) Quantification of neurite length shows no significative difference between WT and DNA-PKcs −/− neurons. p = 0.153 by Student’s t-test (unpaired, two-tailed). Data distribution is shown in the enlargement; WT n = 54 neurons, DNA-PKcs −/− n = 51 neurons. (E) Immunofluorescence images acquired with a THUNDER Imager microscope of EGFP-rAAV infected neurons (green channel) from WT and DNA-PKcs −/− cultures labeled with anti-MAP2 antibody (red channel) and DNA dye (DAPI, blue channel). WT neurons show a higher neurite complexity along with a higher density of more developed spines as compared with mutant cells. Scale Bar 5 μm. The black and white insets show a detail of neurites with spines. Scale Bar 2 μm. Quantification of the dendritic protrusions is expressed as number of spines per μm. DNA-PKcs −/− neurons show a reduced spine number that appears less frequent along neurites as compared with WT cells. Number of spines was calculated per 50 µm dendritic length. Error bars represent SEM. A minimum of 130 spines were counted from at least ten neurons/each group, repeated for three independent experiments (*p < 0.005, by Student’s t-test unpaired, two-tailed). Data distribution is shown in the enlargement; WT n = 30 neurons, DNA-PKcs −/− n = 30 neurons. Source data are available online for this figure.
Figure 6
Figure 6. Identification of novel residues in PSD-95 phosphorylated by DNA-PKcs.
(A) The scheme shows the approach used to perform the phospho explorer antibody array. Unstimulated (T0) and tetanized (T5’) CA1 dissected slices (n = 6 slices from three different mice) were pooled and protein extracts used to analyze phosphorylation changes after delivery of HFS in slices from WT and DNA-PKcs −/− mice. (B) Selected human purified recombinant proteins were used as a substrate for the in vitro DNA-PKcs kinase assay in presence or absence of the purified DNA-PKcs protein and specific incorporation of radioactive phosphate was detected by autoradiography. For each recombinant protein, two concentrations were loaded, double each other (20/40 μg/ml) (lanes 1 and 2). PSD-95 and p53 evoked specific radioactive incorporation since the corresponding band disappeared when the assay was performed in the absence of DNA-PKcs. (C) Scheme representing the in vitro kinase reaction using recombinant PSD-95 and DNA-PKcs proteins. After reaction and enzymatic digestion, phospho-peptides were enriched with TiO2 beads and analyzed by Nanoscale liquid chromatography coupled to tandem mass spectrometry. Extracted ion chromatogram of m/z 1016.8078Th (Threonine 87) in samples without kinase or with DNA-PKcs, enzymatically digested by GluC is shown on the right. (D) The table shows the newly identified residues in PSD-95 protein phosphorylated by DNA-PKcs and divided into a group that presents the DNA-PKcs kinase recognition motif SQ (two residues) and another group that does not (four residues). Phosphorylation fold increase by DNA-PKcs is also indicated in the table. (E) Upper panel, drawing of PSD-95 protein represented as modular protein containing different domains. The position of the six identified residues is indicated. Lower panel, protein sequence of human PSD-95 protein. The six identified residues phosphorylated by DNA-PKcs are highly conserved in mammals. The phosphorylated residues are boxed in red. The motifs SXS or TXT are highlighted in green. (F) Multiple alignments of short segments of PSD-95 protein show that T87 and S308, in particular, are conserved across species. (G) The peptides of human PSD-95 containing the phosphorylated residues were used to generate phospo-specific antibodies. The numbers in the peptides represent the amino acid position. Source data are available online for this figure.
Figure 7
Figure 7. Effect of PSD-95 phosphorylation at S308 and T87 on protein stability.
(A) Representative Western Blots of protein extracts from the cortex (n = 3) and hippocampus (n = 3) of WT or DNA-PKcs −/− mice probed with the anti-phospho-S308 (pS308) and anti-phospho-T87 (pT87). A single band at the expected molecular weight is recognized by the rabbit phospho-antibodies in WT brain extracts. No bands are detected in brain regions of mice lacking DNA-PKcs activity. PSD-95 was used as a loading control. (B) Nitrocellulose membranes were treated with or without calf intestinal alkaline phosphatase (CIP) and probed with the anti-pT87 and anti-pS308 antibodies. Antibodies specificity was confirmed by the disappearance of both S308 and T87 phosphorylated bands (+CIP lanes) but not of those corresponding to the total PSD-95. (C) In vitro kinase assay using immune-purified DNA-PKcs from mouse cortical LP1 extracts and recombinant PSD-95 protein. PSD-95 phosphorylation was analyzed by Western blot using the phospho-specific antibodies pS308 and pT87. The kinase assay (n = 3 independent experiments) was performed incubating: recombinant PSD-95 with ATP in the absence of DNA-PKcs (lane 1); DNA-PKcs with ATP without PSD-95 (lane 2); the two proteins without or with ATP (lane 3 and 4). IgG heavy chain bands in lanes 2, 3, and 4 indicate DNA-PKcs immunoprecipitation. The positions of the purified DNA-PKcs, pPSD-95 (S308 and T87), total PSD-95, and IgG are indicated by arrows. (D) Representative Western blots of phosphorylated PSD-95 at S308 and at T87 showing the increase of PSD-95 protein synthesis and phosphorylation at both residues at different time points after delivery of HFS to hippocampal slices. Densitometric quantifications of the immunoreactive bands, normalized to α-Tubulin or total PSD-95, are represented as percent changes in protein phosphorylation with respect to control (T0) for each time point (means ± SEM; n = 3 independent experiments). *p < 0.05 vs control values (T0), **p < 0.005 vs control values (T0). °p < 0.05 vs control values (T0), °°p < 0.005 vs control values (T0). Statistics by two-way ANOVA followed by Tukey’s post hoc analysis. (E) Representative Western Blots of protein extracts of cortical neurons from WT and DNA-PKcs −/− mice showing that PSD-95 protein remains constant, after cycloheximide treatment, up to 48 h in WT cortical neurons, whereas it decreases over time in DNA-PKcs −/− neurons. Values in the plot represent the quantification of PSD-95 protein levels over time following cycloheximide treatment normalized to α-Tubulin. (means ± SEM; n = 3 independent experiments). Statistics by two-way ANOVA followed by Tukey’s post hoc analysis. *p < 0.05 DNA-PKcs −/− 9 h vs DNA-PKcs −/− T0; ***p < 0.001 DNA-PKcs −/− 24 h vs DNA-PKcs −/− T0, ****p < 0.0001 DNA-PKcs −/− 48 h vs DNA-PKcs −/− T0, °p < 0.05 DNA-PKcs −/− 9 h vs WT 9 h, °°°p < 0.001 DNA-PKcs −/− 24 h vs WT 24 h, °°°°p < 0.0001 DNA-PKcs −/− 48 h vs WT 48 h. Source data are available online for this figure.
Figure 8
Figure 8. Phospho-mimetic mutants PSD-95S308E and PSD-95T87E remain stable in DNA-PKcs −/− neurons.
(A) Two phospho-mimetic, two non-phosphorylatable mutants, and PSD-95 wt Flag-tagged proteins were generated and inserted in the backbone of a rAAV vector, under constitutive promoter CMV, for virion production. Control viral vectors were a Flag empty vector and an EGFP expressing vector both under CMV promoter. (B) Representative Western Blot of protein extracts from primary cortical neurons (n = 3) infected with rAAV viruses to confirm mutant protein expression when probed with an anti-Flag antibody. A rAAV vector over-expressing EGFP protein was used as a control. GAPDH was used as a loading control. (C) High-magnification images of cortical neurons (DIV 21) transduced with rAAV to express PSD-95 wt, the phospho-mimetic, and the non-phosphorylatable PSD-95 mutants show a strong over-expression in culture. Neurons were labeled with anti-Flag (green channel), anti-MAP2 (red channel) antibodies, and DNA dye (blue, DAPI). Scale Bar 5 μm. (D) Upper panel, representative Western Blots of protein extracts from DNA-PKcs −/− primary cortical neurons transduced with PSD-95S308E and PSD-95T87E phospho-mimetic mutants. Membranes probed with anti-Flag antibody revealed that the mutant proteins remain stable in DNA-PKcs −/− neurons up to 48 h after cycloheximide treatment. Values in the plot represent quantification of PSD-95S308E and PSD-95T87E mutant protein levels over time following cycloheximide treatment and normalized to α-Tubulin (means ± SEM; n = 3 independent experiments). Statistics by two-way ANOVA followed by Bonferroni post hoc analysis. PSD-95T87E 24 h vs T0 p > 0.999; PSD-95T87E 48 h vs T0 p > 0.999; PSD-95S308E 24 h vs T0 p > 0.999; PSD-95S308E 48 h vs T0 p > 0.999. Lower panel, representative Western blots of protein extracts from WT cortical neurons transduced with PSD-95S308A and PSD-95T87A non-phosphorylatable mutants (Left panel) or PSD-95S308E and PSD-95T87E (Right panel). Membranes probed with anti-Flag antibody revealed that non-phosphorylatable mutant proteins significantly decrease from 24 h after cycloheximide in WT neurons while the PSD-95S308E and PSD-95T87E proteins remain stable up to 48 h. Values in the plot represent the quantification of PSD-95S308A, PSD-95T87A, PSD-95S308E, and PSD-95T87E mutant protein levels over time following cycloheximide treatment and normalized to α-Tubulin. (means ± SEM; n = 3 independent experiments). Statistics by two-way ANOVA followed by Tukey’s post hoc analysis. ***p < 0.001 PSD-95T87A 24 h vs T0; ****p < 0.0001 PSD-95T87A 48 h vs T0; °p < 0.05 PSD-95S308A 24 h vs T0; °°°°p < 0.0001 PSD-95S308A 48 h vs T0. CMV cytomegalovirus, EGFP enhanced green fluorescent protein, WPRE Woodchuck hepatitis virus post-transcriptional regulatory element. Source data are available online for this figure.
Figure 9
Figure 9. Phospho-mimetic mutants localize at synaptic membranes and restore spine number in DNA-PKcs −/− neurons.
(A) Representative Western Blot of LP1 protein extracts from DNA-PKcs −/− primary cortical neurons (n = 3 cultures) after transduction with rAAV empty vector or rAAV PSD-95 phospho-mimetic mutants, probed with the anti-PSD-95 antibody. Both mutants show a localization in synaptosomal membranes after over-expression. (B) Upper panels, triple immunofluorescence THUNDER images of rAAV-infected primary cortical neurons (DIV 21) labeled with the anti-Homer 1 (red channel) and anti-Flag (green channel) antibodies showing a strong synaptic expression of the phospho-mimetic mutants. Scale Bar 5 μm. Lower panels, high magnification views of dendrites, marked by white boxes in upper panels, showing the distribution of PSD-95 mutants in spines and their co-localization with the postsynaptic protein Homer 1. Single-channel images are provided to better evaluate the localization of each protein. Scale Bar, 2 μm. (C) Representative THUNDER microscope immunofluorescence images of cortical neurons (DIV 21) from DNA-PKcs −/− mice infected with the empty vector or the PSD-95 wt, or S308E or T87E proteins, were further infected with EGFP-rAAV virus to visualize spine morphology, and then stained with the anti-MAP2 antibody (red channel) and DNA dye (DAPI, blue channel). Scale Bar 5 μm. The over-expression of both phospho-mimetic mutants in DNA-PKcs −/− cortical neurons is able to increase the number of spines along dendrites with significantly larger heads, as shown in the high-magnification images (black and white), as compared with both PSD-95 wt and the empty vector. Number of spines was calculated per 50 µm dendritic length. Histogram data represent the number of protrusions per μm. Error bars represent SEM. A minimum of 130 spines were counted from at least 10 neurons/each group, repeated for three independent experiments (**p < 0.005 DNA-PKcs −/− S308E vs empty vector; ***p < 0.001 DNA-PKcs −/− T87E vs empty vector; *p < 0.05 DNA-PKcs −/− S308E vs PSD-95 wt; **p < 0.005 DNA-PKcs −/− T87E vs PSD-95 wt). Statistics by two-way ANOVA followed by Bonferroni post hoc analysis. Data distribution is shown in the enlargement; DNA-PKcs −/− Empty vector n = 30 neurons, DNA-PKcs −/− PSD-95 wt n = 30 neurons, DNA-PKcs −/− S308E n = 30 neurons, DNA-PKcs −/− T87E n = 30 neurons. Source data are available online for this figure.
Figure 10
Figure 10. The phospho-mimetic mutant PSD-95T87E increases dendrite complexity in DNA-PKcs −/− neurons and improves LTP induction in DNA-PKcs −/− mice.
(A) Representative confocal and THUNDER microscopy images of triple labeled DNA-PKcs −/− primary cortical neurons (DIV 9 upper panel, and DIV 21 lower panel) stained with the anti-MAP2 (red channel), anti-Flag (green channel) antibodies and DNA dye (DAPI, blue channel). The over-expression of the phospho-mimetic T87E is able to increase the dendrite complexity in DNA-PKcs −/− cortical neurons as compared with neurons over-expressing the EGFP control vector. Scale Bar 5 μm. (B) Left panel, MAP2 immunofluorescence (red channel) images of DNA-PKcs −/− primary cortical neurons transduced with EGFP control vector or PSD-95T87E mutant. T87E transduced neurons acquire a multipolar aspect due to an increased number of neurites as compared with EGFP DNA-PKcs −/− infected neurons. Representative tracing images (skeletons) of DNA-PKcs −/− infected cultures are shown. Scale Bar 5 μm. Right panel, Sholl analysis of DNA-PKcs −/− cortical neurons transduced with EGFP control vector, PSD-95 wt or the phospho-mimetic mutants PSD-95S308E and PSD-95T87E. T87E mutant is able to increase neurite complexity in DNA-PKcs −/− cultures as indicated by a significant increase in the number of intersections in the range of 0–60 μm distance from the cell body. A sample of six neurons was taken for each group (n = 3 cultures). A number of intersections was counted in a 100-µm radius from the soma along the dendritic tree. Statistics by two-way ANOVA followed by Bonferroni post hoc analysis. Results are expressed as mean ± SEM. ****p < 0.0001 and *p < 0.05 T87E vs EGFP DNA-PKcs −/− infected neurons; ●●●●p < 0.0001, ●●p < 0.005, and ●p < 0.05 T87E vs S308E; °°°°p < 0.0001 T87E vs PSD-95 wt. (C) Representative confocal images of triple labeled DNA-PKcs −/− primary cortical neurons (DIV 9) stained with the anti-MAP2 (red channel), anti-Flag (green channel) antibodies, and DNA dye (DAPI, blue channel). Neither PSD-95 wt nor the phospho-mimetic S308E over-expression is able to reverse the decreased dendrite complexity of DNA-PKcs −/− neurons. Scale Bar 5 μm. (D) PSD-95T87E, PSD-95S308E, PSD-95 wt, and EGFP rAAV expressing vectors were injected into the cerebral lateral ventricles of P1 DNA-PKcs −/− mouse pups and 8 weeks hippocampal slices used for electrophysiological analysis. (E) Representative quantitative Western blot showing similar expression levels of the different Flag proteins in the hippocampus of DNA-PKcs −/− injected mice 8 weeks after rAAV brain injection (n = 3 hippocampi/each injected vector). (F) Left panel, time courses of fEPSP slope after HFS in slices of DNA-PKcs −/− mice injected with PSD-95T87E, PSD-95S308E, PSD-95 wt, and EGFP rAAV expressing vectors. Right panel, bar graph showing fEPSP potentiation in the four experimental groups 60 min after HFS (n = 9 for PSD-95 wt, n = 5 for each other experimental group. *p < 0.05 T87E vs DNA-PKcs −/− injected with EGFP, one-way ANOVA followed by Dunnett’s test; Bar graph with gray background shows fEPSP potentiation in WT and DNA-PKcs −/− slices (WT n = 16 slices and DNA-PKcs −/− n = 9 slices) to compare rescue of LTP levels inT87E rAAV injected mice with uninfected mice. Gray background indicates that the two group of mice (injected and no injected) are not statistically compared. Source data are available online for this figure.
Figure EV1
Figure EV1. DNA-PKcs has a lower nuclear staining in post-mitotic neurons as compared with proliferating cells.
Representative immunofluorescence images showing the distribution of DNA-PKcs (green) in post-mitotic mouse hippocampal neurons as compared with proliferating human neural progenitor cells (NPCs) and HEK293 cells. In proliferating cells, DNA-PKcs appear mainly concentrated in the nucleus, whereas in neurons, it is abundant along dendrites showing a punctate staining and lower nuclear labeling. Scale Bar 10 μm.
Figure EV2
Figure EV2. DNA-PKcs shows a synaptic distribution in cortical neurons.
Representative triple immunofluorescence THUNDER images of mouse primary cortical neurons (DIV 21) labeled with the anti-DNA-PKcs antibody (green channel), the synaptic markers: Synapsin I, Syntaxin I, PSD-95, GluN1, and GluA1 (red channel), one at a time, and the neuronal marker MAP2 (blue). Single-channel images are provided to better show the localization of each synaptic marker and the distribution of DNA-PKcs similar to the synaptic proteins. Scale Bar 5 μm.
Figure EV3
Figure EV3. PSD-95 wt over-expressed protein is less stable in the absence of DNA-PKcs kinase activity.
Representative Western blots of protein extracts from cortical neurons of WT and DNA-PKcs −/− mice show that PSD-95 wt protein, over-expressed in WT neurons, remains stable after cycloheximide treatment up to 48 h, whereas it decreases over time when over-expressed in DNA-PKcs −/− neurons. Values in the plot represent the quantification of PSD-95 wt protein levels over time following cycloheximide treatment normalized to α-Tubulin. (means ± SEM; n = 3). Statistics by two-way ANOVA followed by Bonferroni post hoc analysis. *p < 0.05 DNA-PKcs 24 h vs DNA-PKcs T0, ***p < 0.001 DNA-PKcs 48 h vs DNA-PKcs T0, °°p < 0.005 DNA-PKcs 24 h vs WT 24 h, °°°°p < 0.0001 DNA-PKcs −/− 48 h vs WT 48 h. Source data are available online for this figure.

References

    1. Anderson CW, Lees-Miller SP (1992) The nuclear serine/threonine protein kinase DNA-PK. Crit Rev Eukaryot Gene Expr 2:283–314 - PubMed
    1. Anderson WW, Collingridge GL (2001) The LTP program: a data acquisition program for on-line analysis of long-term potentiation and other synaptic events. J Neurosci Methods 108:71–83 10.1016/S0165-0270(01)00374-0 - DOI - PubMed
    1. Bao J, Lin H, Ouyang Y, Lei D, Osman A, Kim TW, Mei L, Dai P, Ohlemiller KK, Ambron RT (2004) Activity-dependent transcription regulation of PSD-95 by neuregulin-1 and Eos. Nat Neurosci 7:1250–1258 10.1038/nn1342 - DOI - PubMed
    1. Bats C, Groc L, Choquet D (2007) The interaction between Stargazin and PSD-95 regulates AMPA receptor surface trafficking. Neuron 53:719–734 10.1016/j.neuron.2007.01.030 - DOI - PubMed
    1. Boulton SJ, Jackson SP (1998) Components of the Ku-dependent non-homologous end-joining pathway are involved in telomeric length maintenance and telomeric silencing. EMBO J 17:1819–1828 10.1093/emboj/17.6.1819 - DOI - PMC - PubMed

LinkOut - more resources