. 2024 Oct;8(10):1285-1307.
doi: 10.1038/s41551-024-01238-y. Epub 2024 Jul 31.

Prevention and treatment of peri-implant fibrosis by functionally inhibiting skeletal cells expressing the leptin receptor

Affiliations

Prevention and treatment of peri-implant fibrosis by functionally inhibiting skeletal cells expressing the leptin receptor

Vincentius Jeremy Suhardi et al. Nat Biomed Eng. 2024 Oct.

Abstract

The cellular and molecular mediators of peri-implant fibrosis-a most common reason for implant failure and for surgical revision after the replacement of a prosthetic joint-remain unclear. Here we show that peri-implant fibrotic tissue in mice and humans is largely composed of a specific population of skeletal cells expressing the leptin receptor (LEPR) and that these cells are necessary and sufficient to generate and maintain peri-implant fibrotic tissue. In a mouse model of tibial implantation and osseointegration that mimics partial knee arthroplasty, genetic ablation of LEPR+ cells prevented peri-implant fibrosis and the implantation of LEPR+ cells from peri-implant fibrotic tissue was sufficient to induce fibrosis in secondary hosts. Conditional deletion of the adhesion G-protein-coupled receptor F5 (ADGRF5) in LEPR+ cells attenuated peri-implant fibrosis while augmenting peri-implant bone formation, and ADGRF5 inhibition by the intra-articular or systemic administration of neutralizing anti-ADGRF5 in the mice prevented and reversed peri-implant fibrosis. Pharmaceutical agents that inhibit the ADGRF5 pathway in LEPR+ cells may be used to prevent and treat peri-implant fibrosis.


Conflict of interest statement

Competing interests

The authors declare no competing interests.

Figures
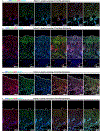
Extended Data Fig. 1 |
Extended Data Fig. 1 |. LEPR, ACTA2, and ADGRF5 are expressed by peri-implant fibrotic tissue from multiple patients underwent revision surgery for aseptic loosening.
a,c, Expression of LEPR (red), ACTA2(green), ADGRF5 (cyan) by peri-implant fibrotic tissue from two different patients suffering from peri-implant fibrosis around prior total hip arthroplasty. Far left, overlap between DAPI and LEPR. Second from left, overlap between ACTA2 and DAPI. Third from left, overlap between ADGRF5 and DAPI. Third from right, overlap between LEPR and ACTA2. Second from right, overlap between LEPR and ADGRF5. Far right, overlap between LEPR, ACTA2, and ADGRF5. Scale bar, 250 μm. b,d, Expression of LEPR (red), ACTA2 (green), ADGRF5 (cyan) by peri-implant fibrotic tissue from two different patients suffering from peri-implant fibrosis around prior total knee arthroplasty. Far left, overlap between DAPI and LEPR. Second from left, overlap between ACTA2 and DAPI. Third from left, overlap between ADGRF5 and DAPI. Third from right, overlap between LEPR and ACTA2. Second from right, overlap between LEPR and ADGRF5. Far right, overlap between LEPR, ACTA2, and ADGRF5. Scale bar, 250 μm. Images in ad are representative of 4 biologically independent experiments.
Extended Data Fig. 2 |
Extended Data Fig. 2 |. COL3A1, S100A4, SM22A, ACTA2, FBLN2, and SDC4 are expressed by peri-implant fibrotic tissue in both human and mice.
Expression of COL3A1 (a, green), S100A4 (c, green), SM22A (e, green), ACTA2-RFP (g, green), FBLN2 (i, green), SDC4 (k, green) in murine peri-implant fibrotic tissue and its overlap with LepR tdTomato cells (red). Scale bar, 50 μm. Expression of COL3A1 (b, green), S100A4 (d, green), SM22A (f, green), ACTA2 (h, green), FBLN2 (j, green), SDC4 (l, green) in human peri-implant fibrotic tissue and its overlap with LEPR+ cells (red). Scale bar, 50 μm. Images in a–l are representative of at least 3 independent biological replicates.
Extended Data Fig. 3 |
Extended Data Fig. 3 |. A subset of LEPR+ cells in the peri-implant fibrotic tissue expresses Cxcl12-GFP.
a, Expression of LepR-tdTomato and Cxcl12-GFP in the peri-implant fibrotic tissue of LepRcre;Rosa26tdTomato; Cxcl12GFP mice underwent fibrous-integrated surgery at postoperative day 14. A subset of LEPR+ cells (red) co-localize with cells expressing Cxcl12 (green). Scale bar, 500 μm. b-e, Enlarged view of the outlined blue box of figure in panel a. Scale bar, 50 μm. Images in a-e are representative of at least 3 independent experiments. f, Expression of LepR-tdTomato and Cxcl12-GFP in the peri-implant osseous tissue of LepRcre;Rosa26tdTomato; Cxcl12GFP mice underwent osseointegrated surgery at postoperative day 14. A subset of LEPR+ cells (red) in the perivascular area co-localizes with cells expressing Cxcl12 (green). Scale bar, 500 μm. gj, Enlarged view of the outlined blue box of figure in panel f. Scale bar, 50 μm. Images in f-j are representative of at least 3 independent experiments. kl, Expression of CXCL12-GFP by Lin-LepR-tdTomato+ (k) or osseointegrated surgery (l). m-n, Immunofluorescence quantification of expression of and Cxcl12-GFP in LepRcre;Rosa26tdTomato; Cxcl12GFP mice underwent fibrous-integrated or osseointegrated surgery at postoperative day 14. Data are mean ± s.d. n = 11 for both osseointegrated and fibrous-integrated model. n, Immunofluorescence quantification of co-localization between of LepR-tdTomato and Cxcl12-GFP in LepRcre;Rosa26tdTomato; Cxcl12GFP mice underwent fibrous-integrated or osseointegrated surgery at postoperative day 14. Unpaired, two-tailed Student’s t-test. Data are mean ± s.d. n = 11 for both osseointegrated and fibrous-integrated model. Each dot in m and p corresponds to biologically independent replicates.
Extended Data Fig. 4 |
Extended Data Fig. 4 |. Small percentage of Lin 6C3 CD90CD200+ CD105 (mSSC) and Lin 6C3CD90 CD200var CD105+ (BCSP) are Lin LepR tdTomato+.
a, Schematic of flow cytometry comparison experiment between LepRcre;Rosa26tdtomato mice underwent fibrous-integrated or osseointegrated implantation surgery at postoperative day 14. b-d, Schematic representation of the strategy used for FACS analysis of Lin 6C3 CD90 CD200+ CD105 (mSSC) and Lin-6C3-CD90-CD200varCD105+ (BCSP)of mice underwent fibrous integrated surgery (c) or osseointegrated surgery (d). ef, There is no difference in abundance of mSSC and BCSP in the peri-implant area between fibrous- and osseointegrated mice. Data are mean ± s.d. Unpaired, two-tailed Student’s t-test. n = 8 for fibrous-integrated model and n = 9 for osseointegrated model. g, TdTomato+ subset of Lin 6C3 CD90 CD200+ CD105 are more abundant in fibrous-integrated peri-implant area than in osseointegrated peri-implant area. Data are mean ± s.d. Unpaired, two-tailed Student’s t-test. n = 8 for fibrous-integrated model and n = 9 for osseointegrated mode. h, There is no statistically significant difference in the abundance of tdTomato+ subset of Lin-6C3 CD90 CD200var CD105+ in fibrous-integrated peri-implant and in osseointegrated peri-implant area. Unpaired, two-tailed Student’s t-test. Data are mean ± s.d. n = 8 for fibrous-integrated model and n = 9 for osseointegrated model. i, LepR– tdTomato+ cells in fibrous-integrated interface were immunostained for CD200 demonstrating presence of LepR-TdTomato+ CD200+ at the bone-fibrous tissue interface. Scale bar, 500 μm. Middle column and right column enlarged view of the outlined yellow box. Scale bar, 50 μm. j, LepR tdTomato+ cells in osseointegrated interface were immunostained for CD200 demonstrating presence of LepR TdTomato+ CD200+ at the perivascular area. Scale bar, 500 μm. Middle column and right column, enlarged view of the outlined yellow box. Scale bar, 50 μm. Each dot in eh corresponds to biologically independent replicates. Images in bd, ij are representative of at least 3 independent experiments.
Extended Data Fig. 5 |
Extended Data Fig. 5 |. A subset of LEPR+ cells in the peri-implant.
a, Expression of LepR-zsGreen and Acta2-RFP in the peri-implant fibrotic tissue of LepRcre;Rosa26Zsgreen; Acta2mRFP mice underwent fibrous-integrated surgery at postoperative day 14. A subset of LEPR+ cells (green) co-localize with cells expressing Acta2 (red). Scale bar, 500 μm. b-e, Enlarged view of the outlined yellow box of the figure in panel a. Scale bar, 50 μm. Images in a-e are representative of at least 3 independent experiments. f, Expression of LepR-zsGreen and Acta2-RFP in the peri-implant osseous tissue of LepRcre;Rosa26Zsgreen; Acta2mRFP mice underwent osseointegrated surgery at postoperative day 14. A subset of LEPR+ cells (green) in the perivascular area co-localize with cells expressing Acta2 (red). Scale bar, 500 μm. Images in a are representative of at least 3 independent experiments. gj, Enlarged view of the outlined yellow box of figure in panel f. Scale bar, 50 μm. Images in fj are representative of at least 3 independent experiments. kl, Representation of the strategy used for FACS analysis of expression of LepR-zsGreen and Acta2-RFP in Lin-6C3-CD90CD200+ CD105 fibrous integrated surgery (k) or osseointegrated surgery (l). LepRcre;Rosa26Zsgreen; Acta2mRFP (red), LepRcre;Rosa26Zsgreen (blue). m-n, Immunofluorescence quantification of expression of LepR-zsGreen and Acta2-RFP in LepRcre;Rosa26Zsgreen; Acta2mRFP mice underwent fibrous-integrated or osseointegrated surgery at postoperative day 14. Data are mean ± s.d. n = 5 for both osseointegrated and fibrous-integrated model. Unpaired, two-tailed Student’s t-test. o, Immunofluorescence quantification of co-localization between LepR-zsGreen and Acta2-RFP in LepRcre;Rosa26Zsgreen; Acta2mRFP mice underwent fibrous-integrated or osseointegrated surgery at postoperative day 14. Data are mean ± s.d. n = 5 for both osseointegrated and fibrous-integrated model; Unpaired, tailed Student’s t-test. p, Flow cytometry quantification of relative abundance of Lin-LepR-Zsgreen+ Acta2-RFP+ 6C3CD90 CD200+ CD105 in LepRcre;Rosa26Zsgreen; Acta2mRFP mice underwent fibrous-integrated or osseointegrated surgery at postoperative day 14. Data are mean ± s.d. n = 5 for both osseointegrated and fibrous-integrated model; Unpaired, two-tailed Student’s t-test. Each dot in m-p corresponds to biologically independent replicates. Images in k-l are representative of at least 3 independent experiments.
Extended Data Fig. 6 |
Extended Data Fig. 6 |. Peri-implant fibrotic tissue originate from osteogenic LEPR+ cells.
ac, Immunofluorescent imaging of proximal tibia of LepRcre;Rosa26tdtomato, BGLAP-GFP that underwent fibrous-integration surgery at post-operative day 3 (a), 7 (b), and 14 (c). Scale bar, 50 μm. df, Immunofluorescent imaging of ALPL-stained proximal tibia of LepRcre;Rosa26tdtomato, BGLAPGFP that underwent fibrous-integration surgery at post-operative day 3 (d), 7 (e), and 14 (f). Scale bar, 50 μm. g, Violin plots showing the expression density levels of Alpl and Bglap showed that they are selectively expressed by osteogenic (OLC1, OLC2) and chondrogenic (CLC) cells. h, Immunofluorescence quantification of co-localization between LepR-tdTomato and BGLAP-GFP in LepRcre;Rosa26tdtomato, BGLAPGFP mice underwent fibrous-integrated surgery at postoperative day 3, 7, and 14. Data are mean ± s.d. n = 6 for both osseointegrated and fibrous-integrated model; Unpaired, tailed Student’s t-test. i, Immunofluorescence quantification of co-localization between LepR-tdTomato and ALPL antibody staining in LepRcre;Rosa26tdtomato, BGLAPGFP mice underwent fibrous-integrated surgery at postoperative day 3, 7, and 14. Data are mean ± s.d. n = 6 for both osseointegrated and fibrous-integrated model; Unpaired, tailed Student’s t-test. j, Immunofluorescence quantification of tdTomato+ cells from CXCL12creERT2;Rosa26tdtomato, AdipoqcreERT2;Rosa26tdtomato and LepRcre;Rosa26tdtomato that underwent fibrous-integration surgery. N = 7 per group. Data are mean ± s.d.; two-tailed unpaired t-test. k-m, Immunofluorescent imaging of CXCL12creERT2;Rosa26tdtomato (k), AdipoqcreERT2;Rosa26tdtomato (l), and LepRcre;Rosa26tdtomato (m) that underwent fibrous-integration surgery at post-operative day 14. Each dot in h-j corresponds to biologically independent replicates. Images in af, km are representative of at least 3 independent experiments.
Extended Data Fig. 7
Extended Data Fig. 7. Peri-implant fibrosis is persistent up to at least 16 weeks in murine model of peri-implant fibrosis.
| a, Micro-computed tomography (μCT) of proximal tibia of LepRcre;Rosa26tdtomato underwent fibrous-integrated surgery at post-operative day 3, day 7, 2 weeks, 4 weeks, 8 weeks, and 16 weeks. Scale bar, 500 μm. b, Hematoxylin and eosin staining of proximal tibia of LepRcre;Rosa26tdtomato underwent fibrous-integrated surgery at post-operative day 3, day 7, 2 weeks, 4 weeks, 8 weeks, and 16 weeks. Scale bar, 500 μm. c, Immunofluorescent imaging proximal tibia of LepRcre;Rosa26tdtomato underwent fibrous-integrated surgery at post-operative day 3, day 7, 2 weeks, 4 weeks, 8 weeks, and 16 weeks. Scale bar, 500 μm. Bottom row, enlarged view of the outlined yellow box at each time-point. Scale bar, 50 μm. d, Bone volume/total volume (BV/TV)) of mice at post-operative day 3, day 7, 2 weeks, 4 weeks, 8 weeks, and 16 weeks. Data are mean ± s.d. n = 6. e, Histology quantification of peri-implant fibrosis (% Fibrosis) and peri-implant bone (% bone) of mice at at post-operative day 3, day 7, 2 weeks, 4 weeks, 8 weeks, and 16 weeks. Data are mean ± s.d. n = 6. f, Immunofluorescent quantification of peri-implant fibrosis (% Fibrosis) and peri-implant bone (% bone) of mice at at post-operative day 3, day 7, 2 weeks, 4 weeks, 8 weeks, and 16 weeks. Data are mean ± s.d. n = 6. Each dot in d-f corresponds to biologically independent replicates. Images in a–c are representative of at least 3 independent experiments.
Extended Data Fig. 8 |
Extended Data Fig. 8 |. Analysis of peri-implant bone of mice underwent osseointegrated surgery at postoperative day 3, day 7, 2 weeks, 4 weeks, 8 weeks, and 16 weeks.
a, Micro-computed tomography (μCT) of proximal tibia of LepRcre;Rosa26tdtomato underwent osseointegrated surgery at post-operative day 3, day 7, 2 weeks, 4 weeks, 8 weeks, and 16 weeks. Scale bar, 500 μm. b, Haematoxylin and eosin staining of proximal tibia of LepRcre;Rosa26tdtomato underwent osseointegrated surgery at postoperative day 3, day 7, 2 weeks, 4 weeks, 8 weeks, and 16 weeks. Scale bar, 500 μm. c, Immunofluorescent imaging proximal tibia of LepRcre;Rosa26tdtomato underwent osseointegrated surgery at postoperative day 3, day 7, 2 weeks, 4 weeks, 8 weeks, and 16 weeks. Scale bar, 500 μm. Bottom row, enlarged view of the outlined yellow box at each time-point. Scale bar, 50 μm. d, Bone volume/total volume (BV/TV) of mice at postoperative day 3, day 7, 2 weeks, 4 weeks, 8 weeks, and 16 weeks. Data are mean ± s.d. n = 6. e, Histology quantification of peri-implant fibrosis (% Fibrosis) and peri-implant bone (% bone) of mice at postoperative day 3, day 7, 2 weeks, 4 weeks, 8 weeks, and 16 weeks. Data are mean ± s.d. n = 6; 3 independent experiments. f, Immunofluorescent quantification of peri-implant fibrosis (% Fibrosis) and peri-implant bone (% bone) of mice at postoperative day 3, day 7, 2 weeks, 4 weeks, 8 weeks, and 16 weeks. Data are mean ± s.d. n = 6. Each dot in d-f corresponds to biologically independent replicates. Images in a-c are representative of at least 3 independent experiments.
Extended Data Fig. 9 |
Extended Data Fig. 9 |. Human mSSC (Lin PDPN+ CD146 CD164+ CD73+) are more abundant in bone than in fibrous membranes, but Lin LEPR+ are more abundant in fibrous membranes than in bone.
a, Schematic representation of the strategy used for FACS analysis to obtain Lin-population. bc, Schematic representation of the strategy used for FACS analysis to obtain LEPR expressing a subset of Lin PDPN+ CD146 CD164+ CD73+ from bone (b) or from fibrous tissue (c). d, Flow cytometry quantification of human fibrous tissue and bone demonstrates human mSSC (Lin PDPN+ CD146 CD164+ CD73+) are more abundant in bone than in fibrous membrane. Data are mean ± s.d. n = 10 patients for fibrous membrane and n = 10 for bone patients. Unpaired, two-tailed Student’s t-test. e, Flow cytometry quantification of human fibrous tissue and bone demonstrates the non-significant difference in osteolineage progenitor (LinPDPN+ CD146+) between fibrous membrane and bone. Data are mean ± s.d. n = 10 for fibrous membrane and n = 10 for bone. Unpaired, two-tailed Student’s t-test. f, Flow cytometry quantification of human fibrous tissue and bone demonstrates significantly higher amount of Lin LEPR+ PDPN+ CD146 in the fibrous membrane than in bone. Data are mean ± s.d. n = 10 patients for fibrous membrane and n = 10 patients for bone. Unpaired, two-tailed Student’s t-test. Each dot in d-f corresponds to biologically independent replicates. Images in a-c¬ are representative of at least 3 independent experiments.
Extended Data Fig. 10 |
Extended Data Fig. 10 |. Administration of neutralizing antibody against reduces LepR tdTomato+ cells but does not affect Lin 6C3 CD90 CD200+ CD105 (mSSC) subpopulation.
a, Immunofluorescent imaging of CD200-antibody stained. proximal tibia of LepRcre;Rosa26tdtomato receiving either anti-ADGRF5 or isotype control as prophylaxis. Scale bar, 500 μm. Right column, enlarged view of the outlined yellow box. Scale bar, 50 μm. b, Immunofluorescent imaging of CD200-antibody-stained proximal tibia of LepRcre;Rosa26tdtomato receiving either anti-ADGRF5 or isotype control as treatment starting from postoperative day 14. Scale bar, 500 μm. Right column, enlarged view of the outlined yellow box. Scale bar, 50 μm. c,f FACS analysis of TdTomato+ subset of Lin-6C3 CD90CD200+ CD105 (TdTomato+ mSSC) in mice group receiving anti-ADGRF5 as compared to isotype control, either as prophylaxis (c) or as treatment (f). Anti-ADGRF5 (n = 5), isotype control (n = 5). Unpaired, two-tailed Student’s t-test. Data are mean ± s.d. d,g, FACS analysis of Lin 6C3 CD90 CD200+ CD105 (mSSC) between mice receiving daily anti-ADGRF5 or isotype control either as prophylaxis (d) or as treatment (f). Anti-ADGRF5 (n = 5), isotype control (n = 5). ns= not significant. Unpaired, two-tailed Student’s t-test. treatment (f). Anti-ADGRF5 (n = 5), isotype control (n = 5). Unpaired, two-tailed Student’s t-test. Data are mean ± s.d. e, Host bone-implant failure load of LepRcre;Rosa26tdtomato receiving either daily anti-ADGRF5 or isotype control as prophylaxis at postoperative day 28. n = 5 for mice receiving anti-ADGRF5 and n = 5 for mice receiving isotype control. Unpaired, two-tailed Student’s t-test. Data are mean ± s.d. h, Host bone-implant failure load of LepRcre;Rosa26tdtomato receiving either daily anti-ADGRF5 or isotype control as treatment starting from postoperative day 14 and evaluated at postoperative day 28. n = 5 for mice receiving anti-ADGRF5 and n = 5 for mice receiving isotype control. Unpaired, two-tailed Student’s t-test. Data are mean ± s.d. Images in a-b are representative of at least 3 independent biological replicates. Each dot in c–e and f–h corresponds to biologically independent replicates.
Fig. 1 |
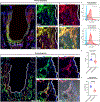
Fig. 1 |. LEPR-expressing cells are present abundantly in both human and murine peri-implant fibrous tissue.
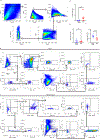
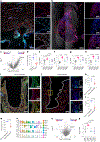
a,b, Plain radiograph (a) and gross specimen (b) of patient with peri-implant fibrosis around total joint replacement. The white dotted line indicates the implant–host interface. The red box indicates the bone underlying fibrotic tissue. c, Haematoxylin-and-eosin staining of tissue outlined by the yellow box in b. Scale bar, 500 μm. d, LEPR (red) signal in human peri-implant fibrotic tissue obtained during revision joint replacement surgery. Scale bar, 250 μm. e, Enlarged view of outlined region (yellow box) in d. Scale bar, 50 μm. f,g, Flow cytometry of cells from human peri-implant fibrotic tissue digests obtained during revision joint replacement surgery (f) and cells from human bone digests obtained during primary joint replacement surgery (g) to identify LinLEPR+ cells. h, Flow-cytometry quantification of LinLEPR+ cells in human peri-implant fibrotic tissue and in trabecular bone. Human peri-implant fibrous tissue, n = 10; biologically independent human bone, n = 9. Unpaired, two-tailed Student’s t-test. Data are mean ± s.d. i, Plain radiograph of murine model with peri-implant fibrosis. j, Haematoxylin-and-eosin staining of mouse peri-implant fibrotic tissue at 14 days postsurgery. Scale bar, 500 μm. Right: enlarged view of the outlined region (yellow box). Scale bar, 100 μm. k, tdTomato (red) signal in proximal tibia of LepRcre;Rosa26tdTomato mice at postoperative day 14. The white dotted lines correspond to the interface between implant and fibrous tissue. Scale bar, 500 μm. l,m, Enlarged view of the outlined region (yellow box) in k, showing LEPR-tdTomato cells (l) and LEPR antibody (LEPR-Ab) (m) immunofluorescence. Scale bar, 50 μm. n,o, Flow cytometry of cells from proximal tibia digests from postoperative day 14 mice receiving fibrous-integration surgery (n) or osseointegration surgery (o) to identify LinLEPR+ cells. p, Flow-cytometry quantification of LinLEPR+ cells in proximal tibia of mouse with fibrous integration and osseointegration. Fibrous-integrated mice, n = 10; osseointegrated mice, n = 5. Unpaired, two-tailed Student’s t-test. Each dot in h and p corresponds to biologically independent replicates. Images in cg and jo are representative of at least three independent biological replicates.
Fig. 2 |
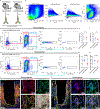
Fig. 2 |. Ablation of LEPR+ cells resulted in significant reduction of peri-implant fibrosis.
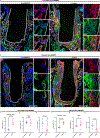
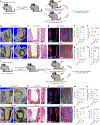
a, Schematic of presurgical ablation of LEPR-tdTomato+ cells in LepRcre;Rosa26tdTomato;iDTR mice with the administration of diphtheria toxin or saline. b, μCT of the proximal tibia of mice 14 days after fibrous-integration surgery and receiving either diphtheria toxin (top) or saline (bottom). Yellow outline represents the implant; red outline represents the fibrotic area. Scale bars, 500 μm. c, Haematoxylin-and-eosin (left) and immunofluorescence imaging (middle and right) of mice 14 days after surgery. Scale bars, 500 μm. Right: enlarged view of the outlined region. Scale bar, 50 μm. d,e, bone volume (BV)/total volume (TV) (d) and trabecular number (e) of the proximal tibia of mice receiving diphtheria toxin (n = 6) or saline (n = 6). Unpaired, two-tailed Student’s t-test. Data are mean ± s.d. f,g, Histomorphometric analysis of relative bone (f) and fibrous tissue (g) area in the peri-implant area. Mice receiving diphtheria toxin, n = 6; mice receiving saline, n = 5. h, FACS analysis of cells isolated from mice receiving diphtheria toxin (n = 6) and mice receiving saline (n = 6). For fh, unpaired, two-tailed Student’s t-test. Data are mean ± s.d. i, Schematic of postsurgical ablation experiments of LEPR-tdTomato+ cells on LepRcre;Rosa26tdtomato;iDTR mice with the administration of diphtheria toxin or saline daily. j, μCT of proximal tibia of mice 14 days after surgery. Yellow outline represents the implant; red outline represents fibrosis. Scale bars, 500 μm. k, Haematoxylin-and-eosin (left) and immunofluorescence imaging (middle and right) of mice 28 days after surgery. Scale bars, 500 μm. Right: enlarged view of outlined region. Scale bar, 50 μm. l,m, μCT quantitative analysis of the proximal tibia of mice after surgery; BV/TV (l) and trabecular number (m) are shown. n,o, Histomorphometric analysis of relative bone and fibrous tissue in the peri-implant area. Shown are the histological percentage of bone area (n) and histological percentage fibrotic area (o). p, Immunofluorescence quantification of peri-implant LEPR-tdTomato+ cells in mice after 28 days after surgery. For lp, mice receiving diphtheria toxin, n = 6; mice receiving saline, n = 6. Unpaired, two-tailed Student’s t-test. Data are mean ± s.d. Each dot in dh and lp corresponds to biologically independent replicates. Images in b, c, j and k are representative of at least three independent biological replicates. Pre-op, pre-operative; postop, postoperative.
Fig. 3 |
Fig. 3 |. Fibrous-integration surgery does not affect osteogenicity of LinLepR-tdTomato6C3CD90CD105CD200+.
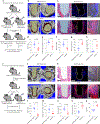
a, Schematic representation of engraftment of LinLEPR-tdTomato mSSCs from LepRcre;Rosa26tdTomato mice that underwent either fibrous-integrated or osseointegrated surgery. b,c, μCT three-dimensional reconstruction of bone organoids derived from LinLepR-tdTomato mSSCs isolated from mice that underwent fibrous-integrated surgery (b) or osseointegrated surgery (c). d, μCT quantification of BV of bone organoids derived from LinLEPR-tdTomato mSSCs isolated from mice that underwent fibrous-integrated surgery or osseointegrated surgery. Mice receiving cells from fibrous-integrated donor, n = 5; mice receiving cells from osseointegrated donor, n = 5. Each dot in d corresponds to biologically independent replicates. Data are mean ± s.d. Two-tailed unpaired t-test. e,f, Representative Movat pentachrome (left), Von Kossa (middle), and Safranin O-fast green staining (right) of organoids derived from LinLEPR-tdTomato mSSCs isolated from mice that underwent fibrous-integrated surgery (e) or osseointegrated surgery (f). Images in b, c, e and f are representative of at least three independent experiments. NS, not significant.
Fig. 4 |
Fig. 4 |. Engrafted LinLEPR-tdTomato+ cells from a fibrous-integrated donor are more inclined to form fibrous tissue than LinLEPR-tdTomato+ cells from a osseointegrated donor.
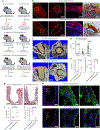
a, Schematic representation of kidney and orthotopic engraftment of LinLEPR-tdTomato+ cells from LepRcre;Rosa26tdTomato mice that underwent either fibrous-integrated or osseointegrated surgery. b, Whole-kidney immunofluorescence imaging (far left) and the corresponding enlarged view (second from the left; scale bar, 500 μm), immunofluorescence imaging of cryo-sectioned kidney (second from the right; scale bar, 50 μm) and Movat-pentachrome-stained slides of kidney (far right; scale bar, 50 μm) from mice receiving LinLEPR-tdTomato+ cells from a fibrous-integrated donor (top) or osseointegrated donor (bottom) at 2 months postoperative. c, μCT of the proximal tibia of mice 2 months after fibrous-integration surgery with intraoperative peri-implant engraftment of LinLEPR-tdTomato+ cells from the fibrous-integrated donor (top) or osseointegrated (bottom) donor. Scale bar, 500 μm. d, Histological quantification of kidneys with engrafted LinLEPR-tdTomato+ cells from fibrous-integrated donor (n = 4) and kidneys receiving cells from the osseointegrated donor (n = 4). Unpaired, two-tailed Student’s t-test. Data are mean ± s.d. e,f, Peri-implant μCT quantification of mice receiving LinLEPR-tdTomato+ cells from the osseointegrated donor (n = 6) and mice receiving LinLEPR-tdTomato+ cells from the fibrous-integrated donor (n = 5); shown is BV/TV (e) and trabecular thickness (f). Two-tailed Student’s t-test. Data are mean ± s.d. g, Haematoxylin-and-eosin staining of recipient mouse’s proximal tibia at 2 months postoperative. Scale bar, 500 μm. h, Immunofluorescence imaging of recipient mice receiving LinLEPR-tdTomato+ cells from either fibrous-integrated (top) or osseointegrated (bottom) donor. Scale bar, 500 μm. Middle: enlarged view of outlined yellow box showing the presence of LEPR-tdTomato+ αSMA+ in the fibrous tissue. Scale bar, 50 μm. Right: enlarged view of the outlined yellow box showing the presence of tdTomato+CD200+ in the fibrous tissue. Scale bar, 50 μm. i,j, Histological quantification of peri-implant tissue in mice receiving LinLEPR-tdTomato+ from fibrous-integrated donor (n = 5) and from osseointegrated donor (n = 6); shown is the quantification of bone area (i) and fibrous area (j). Unpaired, two-tailed Student’s t-test. Each dot in d, f, i and j corresponds to biologically independent replicates. Data are mean ± s.d. Images in b, c, g and h are representative of at least three independent biological replicates.
Fig. 5 |
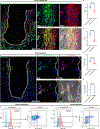
Fig. 5 |. ADGRF5 is expressed in abundance by LEPR+ cells in both human and murine peri-implant fibrotic tissue.
a,b, Cells expressing LEPR (red) and ADGRF5 (green) in human peri-implant fibrotic tissue (a) and bone (b). Scale bar, 250 μm. Right: enlarged view corresponding to the area marked by the red box on the left. Scale bar, 50 μm. c, Volcano plot showing differentially expressed genes in the bulk RNA-seq analysis of FACS-sorted LinLEPR+ (n = 10 fibrous tissue, n = 9 bone). Two-sided quasi-likelihood F-test. Red dotted line indicates log fold change = 2. Blue dotted line indicates P = 0.05. d, Immunofluorescence quantification of overlap between ADGRF5 and LEPR in fibrous membrane and bone. Unpaired, two-tailed Student’s t-test. Data are mean ± s.d. n = 9 fibrous tissue, n = 10 bone. eh, Expression of ADGRF5 (e), CXCL12 (f), FOXC1 (g) and PDGFRα (h) from bulk RNA-seq of FACS-sorted LinLEPR and LinLEPR+ from human peri-implant fibrotic tissue and bone. Data are mean ± s.d. n = 10 fibrous tissue, n = 9 bone. CPM, counts per million reads mapped. i,j, Cells expressing LEPR-tdTomato (red) and ADGRF5 (green) in LepRcre;Rosa26tdTomato mice that underwent fibrous-integrated surgery (i) and osseointegrated surgery (j) at postoperative day 14. Left: scale bar, 500 μm. Right: enlarged view corresponding to the area marked by yellow box. Scale bars, 50 μm. km, Immunofluorescence quantification of peri-implant LEPR-tdTomato+ cells (k), ADGRF5+ cells (l) and percentage of cells co-expressing LEPR and ADGRF5 (m) in fibrous-integration and osseointegration groups. Data are mean ± s.d. n = 4 fibrous integrated, n = 4 osseointegrated. Unpaired, two-tailed Student’s t-test. n, Violin plot showing expression of Lepr, Cxcl12, Ebf3, and Adgrf5 by analysis of FACS-sorted tdTomato+ cells from LepRcre;Rosa26tdTomato mice. o, Volcano plot of differentially expressed genes in the bulk RNA-seq analysis of FACS-sorted LinLEPR-tdTomato+ (n = 4 fibrous integrated, n = 4 osseointegrated). Blue dot represents ADGRF5. Two-sided quasi-likelihood F-test. Red dotted line indicates log fold change = 2. Blue dotted line indicates P = 0 p, ADGRF5 expression LinLEPR-tdTomato+ in fibrous-integrated mice and osseointegrated mice. Unpaired, two-tailed Student’s t-test. Data are mean ± s.d. n = 5 fibrous-integrated mice, n = 4 osseointegrated mice. Each dot in dh, km and p corresponds to biologically independent replicates. Images a, b, i and j are representative of at least three independent biological replicates.
Fig. 6 |
Fig. 6 |. Ablation of Adgrf5 in LEPR+ cells inhibits peri-implant fibrosis and enhances peri-implant bone formation in vivo.
a, μCT of proximal tibia of LepRcre;Rosa26tdTomato;Adgrf5+/+ (LepRcre/+) and LepRcre;Rosa26tdTomato;Adgrf5+/+ (LepRcre/+;Adgrf5f/f) mice at postoperative day 14. All mice underwent fibrous-integration surgery. Scale bar, 500 μm. b, Haematoxylin-and-eosin staining of the proximal tibia of LepRcre/+ and LepRcre/+;Adgrf5f/f mice at postoperative day 14. Scale bar, 500 μm. ce, BV/TV (c), trabecular number (d) and trabecular thickness (e) of LepRcre/+ and LepRcre/+;Adgrf5f/f mice that underwent fibrous-integration surgery. n = 13 for LepRcre/+ and n = 14 for LepRcre/+;Adgrf5f/f. Unpaired, two-tailed Student’s t-test. Data are mean ± s.d. f,g, Histological quantification of peri-implant fibrosis (f) and bone (g) of LepRcre/+ and LepRcre/+;Adgrf5f/f at postoperative day 14. n = 14 for LepRcre/+ and n = 14 for LepRcre/+;Adgrf5f/f. Unpaired, two-tailed Student’s t-test. Data are mean ± s.d. h, Flow-cytometric quantification of LinLEPR-tdTomato+ cells of control and floxed mice at postoperative day 14. n = 6 for LepRcre/+ and n = 6 for LepRcre/+;Adgrf5f/f. Unpaired, two-tailed Student’s t-test. Data are mean ± s.d. i, Cells expressing LEPR-tdTomato (red) and CD200 (green) in murine peri-implant fibrotic tissue. Scale bar, 500 μm. Middle: enlarged view corresponding to the outlined area (LepRcre/+ (red box) and LepRcre/+;Adgrf5f/f (blue box)). Scale bar, 50 μm. j, Cells expressing LEPR-tdTomato (red) and ACTα2 (green) in murine peri-implant fibrotic tissue. Scale bar, 500 μm. Middle: enlarged view corresponding to the outlined area (control, red box; flox, blue box). Scale bar, 50 μm. km, Immunofluorescence quantification of peri-implant tissue of control and flox mice at postoperative day 14 for peri-implant LEPR-tdTomato+ cells (k), CD200-expressing LEPR-tdTomato cells (l) and ACTα2-expressing LEPR-tdTomato cells (m). n = 13 for LepRcre/+ and n = 14 for LepRcre/+;Adgrf5f/f. Unpaired, two-tailed Student’s t-test. Each dot in ce, fh and km corresponds to biologically independent replicates. Images in a, b, i and j are representative of at least three independent biological replicates.
Fig. 7 |
Fig. 7 |. Ablation of Adgrf5 in LEPR+ resulted in decreased LEPR+ cell proliferation and increased osteogenic differentiation capability.
a,b, Proliferation of LEPR+ cells in the peri-implant region by in vivo BrdU incorporation assay. Representative immunofluorescence imaging of peri-implant region from LepRcre;Rosa26tdTomato;Adgrf5f/f (LepRcre/+;Adgrd5f/f) (a) and LepRcre;Rosa26tdTomato;Adgrf5+/+ (LepRcre/+) (b) mice. c, BrdU proliferation assay quantification of LEPR-tdTomato+BrdU+ cells in the peri-implant region. n = 8 for LepRcre/+ and n = 7 for LepRcre/+;Adgrd5f/f mice. Data are mean ± s.d.; two-tailed unpaired t-test. d, μCT quantification of BV of bone organoids derived from LinLEPR-tdTomato+ cells from LepRcre;Rosa26tdTomato;Adgrf5+/+ (LepRcre/+;Adgrd5f/f) and LepRcre;Rosa26tdTomato;Adgrf5+/+ (LepRcre/+) mice. n = 5 per group. Data are mean ± s.d.; two-tailed unpaired t-test. e,h, μCT three-dimensional reconstruction of bone organoids derived from LinLEPR-tdTomato+ cells from LepRcre;Rosa26tdTomato;Adgrf5f/f (LepRcre/+;Adgrf5f/f) (e) and LepRcre; Rosa26tdTomato;Adgrf5+/+ (LepRcre/+) (h) mice. f,i, Representative Von Kossa staining for mineralized bone in organoids derived from LinLEPR-tdTomato+ cells from LepRcre/+;Adgrd5f/f (f) and LepRcre/+ (i) mice. Right: enlarged view of the outlined region of the yellow box in the left image. Scale bars, 500 μm (left), 50 μm (right). g,j, Representative immunofluorescence imaging of organoids derived from LinLEPR-tdTomato+ cells from LepRcre/+;Adgrd5f/f (g) and LepRcre/+ (j) mice. Scale bars, 50 μm. k, Representative Movat pentachrome (left) and Safranin O-fast green staining (right) of organoids derived from LinLEPR-tdTomato+ cells from LepRcre/+;Adgrf5f/f mice. Scale bars, 50 μm. l, Representative Movat pentachrome (left) and Safranin O-fast green staining (right) of organoids derived from LinLEPR-tdTomato+ cells from LepRcre/+ mice. Scale bars, 50 μm. Each dot in c and d corresponds to biologically independent replicates. Images in a, b and e–l are representative of at least three independent experiments.
Fig. 8 |
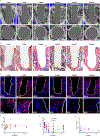
Fig. 8 |. Administration of neutralizing antibody against ADGRF5 can both prevent and reverse peri-implant fibrosis.
a, Schematic representation of intra-articular administration of anti-ADGRF5 to prevent peri-implant fibrosis. All LepRcre;Rosa26tdTomato mice underwent fibrous-integrated surgery and were subsequently randomized to receive daily intra-articular injection of anti-ADGRF5 or isotype control. b, μCT of proximal tibia of LepRcre;Rosa26tdTomato mice receiving either anti-ADGRF5 or isotype at postoperative day 14. Scale bar, 500 μm. c, Haematoxylin-and-eosin staining of proximal tibia of LepRcre;Rosa26tdTomato mice receiving either anti-ADGRF5 or isotype. Scale bar, 500 μm. d, Immunofluorescence imaging of proximal tibia of LepRcre;Rosa26tdTomato mice receiving either anti-ADGRF5 or isotype control. Scale bar, 500 μm. Right: enlarged view of the outlined yellow box. Scale bar, 50 μm. e,f, BV/TV (e) and trabecular thickness (f) of mice receiving either anti-ADGRF5 or isotype control. Anti-ADGRF5, n = 5; isotype, n = 5. Unpaired, two-tailed Student’s t-test. Data are mean ± s.d. g,h, Histological quantification of peri-implant fibrosis (g) and bone (h) of mice receiving anti-ADGRF5 or isotype. Anti-ADGRF5, n = 5; isotype, n = 5. Unpaired, two-tailed Student’s t-test. Data are mean ± s.d. i, Schematic representation of administration of intra-articular anti-ADGRF5 to reverse peri-implant fibrosis. All LepRcre;Rosa26tdTomato mice underwent fibrous-integrated surgery. At postoperative day 14, mice are randomized to receive daily intra-articular injection of anti-ADGRF5 or isotype control for 14 days. j, μCT of proximal tibia of LepRcre;Rosa26tdTomato mice receiving either anti-ADGRF5 or isotype. Scale bar, 500 μm. k, Haematoxylin-and-eosin staining of proximal tibia of LepRcre;Rosa26tdTomato mice receiving either anti-ADGRF5 or isotype. Scale bar, 500 μm. l, Immunofluorescence imaging of proximal tibia of LepRcre;Rosa26tdTomato mice receiving either anti-ADGRF5 or isotype. Scale bar, 500 μm. Right: enlarged view of the outlined yellow box. Scale bar, 50 μm. m,n, BV/TV (m) and trabecular thickness (n) of mice receiving either anti-ADGRF5 or isotype. Anti-ADGRF5, n = 5; isotype control, n = 5. Unpaired, two-tailed Student’s t-test. Data are mean ± s.d. o,p, Histological quantification of peri-implant fibrosis (o) and bone (p) of mice receiving anti-ADGRF5 or isotype. Anti-ADGRF5, n = 5; isotype, n = 5. Unpaired, two-tailed Student’s t-test. Data are mean ± s.d. n = 5. Each dot in eh and mp corresponds to biologically independent replicates. Images in bd and jl are representative of at least three independent biological replicates.

References

    1. Headon H, Kasem A & Mokbel K Capsular contracture after breast augmentation: an update for clinical practice. Arch. Plast. Surg. 42, 532–543 (2015). - PMC - PubMed
    1. Shah PK Inflammation, neointimal hyperplasia, and restenosis: as the leukocytes roll, the arteries thicken. Circulation 107, 2175–2177 (2003). - PubMed
    1. Apostu D, Lucaciu O, Berce C, Lucaciu D & Cosma D Current methods of preventing aseptic loosening and improving osseointegration of titanium implants in cementless total hip arthroplasty: a review. J. Int. Med. Res. 46, 2104–2119 (2018). - PMC - PubMed
    1. Wang T et al. Institutional experience of in-stent stenosis after pipeline flow diverter implantation: a retrospective analysis of 6 isolated cases out of 118 patients. Medicine 100, e25149 (2021). - PMC - PubMed
    1. Feng X, Gu J & Zhou Y Primary total hip arthroplasty failure: aseptic loosening remains the most common cause of revision. Am. J. Transl. Res. 14, 7080–7089 (2022). - PMC - PubMed

LinkOut - more resources