. 2024 Sep;43(18):3916-3947.
doi: 10.1038/s44318-024-00184-4. Epub 2024 Jul 31.

Loss of Elp3 blocks intestinal tuft cell differentiation via an mTORC1-Atf4 axis

Affiliations

Loss of Elp3 blocks intestinal tuft cell differentiation via an mTORC1-Atf4 axis

Caroline Wathieu et al. EMBO J. 2024 Sep.

Abstract

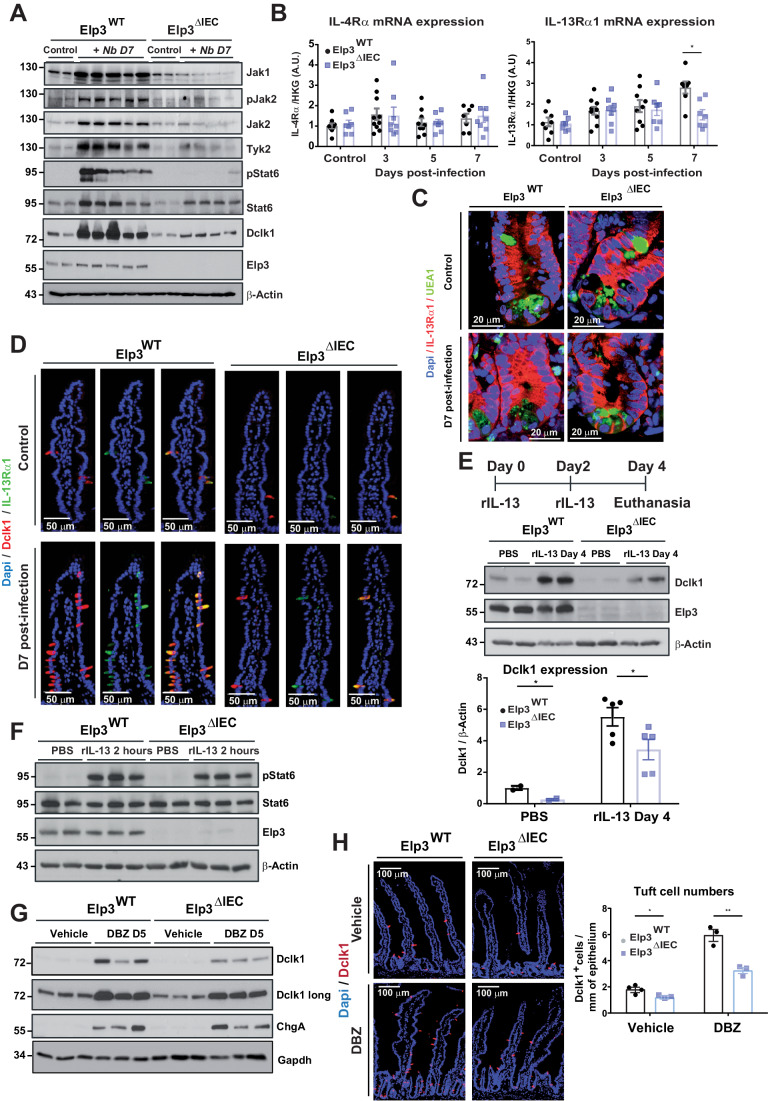
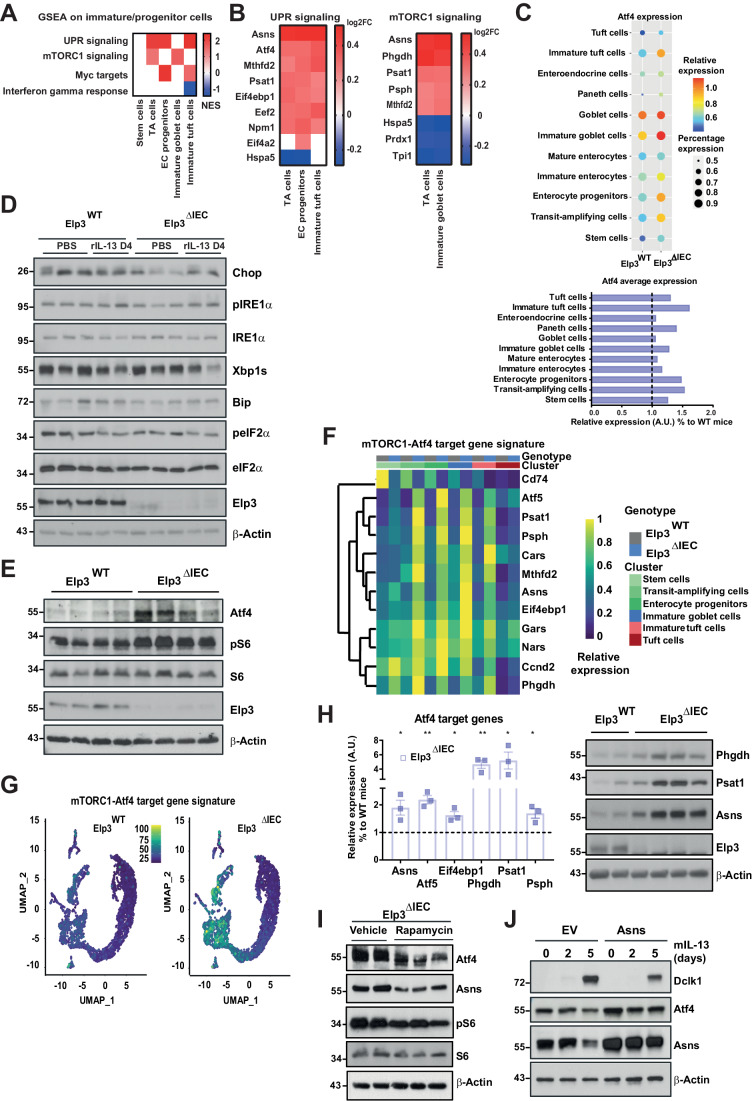
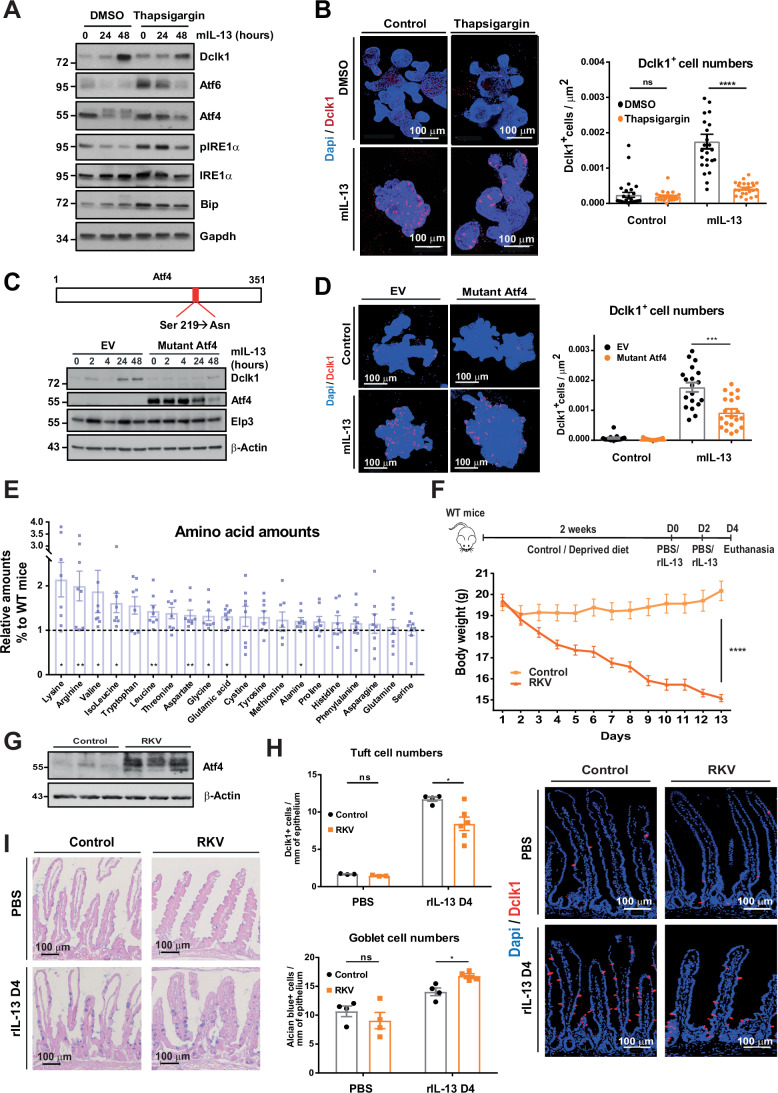
Intestinal tuft cells are critical for anti-helminth parasite immunity because they produce IL-25, which triggers IL-13 secretion by activated group 2 innate lymphoid cells (ILC2s) to expand both goblet and tuft cells. We show that epithelial Elp3, a tRNA-modifying enzyme, promotes tuft cell differentiation and is consequently critical for IL-25 production, ILC2 activation, goblet cell expansion and control of Nippostrongylus brasiliensis helminth infection in mice. Elp3 is essential for the generation of intestinal immature tuft cells and for the IL-13-dependent induction of glycolytic enzymes such as Hexokinase 1 and Aldolase A. Importantly, loss of epithelial Elp3 in the intestine blocks the codon-dependent translation of the Gator1 subunit Nprl2, an mTORC1 inhibitor, which consequently enhances mTORC1 activation and stabilizes Atf4 in progenitor cells. Likewise, Atf4 overexpression in mouse intestinal epithelium blocks tuft cell differentiation in response to intestinal helminth infection. Collectively, our data define Atf4 as a negative regulator of tuft cells and provide insights into promotion of intestinal type 2 immune response to parasites through tRNA modifications.

Keywords: ATF4; Tuft Cells; mTORC1; tRNA Modifications.


Conflict of interest statement

The authors declare no competing interests.

Figures

Figure 1
Figure 1. Elp3 deficiency impairs intestinal tuft cell amplification upon helminth infection.
(A) Tuft cell numbers are reduced in intestines lacking Elp3. Immunostainings and corresponding quantifications (left and right panels, respectively) of tuft cells (Dclk1+ cells, in red) in the small intestine of naive Elp3WT and Elp3ΔIEC mice (mean values ± SEM; Mann–Whitney test; n = 8; **p < 0.01). (B) Elp3 deficiency in the intestine does not interfere with the infection rate of N. brasiliensis in the lung. The infection rate was assessed by L4 larvae countings at day 2 after N. brasiliensis infection in the lungs of both Elp3WT (n = 5) and Elp3ΔIEC (n = 4) mice (mean values ± SEM; Mann–Whitney test). (C, D) Delayed parasite clearance in Elp3-deficient mice infected with N. brasiliensis. Egg count in feaces from Elp3WT (n = 6) and Elp3ΔIEC mice (n = 7) at indicated time points post-N. brasiliensis infection (C) (mean values ± SEM; Mann–Whitney test; *p < 0.05, **p < 0.01). On the left (D), representative images of proximal small intestines of both genotypes on day 7 post-N. brasiliensis infection are shown. On the right (D), worm burden across the entire small intestine at the indicated time points post-N. brasiliensis infection are quantified (mean values ± SEM; Mann–Whitney test; n ≥ 4; *p < 0.05, **p < 0.01). (E) Parasite viability is enhanced in Elp3-deficient mice infected with N. brasiliensis. An ATP luciferase assay measuring the parasite viability in Elp3WT and Elp3ΔIEC mice at indicated time points post-N. brasiliensis infection is shown (mean values ± SEM; Mann–Whitney test; n = parasites from ≥4 infected mice, *p < 0.05, ***p < 0.001). (F) Tuft cell expansion is impaired in Elp3-deficient mice infected with N. brasiliensis. Immunostainings and corresponding quantifications (upper and lower panels, respectively) of tuft cells (Dclk1+ cells, in red) in the small intestine of Elp3WT and Elp3ΔIEC mice naive or at indicated time points post-N. brasiliensis infection are shown (mean values ± SEM; Mann–Whitney test; n ≥ 6; **p < 0.01, ***p < 0.001). Data in naive mice are identical to the ones plotted in panel (A). (G) Impaired induction of Dclk1 mRNA levels in infected intestines lacking Elp3. Real-time PCRs were carried out to quantify Dclk1 mRNA levels with extracts from naive Elp3WT and Elp3ΔIEC mice or at indicated time points post-N. brasiliensis infection. Normalization was calculated on the average of four housekeeping genes Gapdh, β-Actin, 36b4 and β2-microglobulin (mean values ± SEM; Mann–Whitney test; n ≥ 7; ***p < 0.001). (H) Dclk1 protein levels fail to properly increase post-infection in intestines lacking Elp3. Expression levels of Dclk1, Elp3, and β-actin in the small intestine of Elp3WT and Elp3ΔIEC mice naive or at indicated time points post-N. brasiliensis infection were addressed by western blots. (I) Lack of induction of tuft cell receptors upon infection with N. brasiliensis in intestines lacking Elp3. mRNA levels of indicated tuft cell receptors in the small intestine of Elp3WT and Elp3ΔIEC mice naive or at indicated time points post-N. brasiliensis infection were quantified by real-time PCRs. Normalization was calculated as described in (G). (mean values ± SEM; n ≥ 3). Source data are available online for this figure.
Figure 2
Figure 2. Elp3 deficiency impairs ILC2 activation and goblet cell expansion upon helminth infection in the intestine.
(A) IL-25 induction upon helminth infection is impaired in IECs lacking Elp3. IL-25 mRNA levels in the small intestine of Elp3WT and Elp3ΔIEC mice naive or at indicated time points post-N. brasiliensis infection were quantified by real-time PCRs. Normalization was calculated as described in Fig. 1G (mean values ± SEM; Mann–Whitney test; n ≥ 7; *p < 0.05). (B) IL-13 production by intestinal ILC2s is impaired upon Elp3 deficiency at day 3 after N. brasiliensis infection. Lamina propria cells were isolated and subjected to PMA and Ionomycin restimulation in the presence of brefeldin and monsensin before intracellular staining for IL-13. ILC2s were gated as live CD45+LinKLRG1+ cells. Lineage included APC-labeled antibodies to CD3ε, CD4, CD8α, CD11c, siglec-F, FcεRI, B220/CD45R, Gr-1, CD5, CD49b, and F4/80 (mean values ± SEM; Mann–Whitney test; n ≥ 9; *p < 0.05). (C) Impaired migration of inflammatory ILC2s (iLC2s) in the lung over time after N. brasiliensis infection in Elp3ΔIEC mice. Total ILC2s were gated as Lin-Gata3+Sca1+ and iILC2s were identified as Klrg1highThy-1low cells (mean values ± SEM; Mann–Whitney test; n ≥ 3; ***p < 0.001). (D) Impaired expression of enzymes involved in PGD2 production in Elp3ΔIEC mice. mRNA levels of the indicated enzymes in the small intestine of Elp3WT and Elp3ΔIEC mice naive or 7 days post-N. brasiliensis infection were quantified by real-time PCRs. Normalization was calculated on the average of two housekeeping genes Gapdh and 36b4 (mean values ± SEM; Student t-test; n = 3 and 2 for naive Elp3WT and Elp3ΔIEC mice; n = 5 and 4 for infected Elp3WT and Elp3ΔIEC mice, **p < 0.01, ***p < 0.001). (EG) Goblet cell expansion is impaired in Elp3-deficient mice infected with N. brasiliensis. Retnlβ mRNA levels in the small intestine of Elp3WT and Elp3ΔIEC mice naive or at indicated time points post-N. brasiliensis infection were quantified (E). Normalization was calculated as described in Fig. 1G (mean values ± SEM; Mann–Whitney test; n ≥ 7; ***p < 0.001). Protein levels of Mucin2 were also quantified by western blot analyses with extracts from the small intestine of Elp3WT and Elp3ΔIEC mice naive or at indicated time points post-N. brasiliensis infection (F). Mucin2+ cells (in green) were also quantified by IF in the small intestine of Elp3WT and Elp3ΔIEC mice naive or infected with N. brasiliensis (mean values ± SEM; Mann–Whitney test; n ≥ 4; *p < 0.05) (G). Source data are available online for this figure.
Figure 3
Figure 3. Elp3 deficiency impairs tuft cell differentiation upon IL-13 stimulation or Notch inhibition.
(A) IL-13 signaling is impaired in the intestine of Elp3ΔIEC mice upon infection with N. brasiliensis. Expression levels of IL-13 signaling effectors, Dclk1, Elp3, and β-Actin in the small intestine of Elp3WT and Elp3ΔIEC mice naive or at D7 post-N. brasiliensis infection were assessed by western blot. (B) Impaired expression of IL-13Rα1 but not IL-4Rα in infected intestines lacking Elp3. IL-13Rα1 and IL-4Rα mRNA levels in the indicated experimental conditions were assessed by real-time PCRs. Data were plotted as described in Fig. 1G (mean values ± SEM; Mann–Whitney test; n ≥ 7; *p < 0.05). (C, D) IL-13Rα1 expression is detected in intestinal crypts (C) and in tuft cells (D). Representative pictures of IL-13Rα1+ cells (in red) by immunostaining in the small intestine of Elp3WT and Elp3ΔIEC mice naive or infected with N. brasiliensis are shown (C). Paneth cells were defined as UEA1+ cells (in green). Representative pictures of IL-13Rα1+/Dclk1+ cells immunostaining (in green and in red, respectively) in the small intestine of Elp3WT and Elp3ΔIEC mice naive or infected with N. brasiliensis are shown (D). (E) Tuft cell differentiation is specifically impaired in intestines lacking Elp3 upon rIL-13 treatment. Elp3WT and Elp3ΔIEC mice received or not rIL-13 injections every 2 days to promote both tuft and goblet cell differentiation. The resulting extracts from intestines were subjected to western blot analyses. A quantification of the Dclk1/β-Actin ratio in all experimental conditions (mean values ± SEM; Student t-test; n = 2 for naive mice and n = 5 for rIL-13 treated mice; *p < 0.05) is shown. (F) IL-13-dependent Stat6 activation is not affected in IECs lacking Elp3 upon rIL-13 treatment. Expression levels of pStat6, Stat6, Elp3, and β-Actin in the small intestine of naive Elp3WT and Elp3ΔIEC mice or subjected to rIL-13 treatment were assessed by western blot. (G, H) Tuft cell differentiation is specifically impaired in intestines lacking Elp3 upon Notch inhibition. Expression levels of Dclk1, ChgA, and β-Actin in the small intestine of Elp3WT and Elp3ΔIEC mice naive or after Dibenzazepine (DBZ) treatment assessed by western blot are illustrated (G). Immunostainings and corresponding quantifications (left and right panels, respectively) of tuft cells (Dclk1+ cells, in red) in the small intestine of Elp3WT and Elp3ΔIEC mice treated or not with DBZ (mean values ± SEM; Student t-test ; n = 3; *p < 0.05, **p < 0.01) are illustrated (H). Source data are available online for this figure.
Figure 4
Figure 4. Elp3 deficiency impairs tuft cell fate determination at an early step of differentiation.
(A) Cell-type clustering in intestines of the indicated genotypes revealed through single-cell RNA sequencing. A three-dimensional graphical representation of cell-type clustering in the small intestine of both Elp3WT and Elp3ΔIEC mice subjected to rIL-13 treatment overnight is illustrated (left panel; n = 4 pooled mice). A two-dimensional graphical representation of cell-type clustering in each genotype is also illustrated (right panel; n = 2 pooled littermate mice per genotype). (B) Tuft cell clustering in intestines of the indicated genotypes. The figure shows a tuft cell clustering with the Uniform Manifold Approximation and Projection (UMAP), illustrating the similar distribution of both immature and mature tuft cell populations between Elp3WT and Elp3ΔIEC mice subjected to rIL-13 treatment overnight (n = 2 pooled mice per genotype). (C) Elp3 expression profile in mouse intestinal epithelial cells revealed through single-cell RNA sequencing. Dotplot illustrating Elp3 expression among epithelial subtypes in the small intestine of Elp3WT mice subjected to rIL-13 treatment overnight. (D) Identification of the transcriptional signature of immature tuft cells. Dotplot illustrating candidates whose mRNA levels are enriched in immature tuft cells (single-cell RNA sequencing data carried out with extracts from Elp3WT mice subjected to rIL-13 treatment overnight). (E) Expression of candidates enriched in immature tuft cells is impaired in Elp3ΔIEC mice infected with N.brasiliensis. mRNA levels of the indicated candidates in the small intestine of Elp3WT and Elp3ΔIEC mice naive or 7 days post-N. brasiliensis infection were quantified by real-time PCRs. Normalization was calculated on the average of two housekeeping genes Gapdh and 36b4 (mean values ± SEM; Student t-test; n = 3 and 2 for naive Elp3WT and Elp3ΔIEC mice; n = 5 and 4 for infected Elp3WT and Elp3ΔIEC mice; *p < 0.05, **p < 0.01, ***p < 0.001). Source data are available online for this figure.
Figure 5
Figure 5. Elp3 deficiency impairs some metabolic pathways in tuft cells.
(A) Identification of defective metabolic pathways upon Elp3 deficiency in tuft cells. A gene set enrichment analysis (GSEA) was carried out on tuft cells of both Elp3WT and Elp3ΔIEC mice subjected to rIL-13 treatment and revealed impaired oxidative phosphorylation and glycolysis upon Elp3 deficiency (n = 2 pooled mice per genotype). The statistically significant enrichment of the gene set was selected based on false discovery rate (FDR) ≤0.25. (B, C) Gene candidates involved in both oxidative phosphorylation and glycolysis are enriched in tuft cells compared to other secretory cells and both signatures are impaired upon Elp3 deficiency. A heatmap revealing candidates involved in glycolysis and oxidative phosphorylation (left and right panels, respectively) based on transcriptomic analyses done with extracts from the small intestine of both Elp3WT and Elp3ΔIEC mice subjected to rIL-13 stimulation overnight is illustrated (n = 2 pooled mice per genotype) (B). A UMAP showing both metabolic pathways enriched in tuft cells (n = 2 pooled mice per genotype) is illustrated (data with enterocytes are removed for clarity purposes). Tuft cells are highlighted in red circles (C). (D) Elp3 deficiency in the intestine interferes with IL-13 induction of specific glycolytic enzymes. Elp3WT and Elp3ΔIEC mice were treated or not with rIL-13 for 4 days, and the resulting extracts from the intestines were subjected to western blot analyses using the indicated antibodies. A quantification of the relative expression of both glycolytic enzymes (ratio on β-Actin) in IL-13-stimulated mice from several experiments is illustrated (mean values ± SEM; Student t-test; n ≥ 4; *p < 0.05, **p < 0.01). Source data are available online for this figure.
Figure 6
Figure 6. Elp3 deficiency potentiates the mTORC1-Atf4 signature in intestinal immature epithelial cells.
(A, B) Identification of activated signaling pathways in progenitor cells lacking Elp3. A GSEA on intestinal epithelial cell populations was carried out for both genotypes. A heatmap showing differentially regulated signaling pathways among indicated epithelial subtypes in the small intestine of both Elp3WT and Elp3ΔIEC mice subjected to rIL-13 treatment overnight is illustrated (n = 2 pooled mice per genotype) (A). The statistically significant enrichment of the gene set was selected based on false discovery rate (FDR) ≤0.25. Heatmaps depicting signatures highlighted in the GSEA analysis for both mTORC1 and UPR signaling pathways are shown (B). (C) Enhanced Atf4 expression in intestinal epithelial subtypes lacking Elp3. Dot plots and corresponding quantifications of Atf4 expression among epithelial subtypes in the small intestine of both Elp3WT and Elp3ΔIEC mice subjected to rIL-13 treatment overnight are illustrated (top and bottom panel, respectively). (D) The canonical UPR signaling is not defective in intestines lacking Elp3. Expression levels of UPR signaling effectors, Elp3 and β-Actin in the small intestine of both naive Elp3WT and Elp3ΔIEC mice (PBS) or treated with rIL-13 for 4 days were assessed by western blot. (E) mTORC1 signaling is upregulated in IECs lacking Elp3. Expression levels of mTORC1 signaling effectors, Elp3 and β-Actin in the small intestine of both naive Elp3WT and Elp3ΔIEC mice were assessed by western blot. (F, G) The mTORC1-Atf4 target gene signature is upregulated in immature populations of intestines lacking Elp3. A heatmap revealing the differentially expressed genes from the mTORC1-Atf4 target gene signature based on transcriptomic analyses done with extracts from the small intestine of both Elp3WT and Elp3ΔIEC mice subjected to rIL-13 stimulation overnight is illustrated (n = 2 pooled mice per genotype). Differentially expressed genes were identified using FindMarkers/FindAllMarkers functions from the Seurat package (Wilcoxon rank-sum test). Only genes that were significantly up or down-regulated in one or more of the represented populations were selected, based on p_val_adj <0.05 and logFC >0.25 (F). An UMAP showing the mTORC1-Atf4 target gene signature upregulated in immature intestinal cells lacking Elp3 (n = 2 pooled mice per genotype) is illustrated (G). (H) Upregulation of some target genes of the mTORC1-Atf4 axis in intestines lacking Elp3. mRNA levels of some mTORC1-Atf4 target genes in the small intestine of both naive Elp3WT and Elp3ΔIEC mice (ratio to Elp3WT mice) were quantified by real-time PCRs (left panel). Normalization was calculated on the average of the three housekeeping genes Gapdh, 36b4 and β2m (mean values ± SEM; Student t-test; n = 3; *p < 0.05, **p < 0.01). Expression levels of some mTORC1-Atf4 target genes, Elp3 and β-Actin in the small intestine of both naive Elp3WT and Elp3ΔIEC mice were assessed by western blot (right panel). (I) Pharmacological inhibition of mTORC1 decreases Atf4 protein levels in the intestine. Elp3ΔIEC mice were treated or not with Rapamycin (see methods for details), and protein extracts from the intestinal epithelium of these mice were subjected to western blot analyses using the indicated antibodies. (J) Asns overexpression inhibits IL-13-dependent tuft cell differentiation. Ex-vivo organoids generated with intestinal crypts from WT mice were infected with a control lentivirus (EV empty vector) or with an Asns-overexpressing lentiviral construct. The resulting ex-vivo organoids were then stimulated or not with mIL-13 for 2 or 5 days, and cell extracts were subjected to western blot analyses. Source data are available online for this figure.
Figure 7
Figure 7. Elp3 promotes Nprl2 mRNA translation.
(A) Defective Nprl2 expression at the protein level upon Elp3 deficiency in IECs. On the left, extracts from the intestines of both naive Elp3WT and Elp3ΔIEC mice were subjected to western blot analyses using the indicated antibodies. On the right, Nprl2 mRNA levels in the small intestine of naive Elp3WT and Elp3ΔIEC mice were quantified by real-time PCRs. Normalization was calculated on the housekeeping gene Gapdh (mean values ± SEM; n = 3). (B, C) Elp3 promotes Nprl2 expression. An immortalized mouse intestinal epithelial cell line (mIECs) was transfected with the indicated shRNA construct and extracts from the resulting cells were subjected to western blot analyses using the indicated antibodies (B). Elp3 and Nprl2 mRNA levels were also quantified by real-time PCRs in all indicated experimental conditions (C). mRNA levels in cells transfected with the shRNA control were set to 1 and levels in other conditions were relative to that after normalization with Gapdh mRNA levels (mean values ± SEM; Student t-test; n = 4; ****p < 0.0001). (D) Enhanced ribosome density on the Nprl2 transcript upon Elp3 deficiency. A polysome profiling experiment was performed on IECs from both Elp3WT and Elp3ΔIEC naive mice. Ribosome density on the Nprl2 transcript was calculated by real-time PCRs (polysomal fraction/input ratio; mean values ± SEM; Student t-test; n ≥ 4; *p < 0.05). (E) Elp3 promotes Nprl2 mRNA translation in a codon-dependent manner. HEK293 cells infected with the shRNA control or targeting either Elp3 or Ctu2 were transfected with the indicated expression construct (cf the schematic representation of both wild-type and mutated Nprl2 with the localization of all mutations) and the resulting extracts were subjected to western blot analyses using the indicated antibodies. (F, G) Nprl2 promotes tuft cell differentiation. Western blot analyses using the indicated antibodies were conducted using extracts from untreated or IL-13-stimulated ex-vivo organoids lacking or not Nprl2 (100 ng/ml, 3 days) (F). Anti-Dclk1 immunofluorescence analyses were also carried out to quantify the number of Dclk1+ cells (in red) in all indicated experimental conditions (mean values ± SEM; Student t-test; n ≥ 3 organoids; ***p < 0.001) (G). Source data are available online for this figure.
Figure 8
Figure 8. Atf4 inhibition promotes intestinal tuft cell differentiation.
(A, B) Inhibition of Atf4 translation potentiates IL-13-dependent tuft cell differentiation in intestines lacking Elp3. Elp3ΔIEC mice received twice daily Isrib injections for 2 weeks to reduce Atf4 expression and were injected with rIL-13 4 days before the end of the experiment. Western blot analyses with extracts from the intestines of the resulting mice were carried out with the indicated antibodies (A). Immunostainings and corresponding quantifications (left and right panels, respectively) of tuft cells (Dclk1+ cells, in red) in the small intestine of Elp3ΔIEC mice treated with rIL-13 and with Isrib or with the vehicle (mean values ± SEM; Student t-test; n ≥ 3; *p < 0.05) are illustrated (B). (C) Inhibition of Atf4 translation does not have any impact on IL-13-dependent goblet cell differentiation. Immunostainings and corresponding quantifications (left and right panels, respectively) of goblet cells (Alcian Blue+ cells) in the small intestine of Elp3ΔIEC mice treated with rIL-13 and with Isrib or with the vehicle (mean values ± SEM; Student t-test; n ≥ 3) are illustrated. (D, E) Inhibition of Atf4 translation potentiates IL-13-dependent tuft cell differentiation, as evidenced by immunofluorescence (D) and western blot (E) analyses. Immunostainings and corresponding quantifications (left and right panels, respectively) of Dclk1+ cells (in red) in WT organoids treated with mIL-13 and with Isrib or with the vehicle (mean values ± SEM; Mann–Whitney test; n ≥ 13 organoids; *p < 0.05) are illustrated (D). Expression levels of Dclk1, Atf4, and β-Actin in WT organoids treated with mIL-13 and with Isrib or with the vehicle are illustrated (E). (F, G) Atf4 deficiency potentiates IL-13-dependent intestinal tuft cell differentiation. Ex-vivo organoids generated with intestinal crypts from WT mice were infected with the indicated shRNA constructs, and the resulting ex-vivo organoids were treated or not with mIL-13 (100 ng/ml) for the indicated days. Extracts were subsequently subjected to western blot analyses using the indicated antibodies (F). A quantification of Atf4 relative expression (Atf4/β-Actin ratio) from several experiments is illustrated (paired Student t-test, mean values ± SEM; n = 3; *p < 0.05, **p < 0.01). Anti-Dclk1 immunofluorescence analyses were also carried out to quantify the number of Dclk1+ cells (in red) in all experimental conditions (mean values ± SEM; Mann–Whitney test; n ≥ 16 organoids; *p < 0.05, ****p < 0.0001) (G). Source data are available online for this figure.
Figure 9
Figure 9. Atf4 induction reduces intestinal tuft cell differentiation.
(A, B) UPR activation impairs tuft cell differentiation in ex-vivo organoids. The UPR inducer Thapsigargin blocks IL-13-dependent Dclk1 induction, as evidenced by western blot (A) and immunofluorescence analyses (B). Expression levels of some UPR effectors, Dclk1 and Gapdh, in ex-vivo organoids generated with intestinal crypts from Elp3WT mice treated with mIL-13 and with Thapsigargin or with the vehicle (DMSO) are illustrated (A). Immunostainings and corresponding quantifications (left and right panels, respectively) of Dclk1+ cells (in red) in WT organoids treated with mIL-13 and with Thapsigargin or with the vehicle (mean values ± SEM; Mann–Whitney test; n ≥ 22 organoids from n ≥ 3 mice; ****p < 0.0001) are illustrated (B). (C, D) Overexpression of a non-degradable Atf4 mutant inhibits tuft cell differentiation. A mutated form of Atf4 (serine 219 was replaced by an asparagine) was overexpressed in WT organoids (C, D). Expression levels of Dclk1, Atf4, Elp3 and β-Actin in WT organoids overexpressing or not (Empty vector, EV) mutated Atf4 at indicated time points post-mIL-13 treatments were assessed by western blot analyses (C). Immunostainings and corresponding quantifications (left and right panels, respectively) of Dclk1+ cells (in red) in WT organoids overexpressing or not mutated Atf4 and treated or not with mIL-13 (mean values ± SEM; Mann–Whitney test; n ≥ 15 organoids; ***p < 0.001) are illustrated (D). (E) Enhanced levels of some amino acids in intestines lacking Elp3. A metabolomics analysis with extracts from small intestines of naive Elp3WT and Elp3ΔIEC mice was conducted (mean values + SEM; Mann–Whitney test; n > 5; *p < 0.05, **p < 0.01). (F) Amino acid deprivation induces weight loss in mice. WT mice received a control or a RKV-deprived diet for 2 weeks and were injected with rIL-13 for 4 days before the end of the experiment. Body weight was monitored every day (mean values + SEM; two-way ANOVA test; n = 8; ****p < 0.0001). (G) Amino acid deprivation induces Atf4 expression. Mice were fed with a control or a RKV-deprived diet for 2 weeks and extracts were subjected to western blot analyses using the indicated antibodies. (H, I) Amino acid deprivation inhibits tuft but not goblet cell differentiation. Immunostainings and corresponding quantifications (left and right panels, respectively) of tuft cells (Dclk1+ cells, in red) (H) or goblet cells (Alcian Blue+ cells) (I) in the small intestine of WT mice after 2 weeks of control or RKV-deprived diet and 4 days of PBS/rIL-13 treatment (mean values ± SEM; Mann–Whitney test; n ≥ 3 for (H) and n = 4 for (I); *p < 0.05) are shown. Source data are available online for this figure.
Figure 10
Figure 10. Atf4 overexpression in mouse IECs blocks tuft cell differentiation.
(A) TgAtf4IEC mice are smaller than WT mice. Representative pictures of both WT and TgAtf4IEC mice are illustrated. (B) Atf4 overexpression in intestinal epithelium shortens the length of both small intestines and colons. Representative organs of both genotypes are illustrated. (C) TgAtf4IEC mice overexpress some Atf4 target genes. mRNA levels of Atf4 target genes in the small intestine of naive WT and TgAtf4IEC (ratio to WT mice) were quantified by Real-Time PCRs. Normalization was calculated on the average of the two housekeeping genes Gapdh and 36b4 (mean values ± SEM; Mann–Whitney test; n ≥ 4; **p < 0.01). (D) WT and TgAtf4IEC mice share similar infection rates in the lung. The infection rate assessed by L4 larvae counts in lungs at day 2 after N. brasiliensis infection is illustrated (mean values ± SEM; Mann–Whitney test; n = 3). (E) Delayed parasite clearance in TgAtf4IEC mice infected with N. brasiliensis. The worm burden across the entire small intestine of both WT and TgAtf4IEC at the indicated time points post-N. brasiliensis infection was quantified (mean values ± SEM; Mann–Whitney test; n ≥ 3; *p < 0.05). (FH) Atf4 overexpression in the intestine interferes with tuft cell differentiation. Both WT and TgAtf4IEC mice were infected or not with N. brasiliensis. 7 days post-infection, extracts from the resulting small intestines were subjected to western blot (F), IF (G), or real-time PCR analyses (H), respectively. Immunostainings and corresponding quantifications (upper and lower panels, respectively) of tuft cells (Dclk1+ cells, in red) in the small intestine of Elp3WT and TgAtf4IEC mice naive or 7 days post-N. brasiliensis infection are shown (mean values ± SEM; Student t-test; n ≥ 3; **p < 0.01, ****p < 0.0001) (G). For real-time PCRs, Dclk1 and IL-25 mRNA levels were quantified, and normalization was calculated on the average of two housekeeping genes Gapdh and 36b4 (mean values ± SEM; Mann–Whitney test; n ≥ 3; *p < 0.05) (H). (I) Tuft cell differentiation is specifically impaired in TgAtf4IEC mice upon rIL-13 treatment. Mice of the indicated genotypes were treated or not with rIL-13 for 4 days, and the resulting extracts from small intestines were subjected to western blot analyses (right panels). A quantification of Dclk1 relative expression (Dclk1/β-Actin ratio) from several experiments is illustrated (mean values ± SEM; Mann–Whitney test; n ≥ 4; *p < 0.05). (J, K) Atf4 overexpression in ex-vivo organoids impairs IL-13-dependent Dclk1 induction. Ex-vivo organoids generated with intestines from mice of the indicated genotypes were treated or not with mIL-13 for 30 minutes to 5 days, and the resulting extracts were subjected to western blot analyses (J) or to anti-Dclk1 (in red) immunofluorescence analyses (K). A quantification of Dclk1+ cells in all experimental conditions is illustrated (right panel) (mean values ± SEM; Mann–Whitney test; n ≥ 8 organoids from n ≥ 2 different mice; ****p < 0.0001). Source data are available online for this figure.
Figure EV1
Figure EV1. Intestinal homeostasis is unaffected upon Elp3 inactivation.
(A) Intestines lacking Elp3 properly proliferate. Immunolabelings of intestinal sections from mice of the indicated genotypes and infected or not with N. brasiliensis are illustrated (KI67 and pHH3 stainings are in red and white, respectively). On the right, histograms show corresponding quantifications (n = 5 mice per genotype, mean value ± SEM; Mann–Whitney test shows no significant difference between Elp3WT and Elp3ΔIEC mice). (B) Elp3 deficiency impairs the induction of FFAR3. Mice of the indicated genotypes were infected with N. brasiliensis and protein extracts from intestines 7 days post-infection were subjected to western blot analyses to assess FFAR3 and β-actin expression. (C, D) Defa5 and ChgA are properly expressed in intestinal epithelial cells lacking Elp3. Mice of the indicated genotypes were infected or not with N. brasiliensis and RNAs from the resulting intestines were subjected to real-time PCR analyses to quantify both Defa5 (C) and ChgA (D) mRNA levels. Expression levels of these candidates were normalized on the average of four housekeeping genes, including Gapdh, β-Actin, 36B4 and β2-Microglobulin (n ≥ 6 mice per genotype; mean ± SEM; a Mann–Whitney test shows no significant differences between Elp3WT and Elp3ΔIEC mice). Source data are available online for this figure.
Figure EV2
Figure EV2. Elp3 is dispensable for the expansion of both enteroendocrine and goblet cells.
(A) Mice of the indicated genotypes were infected with N. brasiliensis and immunofluorescence analyses in the intestine were conducted 7 days post-infection to detect tuft cells (Dclk1+ cells in red) as well as Stat6 phosphorylation (in green). (BD) Mice of the indicated genotypes were treated or not with recombinant IL-13 (rIL-13) for 4 days (B) or with the Notch inhibitor DBZ (C, D), and the resulting intestines were subjected to immunohistochemistry analyses to quantify goblet cells (Alcian Blue+ cells) (B, D) or enteroendocrine cells (Chromogranin A+ cells (C) (top panels). At the bottom, a quantification is provided (mean values ± SEM; Mann–Whitney test, n = 3 and n ≥ 3 for IL-13 and DBZ treatments, respectively). Source data are available online for this figure.
Figure EV3
Figure EV3. Single-cell RNA sequencing analysis of mouse intestinal epithelium.
(A) Cell-type clustering. Two-dimensional graphical representation of the cell-type clustering in the small intestine of both Elp3WT and Elp3ΔIEC mice after overnight rIL-13 treatment (n = 4 pooled mice). (B, C) Cell-type signatures in mouse intestinal epithelium. UMAP showing expression and distribution of representative genes in clusters from A (B). Heatmap of cluster marker genes in the small intestine of both Elp3WT and Elp3ΔIEC mice after overnight rIL-13 treatment (n = 2 pooled mice per genotype) (C).
Figure EV4
Figure EV4. Atf4 overexpression in mouse intestinal epithelium inhibits tuft cell differentiation.
(A) Atf4 overexpression in IECs deregulates the body weight. A quantification of 8 weeks old WT and TgAtf4IEC mice body weight (mean values ± SEM; Student t-test; n ≥ 3 for females and n = 4 for males; **p < 0.01, ***p < 0.001) is illustrated. (B) Atf4 overexpression in IECs shortens the length of both small intestines and colons. A quantification of both intestine and colon lengths in WT (n = 7) and TgAtf4 IEC (n = 8) mice (mean values ± SEM; Student t-test; *p < 0.05, **p < 0.01) is illustrated. (C) Atf4 overexpression in the intestinal epithelium does not change S6 phosphorylation but enhances 4EBP1 protein levels. Extracts from the intestinal epithelium of both WT and TgAtf4IEC mice were subjected to western blot analyses. (D) Atf4 overexpression in IECs does not trigger the canonical UPR pathway upon helminth infection. Extracts from both WT and TgAtf4IEC mice naive or infected with N. brasiliensis for 7 days were subjected to western blot analyses using the indicated antibodies. Note that the anti-Atf4 blot is identical to the one illustrated in Fig. 10F. (E) Defective mRNA induction of Retnlβ upon helminth infection in Atf4-overexpressing IECs. Mice of the indicated genotypes were infected or not with N. brasiliensis for 7 days and total RNAs were subjected to real-time PCRs. Retnlβ mRNA levels were quantified and normalization was calculated on the average of the two housekeeping genes Gapdh and 36b4 (mean values ± SEM; Mann–Whitney test; n ≥ 3; *p < 0.05, **p < 0.01). (F) IL-13-dependent Stat6 phosphorylation does not change upon Atf4 overexpression. WT and TgAtf4IEC mice were treated or not with rIL-13 for 2 hours, and the resulting extracts were subjected to western blot analyses. (G) IL-13-dependent goblet cell expansion is similar in intestines from WT and TgAtf4IEC mice. Immunostainings and quantifications (right and left panels, respectively) of goblet cells (Alcian Blue+ cells) in intestines from WT and TgAtf4 mice treated or not with rIL-13 for 4 days (mean values ± SEM; Mann–Whitney test; n ≥ 3 mice; *p < 0.05) are illustrated. (H, I) Atf4 overexpression in ex-vivo organoids induces the expression of Atf4 target genes but does not change levels of epithelial cell markers. mRNA levels of Atf4 target genes (Asns and Atf5) (H) and IEC population markers (I) in ex-vivo organoids extracted from WT and TgAtf4IEC mice (ratio to WT organoids) were quantified by real-time PCRs. Normalization was calculated on the average of the three housekeeping genes Gapdh, β-Actin and 36b4 (mean values ± SEM; Student t-test ; n = 3; *p < 0.05). (J) IL-13-dependent goblet cell expansion is not reduced in ex-vivo organoids from TgAtf4IEC mice. Immunostainings and quantifications (right and left panels, respectively) of goblet cells (Mucin2+ cells in green) in ex-vivo organoids of WT and TgAtf4 mice treated or not with mIL-13 (mean values ± SEM; Mann–Whitney test; n ≥ 6 organoids from n = 2 mice; **p < 0.01) are illustrated. Source data are available online for this figure.

References

    1. Aladegbami B, Barron L, Bao J, Colasanti J, Erwin C, Warner B, Guo J (2017) Epithelial cell specific Raptor is required for initiation of type 2 mucosal immunity in small intestine. Nat Sci Rep 7:5580 - PMC - PubMed
    1. Balasubramanian M, Butterworth E, Kilberg M (2013) Asparagine synthetase: regulation by cell stress and involvement in tumor biology. Am J Physiol Endocrinol Metab 304:E789–E799 10.1152/ajpendo.00015.2013 - DOI - PMC - PubMed
    1. Barbosa-Tessmann I, Chen C, Zhong C, Schuster S, Nick H, Kilberg M (1999) Activation of the unfolded protein response pathway induces human asparagine synthetase gene expression. J Biol Chem 274:31139–31144 10.1074/jbc.274.44.31139 - DOI - PubMed
    1. Bauer F, Matsuyama A, Candiracci J, Dieu M, Scheliga J, Wolf DA, Yoshida M, Hermand D (2012) Translational control of cell division by elongator. Cell Rep 1:424–433 10.1016/j.celrep.2012.04.001 - DOI - PMC - PubMed
    1. Beumer J, Clevers H (2021) Cell fate specification and differentiation in the adult mammalian intestine. Nat Rev Mol Cell Biol 22:39–53 10.1038/s41580-020-0278-0 - DOI - PubMed

MeSH terms

Substances