. 2024 Jul 31;22(1):457.
doi: 10.1186/s12951-024-02728-6.

Static magnetic field-modulated mesenchymal stem cell-derived mitochondria-containing microvesicles for enhanced intervertebral disc degeneration therapy

Affiliations

Static magnetic field-modulated mesenchymal stem cell-derived mitochondria-containing microvesicles for enhanced intervertebral disc degeneration therapy

Pengzhi Shi et al. J Nanobiotechnology. .

Abstract

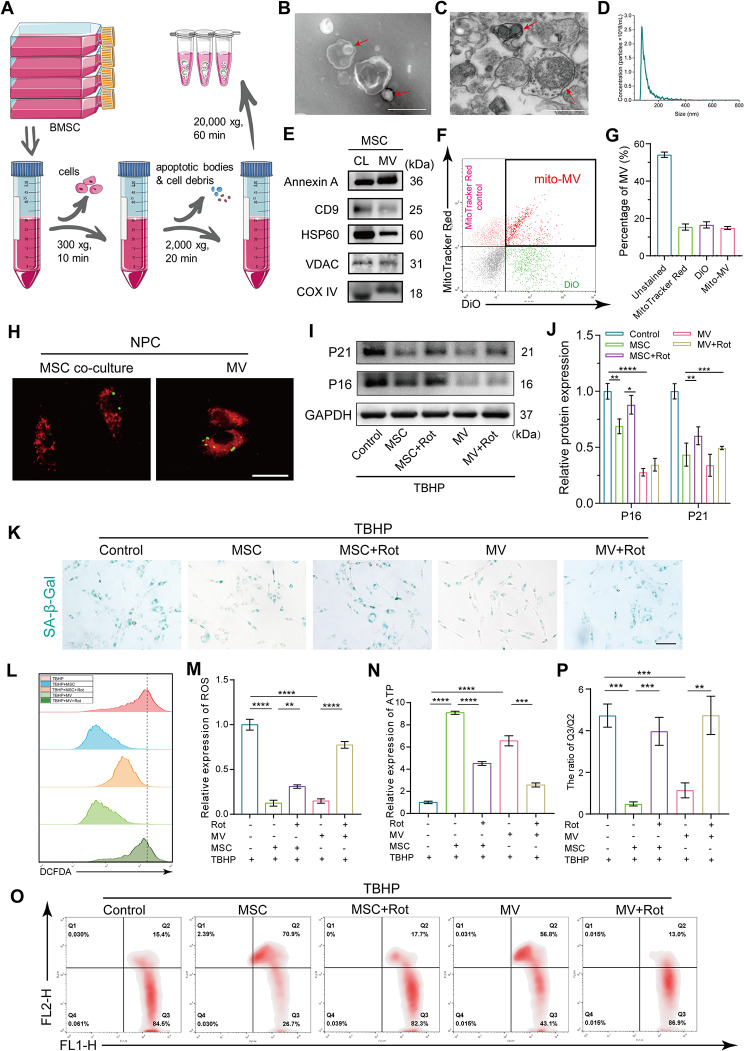
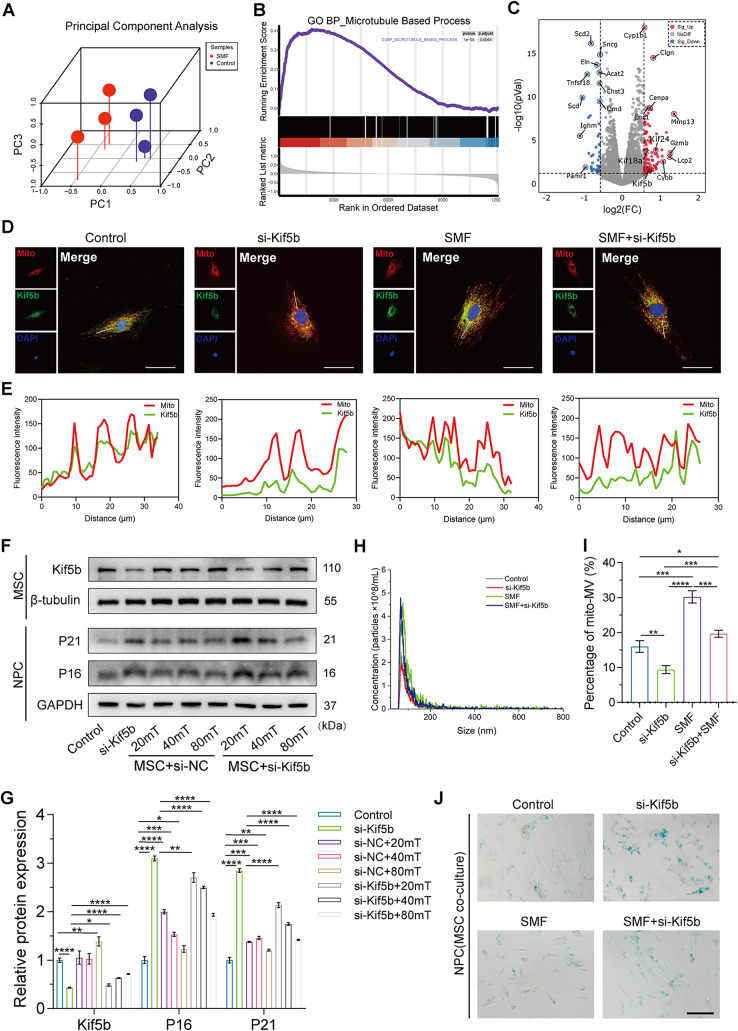
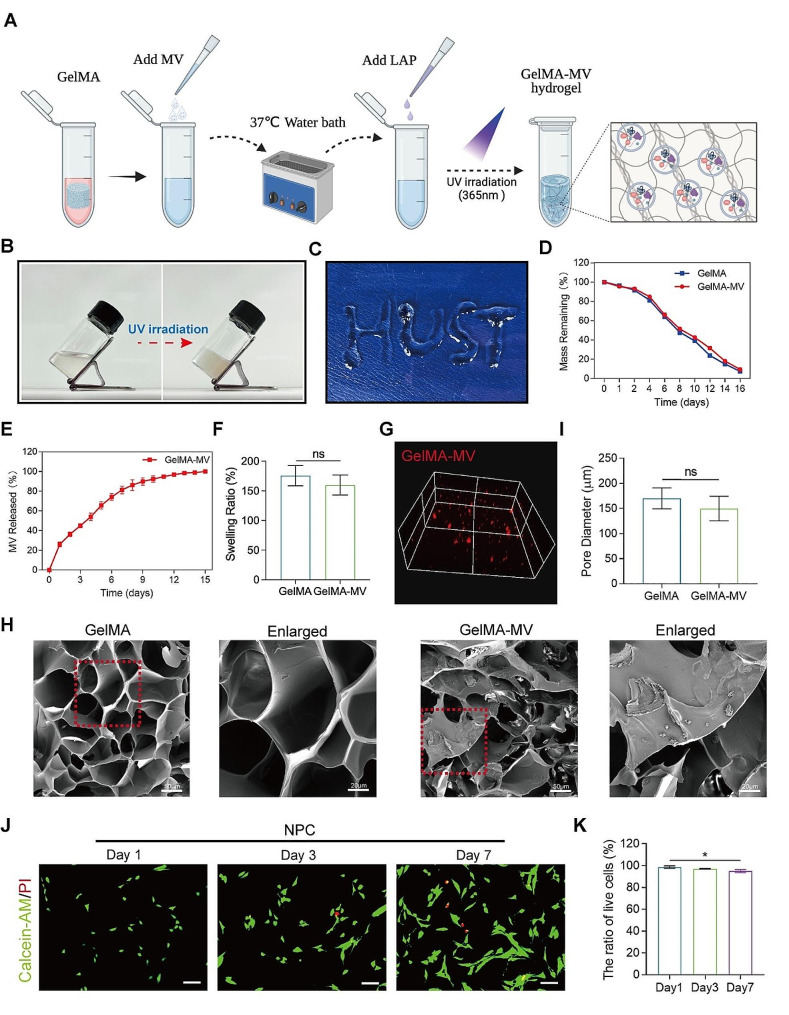
Intervertebral disc degeneration (IVDD) is characterized by the senescence and declining vitality of nucleus pulposus cells (NPCs), often driven by mitochondrial dysfunction. This study elucidates that mesenchymal stem cells (MSCs) play a crucial role in attenuating NPC senescence by secreting mitochondria-containing microvesicles (mitoMVs). Moreover, it demonstrates that static magnetic fields (SMF) enhance the secretion of mitoMVs by MSCs. By distinguishing mitoMV generation from exosomes, this study shifts focus to understanding the molecular mechanisms of SMF intervention, emphasizing cargo transport and plasma membrane budding processes, with RNA sequencing indicating the potential involvement of the microtubule-based transport protein Kif5b. The study further confirms the interaction between Rab22a and Kif5b, revealing Rab22a's role in sorting mitoMVs into microvesicles (MVs) and potentially mediating subsequent plasma membrane budding. Subsequent construction of a gelatin methacrylate (GelMA) hydrogel delivery system further addresses the challenges of in vivo application and verifies the substantial potential of mitoMVs in delaying IVDD. This research not only sheds light on the molecular intricacies of SMF-enhanced mitoMV secretion but also provides innovative perspectives for future IVDD therapeutic strategies.

Keywords: Intervertebral disc degeneration; Mesenchymal stem cell; Microvesicle; Mitochondrial; Static magnetic field.


Conflict of interest statement

The authors declare no competing interests.

Figures

Scheme. 1
Scheme. 1
The static magnetic field (SMF) enhances the mitochondrial transport capacity of Kif5b and promotes the interaction between Kif5b and Rab22a, facilitating the sorting of mitochondria into microvesicles (MV) derived from mesenchymal stem cells (MSCs) and membrane budding. MitoMV obtained after SMF intervention, when encapsulated in hydrogels, demonstrates significant therapeutic efficacy in the treatment of intervertebral disc degeneration (IVDD)
Fig. 1
Fig. 1
MSCs co-culture alleviated senescence of NPCs and mitochondrial dysfunction. (A) Representative MRI images and immunohistochemistry of senescence marker P16, P21 of HNP tissues with different degenerative degrees. (Scale bar: 100 μm–50 μm) (B) The percentage of P16, P21 positive cells in HNP tissues in Fig. 1A. (C and D) Western blot analysis and quantification of the protein expression levels of P16 and P21 in HNP tissues with different degenerative degrees. (E and F) NPCs were pretreated with 100 µM TBHP for 12 h and followed by MSCs co-culture for 48 h in transwell system. The expression of P16 and P21 was analyzed by western blot and image J. (G) Representative SA-β-Gal activity staining images of NPCs. NPCs were pretreated with 100 µM TBHP for 12 h and followed by coculturing with MSCs for 48 h in transwell system. (Scale bar: 100 μm) (H and I) The level of ROS and quantification of NPCs after the interventions in Fig. 1G. (J) The quantification of ATP generation of NPCs after the interventions in Fig. 1G. (K and L) The change of mitochondrial membrane potential and quantification of NPCs after the interventions in Fig. 1G. Data are represented as mean ± SD. *p < 0.05, **p < 0.01, ***p < 0.001, ****p < 0.0001
Fig. 2
Fig. 2
MitoMVs released by MSCs alleviated NPCs senescence and mitochondrial dysfunction. (A) MVs isolation schema. The supernatant of MSCs were collected and centrifuged according sequential centrifugation methods to get MVs. (B) TEM assay demonstrated negative-stain morphology images of MVs and its contains. (Scale bar: 500 nm) (C) TEM assay demonstrated cross-sectioned images of MVs and its contains after resin embedding. Mitochondria containing mitochondrial cristae structures can be clearly seen in the MVs. (Scale bar: 500 nm) (D) NTA demonstrated the concentration and size of MVs. (E) The protein marker of MVs (CD9, Annexin A) and proteins from the inner mitochondrial membrane, outer membrane, and mitochondrial matrix (HSP60, VDAC and COX IV) were analyzed by western blot. MSC whole cell lysate was used as a control. (F) MSCs were labeled with Mito-Tracker Red (red) and DiO (green), and MVs were isolated from MSCs supernatant and analyzed by flow cytometry. The Mito-Tracker Red single positive was marked as free mitochondria, the DiO single positive was labeled as MVs, and the Mito-Tracker Red-DiO double positive were mitochondria-containing MVs. (G) The quantification analysis of different subsets of MVs labeled with different dyes. (H) Representative fluorescence images of mitochondrial transfer in transwell culture system. NPCs labeled with mito-Tracker Red CMXRos (red) in the lower chambers were co-culture with mito-Tracker Green-labeled MSCs (green) from the upper inserts or isolated MVs (1 × 10^9/mL). (Scale bar: 50 μm) (I and J) NPCs seeded in the lower chambers were treated with 100 µM TBHP for 12 h and followed co-culture for 48 h with MSCs from the upper inserts or isolated MVs (1 × 10^9/mL), or pretreated MSC or MVs with 1 µM rotenone. The expression of senescence markers (P16 and P21) was analyzed by western blot and image J. (K) Representative SA-β-Gal activity staining images. NPCs seeded in the lower chambers were treated with 100 µM TBHP for 12 h and followed co-culture for 48 h with MSCs from the upper inserts or isolated MVs, or pretreated MSC or MVs (1 × 10^9/mL) with 1 µM rotenone. (Scale bar: 100 μm) (L and M) The level of ROS and quantification of NPCs after the interventions in Fig. 2K. (N) The quantification of ATP generation of NPCs after the interventions in Fig. 2K. (O and P) The change of mitochondrial membrane potential and quantification of NPCs after the interventions in Fig. 2K. Data are represented as mean ± SD. *p < 0.05, **p < 0.01, ***p < 0.001, ****p < 0.0001
Fig. 3
Fig. 3
SMF enhances mitoMVs secretion and further alleviates NPCs senescence. (A) CCK-8 assay was used to detect the cell viability of MSCs after culturing with different magnetic field strengths. 20–80 mT and 72 h was selected as the follow-up intervention condition.(B and C) Representative images and quantification of EdU assay. The proliferative capacity of MSCs after different magnetic fields pretreatment was analyzed by EdU assay. (Scale bar: 50 μm) (D) NTA demonstrated the concentration and size of MVs secreted after intervention with different magnetic field strengths. (E) The schema of MSCs co-cultured with NPCs in transwell system. MSCs pretreatment with SMF were digested and seeded into the upper inserts, and then co-cultured with NPCs seeded in the lower chambers. This schema was created by Biorender. (F) Representative images of mitochondrial transfer in transwell culture system. NPCs labeled with mito-Tracker Red CMXRos (red) in the lower chambers were co-culture with mito-Tracker Green-labeled MSCs (green) after different magnetic fields pretreatment from the upper inserts. (Scale bar: 50 μm) (G) The quantification analysis of mitoMVs. The mito-Tracker Red and DiO-labeled MSCs were cultured in the different magnetic fields, and the MVs were isolated from MSCs supernatant and assessed the percentage of mitoMVs by flow cytometry. (H and I) NPCs seeded in the lower chambers were pretreated with 100 µM TBHP and followed co-culture with MSCs from the upper inserts or isolated MVs (1 × 10^9/mL) after different magnetic fields pretreatment. The expression of senescence markers (P16 and P21) was analyzed by western blot and image J. (J) Representative SA-β-Gal activity staining images. NPCs seeded in the lower chambers were pretreated with 100 µM TBHP and followed co-culture with MSCs from the upper inserts or isolated MVs (1 × 10^9/mL) after different magnetic fields pretreatment. Then the SA-β-Gal staining was processed. (Scale bar: 100 μm) Data are represented as mean ± SD. *p < 0.05, **p < 0.01, ***p < 0.001, ****p < 0.0001
Fig. 4
Fig. 4
SMF enhances mitoMV secretion by enhancing mitochondrial transport by Kif5b in the cytoplasm. (A) Principal component analysis (PCA) of MSCs RNA sequencing data. (B) GSEA analysis of sequencing data demonstrated microtubule-based process of MSCs was enriched after treated with 40 mT SMF. (C) Volcano plot shows the differentially expressed genes of MSCs treated with SMF versus untreated. (D and E) Representative colocalization immunofluorescence images and quantification in MSCs. After transfection with si-Kif5b, MSCs were cultured with 40 mT SMF to assess colocalization of Kif5b (green) and mitochondrial (red). (Scale bar: 25 μm) (F and G) The level of protein expression and quantification of P16, P21 and Kif5b. After transfection with si-Kif5b or si-NC, MSCs were cultured with different magnetic fields and followed co-culture with NPCs pretreated with 100 µM TBHP for 48 h. (H) NTA demonstrated the concentration and size of MVs. After transfection with si-Kif5b, MSCs were cultured with 40 mT SMF for 72 h, and the MVs were isolated and analyzed from MSCs supernatant. (I) The quantification analysis of mitoMVs. After transfection with si-Kif5b, the mito-Tracker Red and DiO-labeled MSCs were cultured with 40 mT SMF for 72 h, and the MVs were isolated from MSCs supernatant and assessed the percentage of mitoMVs by flow cytometry. (J) Representative SA-β-Gal activity staining images of NPCs. After transfection with si-Kif5b, MSCs were cultured with 40 mT SMF for 72 h and followed co-culture with NPCs pretreated with 100 µM TBHP for 48 h. (Scale bar: 100 μm). Data are represented as mean ± SD. *p < 0.05, **p < 0.01, ***p < 0.001, ****p < 0.0001
Fig. 5
Fig. 5
SMF enhances the interaction between Kif5b and Rab22a, and promotes the secretion of mitoMVs. (A and B) CO-IP assays were performed to measure the interactions between Kif5b and Rab22a in MSCs.Anti-Kif5b antibodies were used for CO-IP. (C) The coimmunoprecipitated protein was stained by Coomassie blue to demonstrates protein interaction between Kif5b and Rab22a. (D) CO-IP assays were performed to measure the change of interactions between Kif5b and Rab22a in MSCs pretreated with SMF. MSCs were cultured with 40 mT SMF for 72 h, and anti-Kif5b antibodies were used for CO-IP. (E) The coimmunoprecipitated protein was stained by Coomassie blue to demonstrates the change of interactions between Kif5b and Rab22a in MSCs pretreated with 40 mT SMF for 72 h. (F) Representative immunofluorescence images of colocalization of mitochondrial, Kif5b and Rab22a in MSCs. MSCs were pre-cultured with different magnetic field strengths for 72 h, and confocal microscopy was used to analyze the colocalization of mitochondrial (red), Kif5b (green) and Rab22a (blue). (Scale bar: 25 μm–10 μm) (G) Representative immunofluorescence images of colocalization of mitochondrial, Kif5b and Rab22a in MSCs. After transfection with si-Kif5b or si-Rab22a, MSCs were cultured with 40 mT SMF for 72 h, and confocal microscopy was used to analyze the colocalization of mitochondrial (red), Kif5b (green) and Rab22a (blue). (Scale bar: 25 μm–10 μm) (H) NTA demonstrated the concentration and size of MVs. After transfection with si-Rab22a, MSCs were cultured with 40 mT SMF for 72 h and the MVs were isolated and analyzed from MSCs supernatant. (I) The quantification analysis of mitoMVs. After transfection with si-Rab22a, the mito-Tracker Red and DiO-labeled MSCs were cultured with 40 mT SMF for 72 h, and the MVs were isolated from MSCs supernatant and assessed the percentage of mitoMVs by flow cytometry. Data are represented as mean ± SD. *p < 0.05, **p < 0.01, ***p < 0.001, ****p < 0.0001
Fig. 6
Fig. 6
Synthesis and characterization of GelMA-MVs hydrogel sustained-release systems. (A) Schematic diagram of the synthesis process of the GelMA-MVs hydrogel sustained-release system. This figure was created by biorender. (B) Fluidable GelMA hydrogel transformed into concrete hydrogel via 365 nm photo- crosslinking. (C) The injectable GelMA hydrogel demonstrates the ability to vary the shape. (D) The degradation properties of GelMA and GelMA-MVs hydrogel in vitro. (E) GelMA-MVs hydrogels demonstrate the retardation property of MVs release in vitro. (F) The swelling properties of GelMA and GelMA-MVs hydrogel in vitro. (G) Confocal microscope shows the spatial distribution of DiR-labeled MVs (red) in the GelMA hydrogel. (H) The GelMA and GelMA-MVs hydrogel possesses a sparse, porous structure and surface scattered MVs observed by SEM after Lyophilization treatment. (Scale bar: 50 μm–20 μm) (I) The pore diameter comparison of GelMA and GelMA-MVs hydrogel. (J and K) Live/dead assay and quantitative analysis demonstrated the biocompatibility of NPCs cultured with GelMA hydrogels for 1, 3, 7 days. (Scale bar: 100 μm) Data are represented as mean ± SD. *p < 0.05, **p < 0.01, ***p < 0.001, ****p < 0.0001
Fig. 7
Fig. 7
GelMA-MVs hydrogel sustained-release systems rescues IVDD in vivo. (A) Schematic diagram of the synthesis process of the GelMA-MVs hydrogel sustained-release system. This figure was created by biorender. (B) Representative fluorescence images of MVs in the IVD. DiR-labeled MVs (1 × 10^10/mL) were injected into IVD and in vivo imaging was performed at 0, 3, 7, 10 days, respectively. (C-E) Representative MRI images, quantification of Pfirrmann grades and DHI of IVD. (F-H) Representative images of H&E, Safranin fast-O green and alcian blue staining of IVD tissues. (Scale bar: 2.5–250 μm) (I) Quantification of histological grade of IVD tissues based on histological staining images. (J and K) Representative immunofluorescence images of senescence marker P16, P21 (Red) of IVD tissues and quantification analysis in different groups. (Scale bar: 250 μm) Data are represented as mean ± SD. *p < 0.05, **p < 0.01, ***p < 0.001, ****p < 0.0001

References

    1. Manchikanti L, Singh V, Falco FJ, Benyamin RM, Hirsch JA. Epidemiology of low back pain in adults. Neuromodulation. 2014;17(Suppl 2):3–10. 10.1111/ner.12018 - DOI - PubMed
    1. Diseases GBD, Injuries C. Global burden of 369 diseases and injuries in 204 countries and territories, 1990–2019: a systematic analysis for the global burden of Disease Study 2019. Lancet. 2020;396:1204–22. 10.1016/S0140-6736(20)30925-9 - DOI - PMC - PubMed
    1. Binch ALA, Fitzgerald JC, Growney EA, Barry F. Cell-based strategies for IVD repair: clinical progress and translational obstacles. Nat Rev Rheumatol. 2021;17:158–75. 10.1038/s41584-020-00568-w - DOI - PubMed
    1. Zheng CJ, Chen J. Disc degeneration implies low back pain. Theor Biol Med Model. 2015;12:24. 10.1186/s12976-015-0020-3 - DOI - PMC - PubMed
    1. Samanta A, Lufkin T, Kraus P. Intervertebral disc degeneration-current therapeutic options and challenges. Front Public Health. 2023;11:1156749. 10.3389/fpubh.2023.1156749 - DOI - PMC - PubMed

LinkOut - more resources