

Metastasis and basement membrane-related signature enhances hepatocellular carcinoma prognosis and diagnosis by integrating single-cell RNA sequencing analysis and immune microenvironment assessment
- PMID: 39085893
- PMCID: PMC11293133
- DOI: 10.1186/s12967-024-05493-0
Metastasis and basement membrane-related signature enhances hepatocellular carcinoma prognosis and diagnosis by integrating single-cell RNA sequencing analysis and immune microenvironment assessment
Abstract
Background: Hepatocellular carcinoma (HCC) is the most common type of primary liver cancer and second leading cause of cancer-related deaths worldwide. The heightened mortality associated with HCC is largely attributed to its propensity for metastasis, which cannot be achieved without remodeling or loss of the basement membrane (BM). Despite advancements in targeted therapies and immunotherapies, resistance and limited efficacy in late-stage HCC underscore the urgent need for better therapeutic options and early diagnostic biomarkers. Our study aimed to address these gaps by investigating and evaluating potential biomarkers to improve survival outcomes and treatment efficacy in patients with HCC.
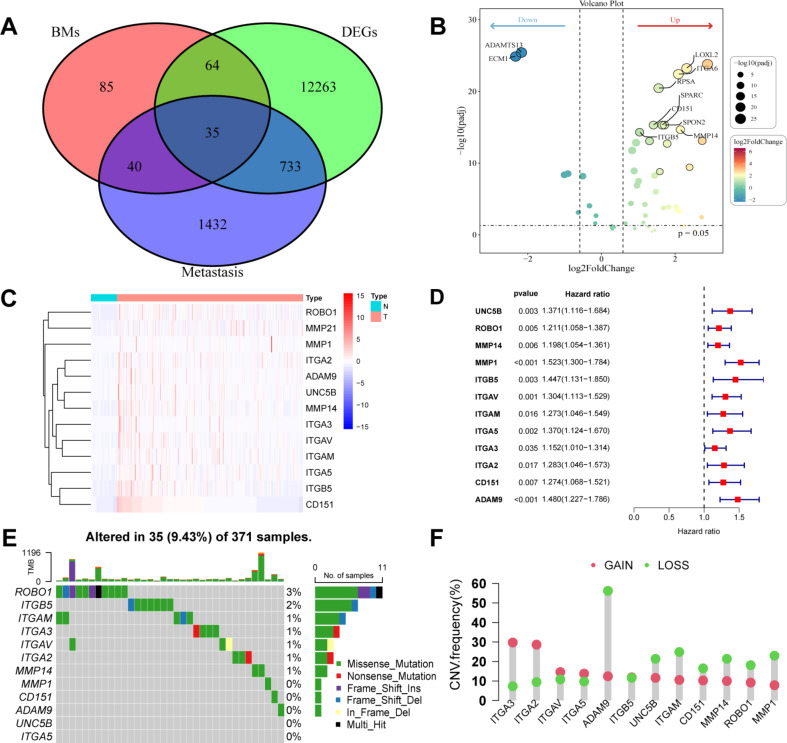
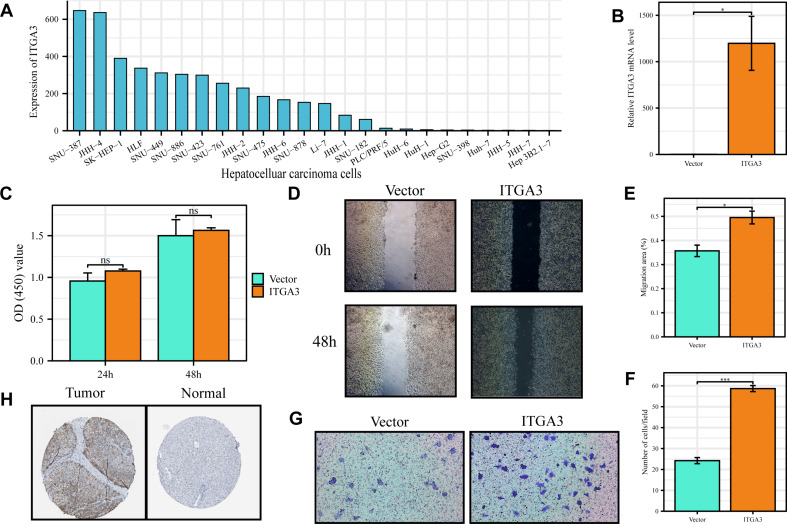
Method: In this study, we collected the transcriptome sequencing, clinical, and mutation data of 424 patients with HCC from The Cancer Genome Atlas (TCGA) and 240 from the International Cancer Genome Consortium (ICGC) databases. We then constructed and validated a prognostic model based on metastasis and basement membrane-related genes (MBRGs) using univariate and multivariate Cox regression analyses. Five immune-related algorithms (CIBERSORT, QUANTISEQ, MCP counter, ssGSEA, and TIMER) were then utilized to examine the immune landscape and activity across high- and low-risk groups. We also analyzed Tumor Mutation Burden (TMB) values, Tumor Immune Dysfunction and Exclusion (TIDE) scores, mutation frequency, and immune checkpoint gene expression to evaluate immune treatment sensitivity. We analyzed integrin subunit alpha 3 (ITGA3) expression in HCC by performing single-cell RNA sequencing (scRNA-seq) analysis using the TISCH 2.0 database. Lastly, wound healing and transwell assays were conducted to elucidate the role of ITGA3 in tumor metastasis.
Results: Patients with HCC were categorized into high- and low-risk groups based on the median values, with higher risk scores indicating worse overall survival. Five immune-related algorithms revealed that the abundance of immune cells, particularly T cells, was greater in the high-risk group than in the low-risk group. The high-risk group also exhibited a higher TMB value, mutation frequency, and immune checkpoint gene expression and a lower tumor TIDE score, suggesting the potential for better immunotherapy outcomes. Additionally, scRNA-seq analysis revealed higher ITGA3 expression in tumor cells compared with normal hepatocytes. Wound healing scratch and transwell cell migration assays revealed that overexpression of the MBRG ITGA3 enhanced migration of HCC HepG2 cells.
Conclusion: This study established a direct molecular correlation between metastasis and BM, encompassing clinical features, tumor microenvironment, and immune response, thereby offering valuable insights for predicting clinical outcomes and immunotherapy responses in HCC.
Keywords: Basement membrane; Hepatocellular carcinoma; Immunotherapy Response; Metastasis; Prognostic model; ScRNA-seq.
© 2024. The Author(s).
Conflict of interest statement
The authors declare that they have no conflicts of interest regarding the publication of this paper.
Figures


Similar articles
-
Multi-omics identification of a polyamine metabolism related signature for hepatocellular carcinoma and revealing tumor microenvironment characteristics.Front Immunol. 2025 Apr 22;16:1570378. doi: 10.3389/fimmu.2025.1570378. eCollection 2025. Front Immunol. 2025. PMID: 40330470 Free PMC article.
-
Integrated Analysis of Single-Cell and Bulk RNA-Sequencing Defines N7-Methylguanosine (m7G)-Mediated Modifications' Role in Prognosis and the Tumor Immune Microenvironment in Hepatocellular Carcinoma.Cancer Med. 2025 Jun;14(11):e70992. doi: 10.1002/cam4.70992. Cancer Med. 2025. PMID: 40485623 Free PMC article.
-
Single-cell and bulk transcriptomic datasets enable the development of prognostic models based on dynamic changes in the tumor immune microenvironment in patients with hepatocellular carcinoma and portal vein tumor thrombus.Front Immunol. 2024 Oct 28;15:1414121. doi: 10.3389/fimmu.2024.1414121. eCollection 2024. Front Immunol. 2024. PMID: 39530087 Free PMC article.
-
m6A epitranscriptomic modification in hepatocellular carcinoma: implications for the tumor microenvironment and immunotherapy.Front Immunol. 2025 Feb 17;16:1538658. doi: 10.3389/fimmu.2025.1538658. eCollection 2025. Front Immunol. 2025. PMID: 40034695 Free PMC article. Review.
-
Unraveling the Heterogeneity of Tumor Immune Microenvironment in Hepatocellular Carcinoma by SingleCell RNA Sequencing and its Implications for Prognosis and Therapeutic Response.Turk J Gastroenterol. 2024 Nov 28;35(12):876-888. doi: 10.5152/tjg.2024.24118. Turk J Gastroenterol. 2024. PMID: 39641225 Free PMC article. Review.
Cited by
-
Transcriptome-wide analysis reveals potential roles of CFD and ANGPTL4 in fibroblasts regulating B cell lineage for extracellular matrix-driven clustering and novel avenues for immunotherapy in breast cancer.Mol Med. 2025 May 8;31(1):179. doi: 10.1186/s10020-025-01237-y. Mol Med. 2025. PMID: 40340806 Free PMC article.
References
-
- Llovet JM et al. Mar., Immunotherapies for hepatocellular carcinoma, Nat. Rev. Clin. Oncol, 2022;19(3):151-172, 10.1038/s41571-021-00573-2. - PubMed
-
- Zhou H-C, et al. Dual and opposing roles of the androgen receptor in VETC-dependent and invasion-dependent metastasis of hepatocellular carcinoma. J Hepatol. Oct. 2021;75(4):900–11. 10.1016/j.jhep.2021.04.053. - PubMed
MeSH terms
Substances
Grants and funding
- 2019A1515012007/Natural Science Foundation of Guangdong Province
- S202310571044/Innovation and Entrepreneurship Project for College Students in Guangdong
- S202310571097/Innovation and Entrepreneurship Project for College Students in Guangdong
- S202210571117/Innovation and Entrepreneurship Project for College Students in Guangdong
LinkOut - more resources
Full Text Sources
Medical
Miscellaneous
