

Meta-analysis identifies common gut microbiota associated with multiple sclerosis
- PMID: 39085949
- PMCID: PMC11293023
- DOI: 10.1186/s13073-024-01364-x
Meta-analysis identifies common gut microbiota associated with multiple sclerosis
Abstract
Background: Previous studies have identified a diverse group of microbial taxa that differ between patients with multiple sclerosis (MS) and the healthy population. However, interpreting findings on MS-associated microbiota is challenging, as there is no true consensus. It is unclear whether there is gut microbiota commonly altered in MS across studies.
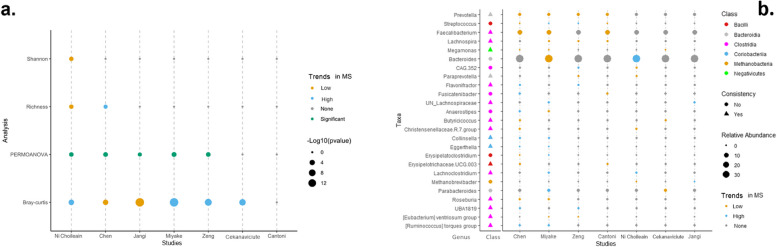
Methods: To answer this, we performed a meta-analysis based on the 16S rRNA gene sequencing data from seven geographically and technically diverse studies comprising a total of 524 adult subjects (257 MS and 267 healthy controls). Analysis was conducted for each individual study after reprocessing the data and also by combining all data together. The blocked Wilcoxon rank-sum test and linear mixed-effects regression were used to identify differences in microbial composition and diversity between MS and healthy controls. Network analysis was conducted to identify bacterial correlations. A leave-one-out sensitivity analysis was performed to ensure the robustness of the findings.
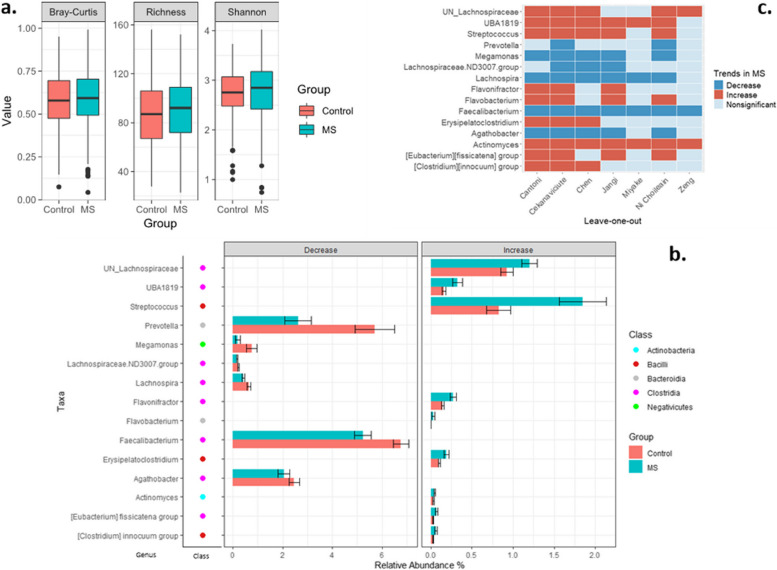
Results: The microbiome community structure was significantly different between studies. Re-analysis of data from individual studies revealed a lower relative abundance of Prevotella in MS across studies, compared to controls. Meta-analysis found that although alpha and beta diversity did not differ between MS and controls, a higher abundance of Actinomyces and a lower abundance of Faecalibacterium were reproducibly associated with MS. Additionally, network analysis revealed that the recognized negative Bacteroides-Prevotella correlation in controls was disrupted in patients with MS.
Conclusions: Our meta-analysis identified common gut microbiota associated with MS across geographically and technically diverse studies.
Keywords: Faecalibacterium; Prevotella; Meta-analysis; Microbiota; Multiple sclerosis.
© 2024. The Author(s).
Conflict of interest statement
YZ holds shares at General Biomics Inc. HT has, in the last 5 years, received research support from the Canada Research Chair Program, the National Multiple Sclerosis Society, the Canadian Institutes of Health Research, the Multiple Sclerosis Society of Canada, the Multiple Sclerosis Scientific Research Foundation, and the EDMUS Foundation (“Fondation EDMUS contre la sclérose en plaques”) and, in addition, in the last 5 years, has had travel expenses or registration fees prepaid or reimbursed to present at CME conferences from the Consortium of MS Centres (2018), National MS Society (2018), ECTRIMS/ACTRIMS (2017–2022), and American Academy of Neurology (2019). Speaker honoraria are either declined or donated to an MS charity or to an unrestricted grant for use by HT’s research group. EEL has received honoraria over the last 5 years for consulting for Bristol Myers Squibb, Genentech, TG Therapeutics, NGM Bio, Janssen, Biogen, Genzyme, Alexion, EMD Serono, Celgene, and Teva. She has received research support from Genentech, the National Institutes of Health (NIH K23 NS107624 and KL2 TR001862), the Race to Erase MS, and the Robert E Leet and Clara Guthrie Patterson Trust. She is an assistant editor for
Figures


References
-
- Katz Sand I, Zhu Y, Ntranos A, Clemente JC, Cekanaviciute E, Brandstadter R, Crabtree-Hartman E, Singh S, Bencosme Y, Debelius J, et al. Disease-modifying therapies alter gut microbial composition in MS. Neurol Neuroimmunol Neuroinflamm. 2019;6:e517. 10.1212/NXI.0000000000000517 - DOI - PMC - PubMed
-
- Cekanaviciute E, Yoo BB, Runia TF, Debelius JW, Singh S, Nelson CA, Kanner R, Bencosme Y, Lee YK, Hauser SL, et al. Gut bacteria from multiple sclerosis patients modulate human T cells and exacerbate symptoms in mouse models. Proc Natl Acad Sci U S A. 2017;114:10713–8. 10.1073/pnas.1711235114 - DOI - PMC - PubMed
Publication types
MeSH terms
Substances
Grants and funding
LinkOut - more resources
Full Text Sources
Medical
