. 2024 Oct 2;32(10):3712-3728.
doi: 10.1016/j.ymthe.2024.07.023. Epub 2024 Jul 31.

Dual neutralization of influenza virus hemagglutinin and neuraminidase by a bispecific antibody leads to improved antiviral activity

Affiliations

Dual neutralization of influenza virus hemagglutinin and neuraminidase by a bispecific antibody leads to improved antiviral activity

Romila Moirangthem et al. Mol Ther. .

Abstract

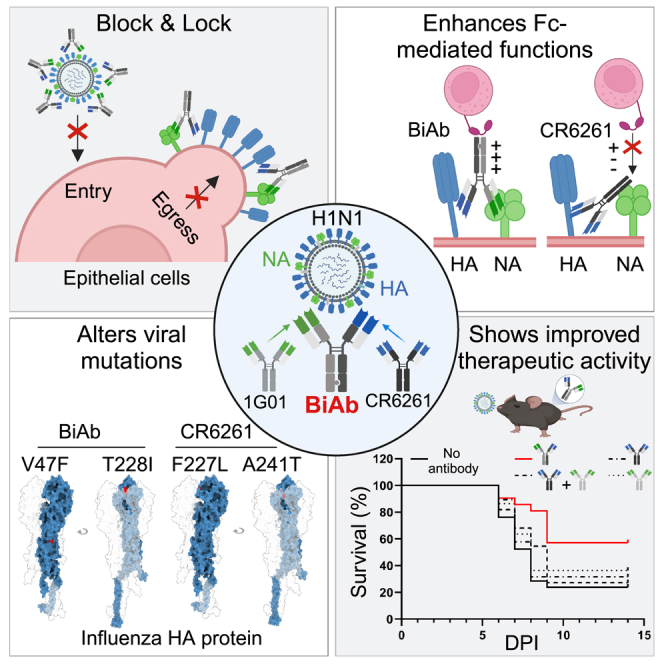
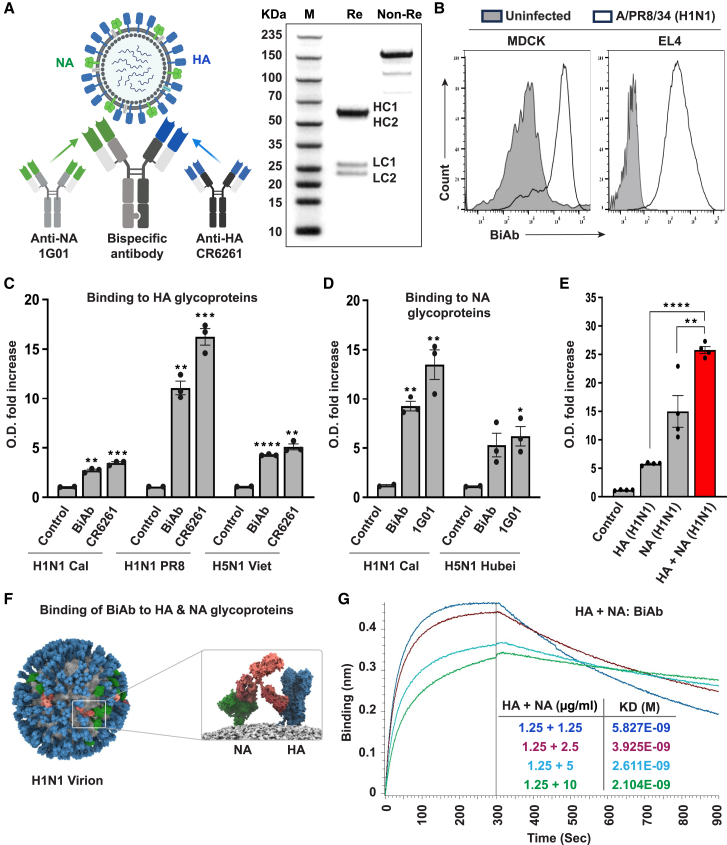
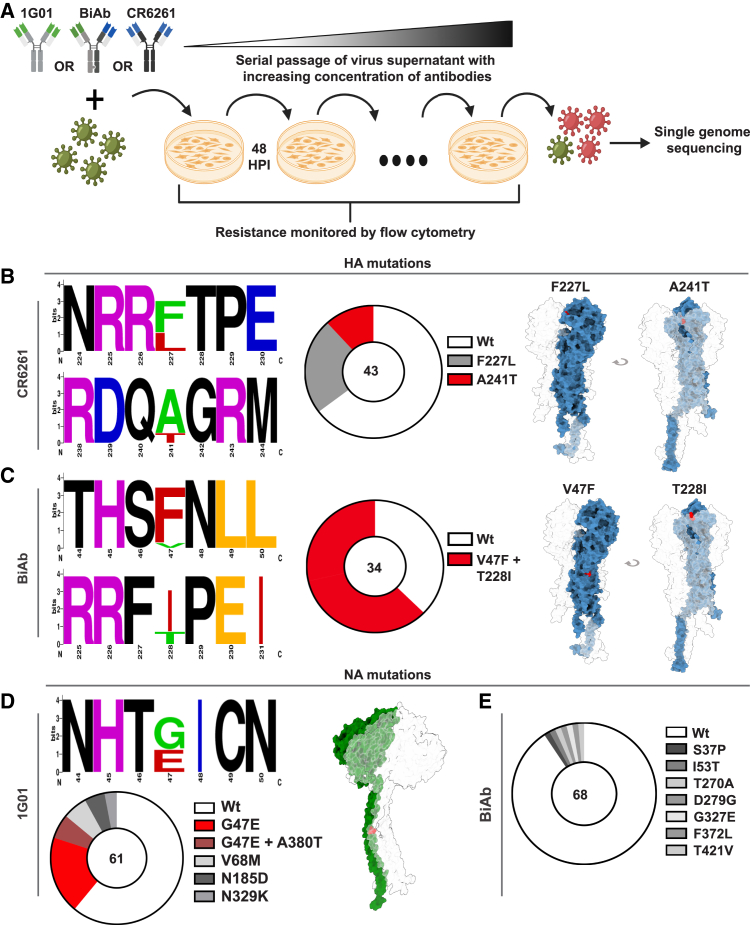
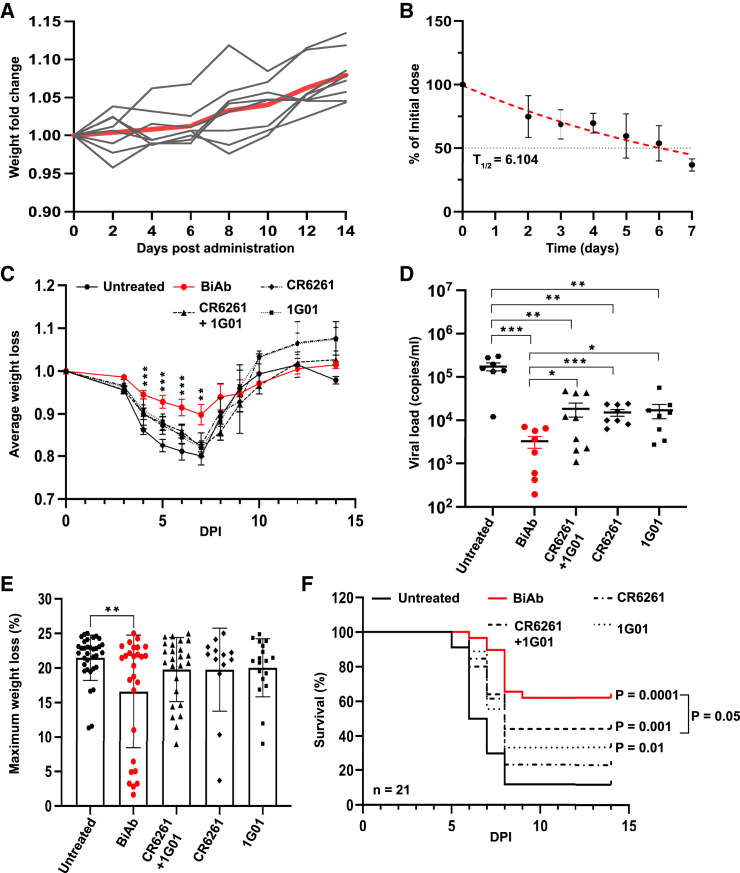
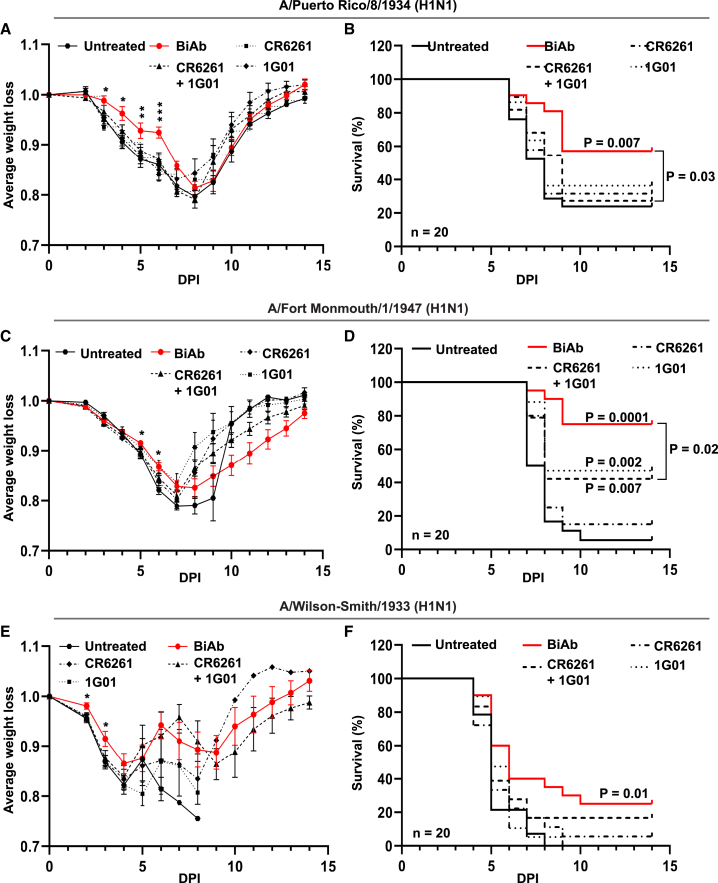
Targeting multiple viral proteins is pivotal for sustained suppression of highly mutable viruses. In recent years, broadly neutralizing antibodies that target the influenza virus hemagglutinin and neuraminidase glycoproteins have been developed, and antibody monotherapy has been tested in preclinical and clinical studies to treat or prevent influenza virus infection. However, the impact of dual neutralization of the hemagglutinin and neuraminidase on the course of infection, as well as its therapeutic potential, has not been thoroughly tested. For this purpose, we generated a bispecific antibody that neutralizes both the hemagglutinin and the neuraminidase of influenza viruses. We demonstrated that this bispecific antibody has a dual-antiviral activity as it blocks infection and prevents the release of progeny viruses from the infected cells. We show that dual neutralization of the hemagglutinin and the neuraminidase by a bispecific antibody is advantageous over monoclonal antibody combination as it resulted an improved neutralization capacity and augmented the antibody effector functions. Notably, the bispecific antibody showed enhanced antiviral activity in influenza virus-infected mice, reduced mice mortality, and limited the virus mutation profile upon antibody administration. Thus, dual neutralization of the hemagglutinin and neuraminidase could be effective in controlling influenza virus infection.

Keywords: antibodies; bispecific antibodies; influenza virus; passive immunization; viral immunity.


Conflict of interest statement

Declaration of interests A provisional patent on BiAb is currently being filed, in which Y.B.-O. and R.M. are inventors.

Figures

None
Graphical abstract
Figure 1
Figure 1
Binding of the BiAb to the HA and NA glycoproteins (A) Schematic representation of the BiAb and SDS-PAGE analysis of the purified BiAb under reducing and non-reducing conditions. Re, reducing conditions; Non-Re, non-reducing; HC, heavy chain; LC, light chain. (B) FACS staining of infected cells and influenza virus-coated cells. The right histogram shows the binding of the BiAb to virion-coated EL4 cells, and the left histogram shows the BiAb binding to influenza virus-infected cells (H1N1 A/PR/8/34). Gray histograms depict the binding of the BiAb to uninfected or uncoated cells. The figure shows a representative staining. Four independent experiments were performed. (C–E) Analysis of the BiAb binding in ELISA. ELISA plates were coated with 0.5 μg of HA glycoproteins, 0.5 μg of NA glycoprotein, or 0.5 μg of a combination of HA + NA (0.25 μg each) and stained with the BiAb, CR6261, or 1G01. HA and NA were derived from different influenza virus strains (indicated in the x axis). The y axis depicts the fold changes in OD levels in comparison with the background OD values that were measured for each antibody or for the control wells. The black asterisks represent the statistically significant differences between the control and the antibodies (BiAb, CR6261, and 1G01) in (C) and (D) (∗p < 0.05,∗∗p < 0.01, ∗∗∗p < 0.001, ∗∗∗∗p < 0.0001, unpaired Student’s t test) and between BiAb binding to both HA and NA or to a single glycoprotein in (E) (∗∗p < 0.01, ∗∗∗∗p < 0.0001, one-way ANOVA with Tukey’s multiple comparison test). Data are represented as mean ± SEM (n = 3). The figure shows a representative staining out of three independent experiments that were performed. (F) A molecular dynamic stimulation. A model of full H1N1 virion bound by the BiAb (left). viral membrane (gray), HA (blue), NA (green), and computationally predicted bound BiAb (coral). A zoomed image of a single BiAb bound to HA trimer and NA tetramer is shown on the right. (G) Measurement of the BiAb affinity. BLI was used to measure the binding affinity (KD) of BiAb to HA and NA proteins. The biosensors were loaded together with a constant concentration of HA and an increasing NA protein concentration and incubated with the BiAb (100 nM) for 300 s at the association step followed by incubation in buffer for 120 s at the disassociation step as shown on the x axis. The changes of thickness at the tip of biosensors (response, nM) caused by antibody-antigen binding are shown by the y axis. The association-dissociation pattern and the binding constants are calculated from the resulting fitting curves based on a 1:1 binding model. Octet Analysis Studio was used to analyze the data. Graphs are color coded based on the NA concentration that was used. Calculated KD (M) for each protein concentration is depicted in the figure.
Figure 2
Figure 2
The dual-antiviral activity of the BiAb (A and B) Neutralizing activity of the antibodies CR6261, 1G01, BiAb, or a combination of CR6261 and 1G01 against A/Puerto Rico/8/34 (H1N1) was assessed by a microneutralization assay. The virus was incubated with the antibodies CR6261, 1G01, BiAb, or a combination of CR6261 and 1G01. MDCK infection was evaluated by analyzing the expression of the influenza virus NP in the infected cells. To calculate the % infection, the results were compared to cells that were infected with influenza virus in the absence of antibodies. Antibody concentrations are indicated in the x axis. A summary of three independent experiments is shown and data were fitted using non-linear regression analysis (four parameter). Statistically significant differences between BiAb and CR6261(∗p < 0.05, ∗∗<0.005, one-way ANOVA), BiAb and 1G01, (#p < 0.05, ##p < 0.005, one-way ANOVA), and BiAb and antibody combination (∗∗p < 0.005, unpaired Student’s t test) are shown. The IC50 values that are indicated in the figure were calculated based on the pooled data from all three experiments. Values were calculated using AAT Bioquest IC50 calculator (https://www.aatbio.com/tools/ic50-calculator). (C) Plots that depict the percentage of infected cells (HA-positive cells) in MDCK cells that were incubated with supernatant from infected cells (middle panel) or incubated with supernatant from infected cells that were treated with the BiAb (right panel). The number in each Q2 quadrant depicts the percentage of influenza virus-infected cells. One representative experiment is shown out of three performed. (D and E) Percentage of neutrophil activation following incubation of H1N1-infected (D) and uninfected (E) MDCK cells with BiAb, CR6261, 1G01, or a combination of CR6261 + 1G01. The antibody concentration is depicted in the x axis. Relative neutrophile activation (%) was measured by analyzing CD62L shedding and CD11b upregulation after subtraction of the values that were observed with no target cells but with the addition of the antibodies. Statistically significant difference between BiAb and CR6261 (∗p < 0.05, ∗∗<0.005), BiAb and 1G01 (#p < 0.05. ##p < 0.005), and BiAb and combination (ˆp < 0.05, ˆˆp < 0.005) are shown; one-way ANOVA with Tukey’s multiple comparison test. Shown is one representative experiment out of three preformed. (F) Staining of parental Jurkat cells (dark gray histogram) and Jurkat NFAT FcγRIIIa cells (empty histogram) with anti-human CD16 Ab. Shown are representative histograms out of three independent experiments that were preformed. (G) Luminescence values following incubation of Jurkat NFAT CD16 cells with PR8-infected MDCK cells. Shown are fold changes of the luminescence values and the luminescence values seen for each antibody when used in uninfected MDCK cells was used as control and set as 1 (dashed line). Shown is one representative experiment out of three performed. Each dot depicts a tested well. Data represent mean ± SEM. Statistically significant differences are shown (∗p < 0.05, ∗∗p < 0.005, ∗∗∗p < 0.001, one-way ANOVA with Tukey’s multiple comparison test).
Figure 3
Figure 3
Mutation profile of the HA and NA proteins (A) Schematic presentation of serial passage of A/Puerto Rico/8/34 (H1N1) with CR6261 or BiAb; HPI-hours post infection. (B–E) Logo plots and pie charts of SGS derived from viruses following serial passage with CR6261 (B), 1G01 (D), or BiAb (C and E). The frequency of viruses carrying a specific mutation in the HA or NA is shown by the height of the letter colored in red. The numbers in the x axis depict the amino acid location in the A/Puerto Rico/8/34 HA and NA glycoproteins. The figures were made using the web logo (https://weblogo.berkeley.edu/logo.cgi). The y axis height specifies the number of bits, which indicates the information content of a sequence position. By default, the height of the y axis is the maximum entropy for the given sequence type (log2 20 = 4.3 bits for protein). The pie charts show the percentage of viruses that carry the indicated mutations in the HA (B and C) or NA (D and E). The number in the middle of the pie chart depicts the total number of viruses that were analyzed by SGS in each analysis. The white pie slice represents unmutated HA or NA sequences. The colored pie slices represent the acquired mutations of HA or NA as indicated in the figure. Locations of amino acid substitutions (red) on the HA trimer and the NA tetramer structure were identified using UCSF ChimeraX. The SGS was done once for the HA analysis and once for the NA analysis.
Figure 4
Figure 4
Assessment of the prophylactic efficacy of the BiAb in comparison with CR6261, 1G01, and antibody combination (A) Mouse weight following BiAb administration. Mouse weights were evaluated following administration of the BiAb at 2 mg/kg i.p. (n = 8). The mouse weights at day 0 were set as 1. Gray graphs depict the weight fold change of individual mice, and the red graph depicts the average mouse weight fold change. (B) BiAb plasma half-life measurements. The y axis depicts the percentage of the BiAb in mouse plasma out of the initial antibody dose. Dots and error bars depict the average measurements in three mice. The red dashed graph depicts the calculated non-linear regression. The black dashed line depicts 50% of the initial antibody dose. The calculated antibody half-life is shown in the figure (t1/2). (C–E) Mouse weight loss and lung viral titers following infection. Mouse weight loss (C) and viral titers (at day 7) in the lungs (D) were evaluated following infection with the 4.6 × 103 PFU/mL of A/Puerto Rico/8/34 (H1N1) influenza virus 4 h after the administration of 2 mg/kg of the BiAb, CR6261, 1G01, or a combination of CR6261 and 1G01. Weight loss of the BiAb-treated mice was compared to untreated mice using unpaired Student’s t test (∗∗p < 0.005, ∗∗∗p < 0.001) and viral loads were compared by one-way ANOVA (Tukey’s multiple comparison test; ∗p < 0.05, ∗∗p < 0.005, ∗∗∗p < 0.001). In (D), each data point depicts an individual mouse, and mice with no detectable viral load or mice that were found dead at day 7 were excluded from the analysis. (E and F) Maximal mouse weight loss (E) and % survival (F) following infection with the 4.6 × 103 PFU/mL of A/Puerto Rico/8/34 (H1N1) influenza virus and administration of 2 mg/kg of the BiAb, CR6261, 1G01, a combination of CR6261 and 1G01, or in untreated mice. Antibodies were administered 4 h before infection by i.p. injection. The data are a summary of three independent experiments, and at least 21 mice were infected in each group. In (E), maximal weight loss was calculated by dividing the minimal weight of each mouse with the weight of each mouse at day 0. Each data point depicts an individual mouse. Data shown are means ± SEM (∗∗p < 0.005, unpaired Student’s t test). (F) Kaplan-Meier survival plots. In the survival curve, the average number of mice in each group is n = 21, and mice losing 25% of their initial weight were sacrificed. Statistically significant differences between antibody-treated groups and the untreated group are indicated in the figure (p values) and were calculated by the log rank test. The statistical differences between BiAb-treated mice and a combination of CR6261 and 1G01 were determined by Gehan-Breslow-Wilcoxon test.
Figure 5
Figure 5
Testing the therapeutic efficacy of the BiAb in comparison with CR6261, 1G01, and antibody combination (A, C, and E) Mouse weight loss following infection with 4.6 × 103 PFU/mL of various influenza virus strains and following administration of antibodies (2 mg/kg) 2 days following the infection. The virus strain and the antibodies that were used are indicated in the figure. Weight loss was calculated by dividing the weight of each mouse by the weight of the individual mouse at day 0. Shown are the mean weight loss values ±SEM. The x axis depicts the days post infection (DPI). BiAb-treated mouse weight loss was compared to the combination-treated mice using unpaired Student’s t test (∗p < 0.05, ∗∗p < 0.005, ∗∗∗p < 0.0005). (B, D, and F) Kaplan-Meier survival plots depicting mouse survival (%) following infection with 4.6 × 103 PFU/mL of the influenza virus strain and following administration of antibodies (2 mg/kg) 2 days following the infection. The virus strain, the antibodies that were used, and the number of mice in each group (n = 20) are indicated in the figure. Statistically significant differences between the antibody-treated groups and the untreated group are indicated in the figure (p values) and were calculated by the log rank test. The statistical differences between BiAb-treated mice and a combination of CR6261 and 1G01 were also determined by a log rank test and are indicated in the figure (p values). The upper panel depicts infection with A/Puerto Rico/8/1934 (H1N1); the middle panel depicts infection with A/FortMonmouth/1/1947 (H1N1); the lower panel depicts infection with A/Wilson-Smith/1933 (H1N1).

Similar articles

Cited by

References

    1. Crowe J.E. Is it possible to develop a “universal” influenza virus vaccine?: Potential for a universal influenza vaccine. Cold Spring Harbor Perspect. Biol. 2018;10 doi: 10.1101/cshperspect.a029496. - DOI - PMC - PubMed
    1. Nypaver C., Dehlinger C., Carter C. Influenza and Influenza Vaccine: A Review. J. Midwifery Womens Health. 2021;66:45–53. doi: 10.1111/jmwh.13203. - DOI - PMC - PubMed
    1. Freund N.T., Wang H., Scharf L., Nogueira L., Horwitz J.A., Bar-On Y., Golijanin J., Sievers S.A., Sok D., Cai H., et al. Coexistence of potent HIV-1 broadly neutralizing antibodies and antibody-sensitive viruses in a viremic controller. Sci. Transl. Med. 2017;9 doi: 10.1126/scitranslmed.aal2144. - DOI - PMC - PubMed
    1. Naranjo-Gomez M., Pelegrin M. Vaccinal effect of HIV-1 antibody therapy. Curr. Opin. HIV AIDS. 2019;14:325–333. doi: 10.1097/COH.0000000000000555. - DOI - PubMed
    1. Caskey M., Schoofs T., Gruell H., Settler A., Karagounis T., Kreider E.F., Murrell B., Pfeifer N., Nogueira L., Oliveira T.Y., et al. Antibody 10-1074 suppresses viremia in HIV-1-infected individuals. Nat. Med. 2017;23:185–191. doi: 10.1038/nm.4268. - DOI - PMC - PubMed

MeSH terms

LinkOut - more resources