. 2024 Nov 25;120(14):1794-1810.
doi: 10.1093/cvr/cvae168.

Zonation and ligand and dose dependence of sphingosine 1-phosphate receptor-1 signalling in blood and lymphatic vasculature

Affiliations

Zonation and ligand and dose dependence of sphingosine 1-phosphate receptor-1 signalling in blood and lymphatic vasculature

Ilaria Del Gaudio et al. Cardiovasc Res. .

Abstract

Aims: Circulating levels of sphingosine 1-phosphate (S1P), an HDL-associated ligand for the endothelial cell (EC) protective S1P receptor-1 (S1PR1), are reduced in disease states associated with endothelial dysfunction. Yet, as S1PR1 has high affinity for S1P and can be activated by ligand-independent mechanisms and EC autonomous S1P production, it is unclear if relative reductions in circulating S1P can cause endothelial dysfunction. It is also unclear how EC S1PR1 insufficiency, whether induced by deficiency in circulating ligand or by S1PR1-directed immunosuppressive therapy, affects different vascular subsets.

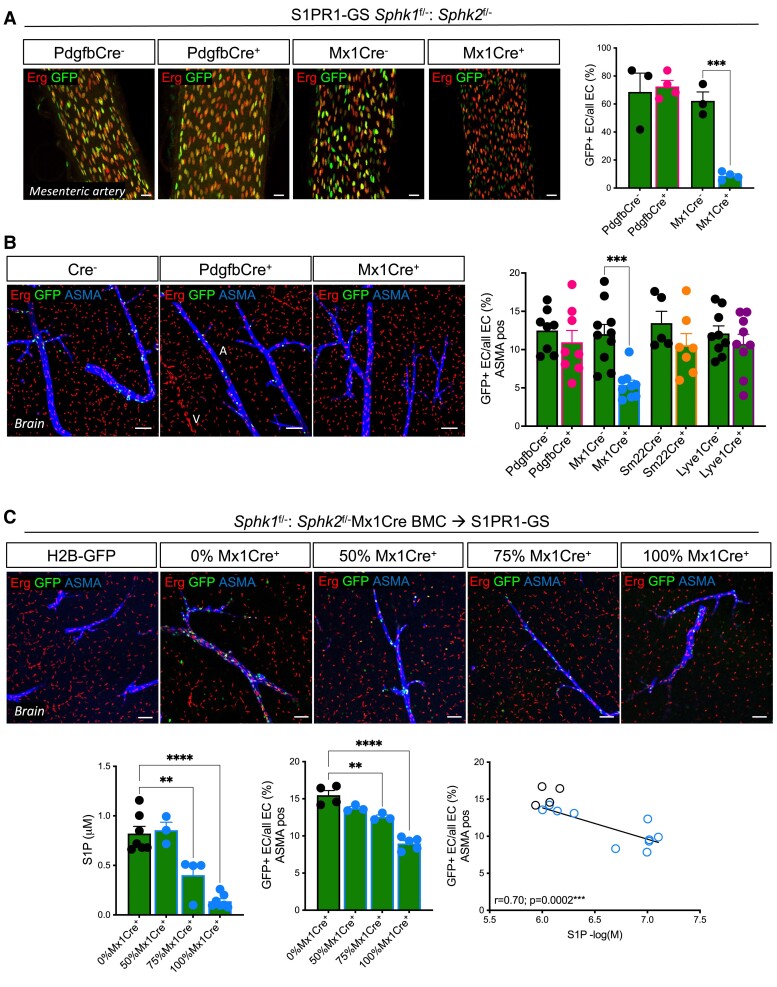
Methods and results: We here fine map the zonation of S1PR1 signalling in the murine blood and lymphatic vasculature, superimpose cell-type-specific and relative deficiencies in S1P production to define ligand source and dose dependence, and correlate receptor engagement to essential functions. In naïve blood vessels, despite broad expression, EC S1PR1 engagement was restricted to resistance-size arteries, lung capillaries, and a subset of high-endothelial venules (HEVs). Similar zonation was observed for albumin extravasation in EC S1PR1-deficient mice, and brain extravasation was reproduced with arterial EC-selective S1pr1 deletion. In lymphatic ECs, S1PR1 engagement was high in collecting vessels and lymph nodes and low in blind-ended capillaries that drain tissue fluids. While EC S1P production sustained S1PR1 signalling in lymphatics and HEV, haematopoietic cells provided ∼90% of plasma S1P and sustained signalling in resistance arteries and lung capillaries. S1PR1 signalling and endothelial function were both surprisingly sensitive to reductions in plasma S1P with apparent saturation around 50% of normal levels. S1PR1 engagement did not depend on sex or age but modestly increased in arteries in hypertension and diabetes. Sphingosine kinase (Sphk)-2 deficiency also increased S1PR1 engagement selectively in arteries, which could be attributed to Sphk1-dependent S1P release from perivascular macrophages.

Conclusion: This study highlights vessel subtype-specific S1PR1 functions and mechanisms of engagement and supports the relevance of S1P as circulating biomarker for endothelial function.

Keywords: Endothelial function; Signalling; Sphingosine 1-phosphate; Vascular biology; Vascular integrity.


Conflict of interest statement

Conflict of interest: none declared.

Figures

Graphical Abstract
Graphical Abstract
Figure 1
Figure 1
Zonation of S1PR1 signalling in blood and lymphatic vessels of naïve mice. Vascular zonation of S1PR1/ß-arrestin coupling revealed by nuclear GFP accumulation in naïve S1PR1-GS mice. (A) Representative confocal images (n ≥ 3 mice) of nuclear GFP in the brain (cerebral cortex), heart (left ventricle), kidney (glomeruli and inter-lobular artery), lung, aorta, and mesenteric artery. Right panel shows approximate prevalence of GFP+ ECs among all arterial ECs (based on 100–200 ASMA-associated EC nuclei from ≥3 mice) grouped by calibre and organ. Arrows, GFP+ arterial EC nuclei; arrowheads, GFP+ capillary EC nuclei, dashed lines outline the inferior curvature of the aortic arch, and an intercostal artery branch point in descending aorta. (B) Representative confocal images focusing on lymphatic vasculature in the mesentery and ear skin. Asterisk, lymphatic valve; arrows, GFP+ collecting lymphatic nuclei; dashed arrows, GFP− LEC nuclei; V, vein; A, artery. (C) Representative confocal images of mesenteric lymph nodes. Arrows, GFP+ HEV ECs in T cell zone; dashed arrows, GFP− HEV ECs close to medullary sinuses. Tissue sections were stained with antibodies to Erg to identify EC nuclei (red), CD31 for EC plasma membrane (white), ASMA for VSMC (blue), podocalyxin for glomeruli and EC plasma membrane (white), Prox1 for LEC and lymphatic valves (red), Lyve1 for LECs (red/blue), and PNAd for HEVs (blue). Scale bar: 60 µm. LAD, left anterior descending coronary artery; LV, left ventricle; MA, mesenteric artery; RA, renal artery.
Figure 2
Figure 2
S1PR1 maintains vascular integrity in central nervous system arteries and lung capillaries. (AD) Accumulation of AlexaFluor555-conjugated BSA (magenta) in the brain (A) of P12 mice with pan-EC S1pr1 deletion (S1pr1f/f:PdgfbCre) or brain (B) and retina (D) of P12 mice with S1pr1 deletion in arterial ECs only (S1pr1f/f:BmxCre) 4 h after i.p. tracer injection (n = 3–4 mice). Brain sections shown are at approximately bregma −2. (C) Quantification of BSA accumulation in the cerebral cortex (A, B) based on fluorescence area per field (n = 3 mice). ECs are co-stained with isolectin B4 (green). Bottom panels of A and B show high magnification images with ASMA co-staining to identify arteries (blue). (E) Evans blue dye extraction from the brain and lung of mice with pan-EC or arterial EC S1pr1 deletion or pooled littermate controls 2 h after of dye injection (n = 5–15 mice). (F, G) Accumulation of fluorescently labelled BSA (magenta) in the cerebral cortex (F) and lung (G) of adult pan-EC S1PR1 deficient and littermate control mice 4 h after intravenous injection, co-stained with antibodies to CD31 to identify ECs (green) and ASMA to identify arteries (blue) (n = 4 mice). Scale bar: 60 µm except for the upper panels A and B (600 µm) and lower panels A and B (10 µm). Scatter dot plots show mean ± SEM. Statistical analysis was performed using one-way analysis of variance followed by Dunnett’s multiple comparisons test. ****P < 0.0001, ***P < 0.001, **P < 0.01, and *P < 0.05. A, artery; V, vein.
Figure 3
Figure 3
Ligand and source dependence of S1PR1 signalling in the blood vasculature. (A) Characterization of S1PR1 signalling in mesenteric arteries in the context of EC-selective (PdgfbCre) or pan-haematopoietic (Mx1Cre) deletion of Sphk1&2 (S1PR1-GS Sphk1f/−; Sphk2f/−). Left panel: representative images with counterstaining for Erg+ EC nuclei (red). Right panel: quantification of GFP+ Erg+ EC nuclei (n = 3–4 mice). (B) Characterization of S1PR1 signalling in cerebral arteries in the context of EC (PdgfbCre), pan-haematopoietic (Mx1Cre), VSMC (Sm22Cre), or PVM (Lyve1Cre) deletion of Sphk1&2 (n = 5–10 mice). Left panel: representative images for Cre, PdgfbCre and Mx1Cre with counter-staining for Erg+ EC nuclei (red) and ASMA+ VSMC (blue). Right panel: quantification of GFP+ Erg+ EC nuclei in arteries. (C) Analysis of plasma S1P levels and S1PR1 signalling in the cerebral cortex of irradiated S1PR1-GS mice 4 months after transplantation of Sphk1&2-deficient (Sphk1f/−:Sphk2f/−:Mx1Cre+) and control (Sphk1f/−:Sphk2f/−:Mx1Cre) BMCs at ratios from 0/1 (0%) to 1/0 (100%). Upper panel: representative confocal images with counter-staining for Erg+ EC nuclei (red) and ASMA+ VSMCs (blue). Lower panel: plasma S1P levels (left) (n = 3–7 mice), quantification of GFP+ Erg+ EC in arteries (middle) (n = 3–5 mice), correlation between the percentage of signalling in arteries and plasma S1P (right) (n = 14 mice). Scale bar: 60 µm. Scatter dot plots show mean ± SEM. Statistical analysis was performed using one-way analysis of variance (ANOVA) followed by Sidak’s multiple comparisons test (A, B), Kruskal–Wallis followed by Dunnett’s multiple comparisons test (C, left), one-way ANOVA followed by Dunnett’s multiple comparisons test (C, middle), or Pearson correlation (C, right). ****P < 0.0001, ***P < 0.001, and **P < 0.01. A, artery; V, vein.
Figure 4
Figure 4
S1P source and dose requirements for S1PR1 function in the blood vasculature. (AC) Quantification of Evans blue dye accumulation in the lung (A, left) (n = 6–14 mice) and brain (n = 6–14 mice) (B) and hypercapnia-induced blood flow increases in the basilar artery (n = 5–15 mice) (C) of Sphk1f/−:Sphk2f/−:Mx1Cre+ mice and littermate controls and in irradiated wild-type recipients of Sphk1f/−:Sphk2f/−:Mx1Cre+ or littermate control BMCs. Right plot in A shows correlation between Evans blue extracted from lung and plasma S1P levels in individual hosts of Sphk1&2-deficient BMC (n = 6 and 7 mice). (DF) Quantification of plasma S1P levels (D) and Evans blue accumulation in the lung (n = 7–16 mice) (E) and brain (n = 7–18 mice) (F) of mice with intermediate or strong reduction in plasma S1P achieved with full or partial Sphk1&2 deletion in haematopoietic cells by Vav1Cre. Right plot in E shows correlation between Evans blue extracted from lung and plasma S1P levels in individual mice (n = 4 and 8 mice). (G) Representative confocal images showing brain sections stained with antibodies to CD31 for EC (green) and ASMA for VSMCs (blue) (n = 4 mice). Extravasation of AlexaFluor555-conjugated BSA (magenta) in the cerebral cortex of plasma S1P-deficient mice (Sphk1f/−:Sphk2f/−:Mx1Cre+) and littermate controls. Note AlexaFluor555-conjugated BSA accumulation outside of ASMA-positive vessels only in mice lacking plasma S1P. Scale bar: 60 µm. Statistical analysis was performed using an unpaired t-test (A, left, B, C), Pearson correlation (A, E, right), or Kruskal–Wallis test followed by Dunnett’s multiple comparisons test (E left, F). ****P < 0.0001, ***P < 0.001, **P < 0.01, and *P < 0.05.
Figure 5
Figure 5
BECs do not contribute measurable S1P to plasma. (A) Plasma S1P levels in mice in which Sphk1&2 are deleted in haematopoietic and other cells with Mx1Cre, mostly haematopoietic cells with Vav1Cre or exclusively haematopoietic cells in wild-type recipients of Sphk1f/−:Sphk2f/−:Mx1Cre+ BMCs, most microvascular and mid-size artery ECs with PdgfbCre, or arterial EC-selective deletion of Spns2 with BmxCre, compared with respective littermate controls (n = 4–15 mice). The graph includes data shown in Figures 3C and 4A and B to facilitate direct comparison. (B) Plasma sphingosine levels in mice in which Sphk1&2 are deleted in haematopoietic and other cells with Mx1Cre or exclusively haematopoietic cells in wild-type recipients of Sphk1f/−:Sphk2f/−:Mx1Cre+ BMCs (n = 4–6 mice). (C) Total ceramide sphingosine and S1P levels in heart tissue of Sphk1f/−:Sphk2f/−:Vav1Cre+ (n = 3 mice). (D) Plasma S1P levels in irradiated mice with (Sphk1f/−:Sphk2f/−:Lyve1Cre) or without (Sphk1f/−:Sphk2f/−:Lyve1Cre+) the capacity for LEC S1P production transplanted with BMCs lacking the capacity for haematopoietic cell S1P production (Sphk1f/−:Sphk2f/−:Mx1Cre+) (n = 6 and 7 mice). Statistical analysis was performed using one-way analysis of variance followed by Sidak’s multiple comparisons (A, B) or an unpaired t-test (C, D). ****P < 0.0001, **P < 0.01, and *P < 0.05.
Figure 6
Figure 6
Sphk2 deficiency increases arterial S1PR1 engagement by eliciting S1P release from PVMs. (A) Quantification of the percentage of GFP+ Erg+ positive EC nuclei in arteries (left) and other ECs (right) from the heart, kidney, and brain of S1PR1-GS mice rendered genetically deficient in Sphk2 relative to Sphk2-proficient littermate controls (n = 5 mice). (B) Quantification of the percentage of GFP+ Erg+-positive EC nuclei in cerebral arteries (right) and plasma S1P levels (left) in Sphk2-deficient S1PR1-GS mice in which Sphk1 is selectively deleted in ECs with Cdh5Cre or in PVMs and a subset of ECs with Lyve1Cre (n = 4–14 mice). Statistical analysis was performed using an unpaired t-test (A, left), Mann–Whitney test (A, right), or one-way analysis of variance followed by Sidaks’s multiple comparison test (B, right). ****P < 0.0001, **P < 0.01, and *P < 0.05.
Figure 7
Figure 7
Sources of S1P sustaining S1PR1 signalling in HEV and lymphatic endothelium. S1PR1 engagement assessed by GFP in PNAd+ (blue) mesenteric lymph node Erg+ HEV ECs (red) (A) (n = 7–9 mice), in Prox1+ LECs (red) of mesenteric collecting lymphatic vessels covered by ASMA+ VSMC (blue) (B) (n = 2–8 mice), and Prox1+ (red) and Lyve1+ (blue) mesenteric lymph node sinusoidal LECs (C) (n = 5–7 mice) in S1PR1-GS mice with and without Sphk1&2 expression in vascular smooth muscle cells (Sphk1f/−:Sphk2f/−:Sm22Cre+/−), collecting lymphatic and a subset of other LECs and HEV ECs (Sphk1f/−:Sphk2f/−:PdgfbCre+/−), haematopoietic cells, lymphatic and a subset of HEV ECs (Sphk1f/:Sphk2f/−:Mx1Cre+/−), or LECs, a subset of haematopoietic cells, and HEV ECs (Sphk1f/−:Sphk2f/−:Lyve1Cre+/−). Left, representative confocal images; right, quantification. Asterisks indicate lymphatic valves.; note some S1PR1-independent GFP signal in lymphatic valves of the H2B-GFP control. Scale bar: 60 µm Statistical analysis was performed using one-way analysis of variance followed by Sidaks’s multiple comparisons test. ****P < 0.0001 and ***P< 0.001.

Comment in

References

    1. Proia RL, Hla T. Emerging biology of sphingosine-1-phosphate: its role in pathogenesis and therapy. J Clin Invest 2015;125:1379–1387. - PMC - PubMed
    1. Baeyens AAL, Schwab SR. Finding a way out: S1P signaling and immune cell migration. Annu Rev Immunol 2020;38:759–784. - PubMed
    1. Allende ML, Yamashita T, Proia RL. G-protein-coupled receptor S1P1 acts within endothelial cells to regulate vascular maturation. Blood 2003;102:3665–3667. - PubMed
    1. Gaengel K, Niaudet C, Hagikura K, Laviña B, Muhl L, Hofmann JJ, Ebarasi L, Nyström S, Rymo S, Chen LL, Pang M-F, Jin Y, Raschperger E, Roswall P, Schulte D, Benedito R, Larsson J, Hellström M, Fuxe J, Uhlén P, Adams R, Jakobsson L, Majumdar A, Vestweber D, Uv A, Betsholtz C. The sphingosine-1-phosphate receptor S1PR1 restricts sprouting angiogenesis by regulating the interplay between VE-cadherin and VEGFR2. Dev Cell 2012;23:587–599. - PubMed
    1. Jung B, Obinata H, Galvani S, Mendelson K, Ding BS, Skoura A, Kinzel B, Brinkmann V, Rafii S, Evans T, Hla T. Flow-regulated endothelial S1P receptor-1 signaling sustains vascular development. Dev Cell 2012;23:600–610. - PMC - PubMed

Publication types