. 2024 May;3(5):567-593.
doi: 10.1038/s44161-024-00471-7. Epub 2024 May 7.

Primitive macrophages induce sarcomeric maturation and functional enhancement of developing human cardiac microtissues via efferocytic pathways

Affiliations

Primitive macrophages induce sarcomeric maturation and functional enhancement of developing human cardiac microtissues via efferocytic pathways

Homaira Hamidzada et al. Nat Cardiovasc Res. 2024 May.

Abstract

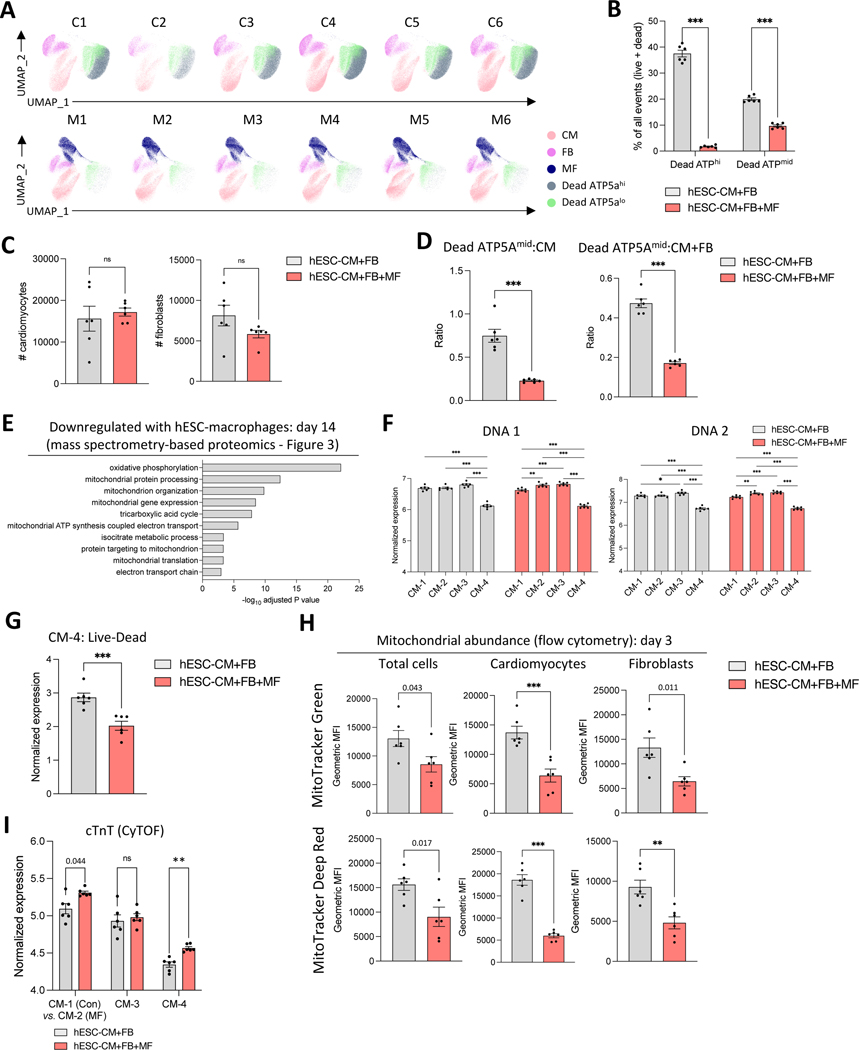
Yolk sac macrophages are the first to seed the developing heart, however we have no understanding of their roles in human heart development and function due to a lack of accessible tissue. Here, we bridge this gap by differentiating human embryonic stem cells (hESCs) into primitive LYVE1+ macrophages (hESC-macrophages) that stably engraft within contractile cardiac microtissues composed of hESC-cardiomyocytes and fibroblasts. Engraftment induces a human fetal cardiac macrophage gene program enriched in efferocytic pathways. Functionally, hESC-macrophages trigger cardiomyocyte sarcomeric protein maturation, enhance contractile force and improve relaxation kinetics. Mechanistically, hESC-macrophages engage in phosphatidylserine dependent ingestion of apoptotic cardiomyocyte cargo, which reduces microtissue stress, leading hESC-cardiomyocytes to more closely resemble early human fetal ventricular cardiomyocytes, both transcriptionally and metabolically. Inhibiting hESC-macrophage efferocytosis impairs sarcomeric protein maturation and reduces cardiac microtissue function. Taken together, macrophage-engineered human cardiac microtissues represent a considerably improved model for human heart development, and reveal a major beneficial role for human primitive macrophages in enhancing early cardiac tissue function.


Conflict of interest statement

Competing interests M. R. and Y.Z. are inventors on patents for cardiac tissue cultivation that are licensed to Valo Health. They receive licensing royalty from this invention. Q.W., M.R., and Y.Z. have a filed patent application on thermoplastic polymer composition for micro 3D printing and uses thereof. All other authors declare no competing interests.

Figures

Extended Data Fig. 1:
Extended Data Fig. 1:. Integration of hESC-macrophages into bioengineered human cardiac microtissues.
(A) Flow cytometry of hESC-cardiomyocytes on day 16 post-differentiation. (B) qPCR of generic or cardiac lineage-specific genes in human primary cardiac fibroblasts compared to human primary dermal fibroblasts at passages 3 or 5. n=3 replicates per group from one experiment. (C-D) Immunofluorescence confocal imaging of microtissues 14 days post-seeding with or without hESC-macrophages. Images were acquired at the surface or deep within the tissue. Scale bar: 100mm (C, left), 50mm (C, right), 100mm (D). (E) hESC-macrophages were seeded either alone or with a range of abundances of human primary cardiac fibroblasts. The number of hESC-macrophages were counted over three weeks. n=3 per group, representative experiment shown, repeated two times. Diagram made with BioRender.com. (F) hESC-macrophages were incubated with control or conditioned media from human primary cardiac fibroblasts. The number of hESC-macrophages were counted over three weeks. n=3 per group, representative experiment shown, repeated two times. cTnT: cardiac troponin T; CM: cardiomyocyte; FB: fibroblast; MF: macrophage. One-way ANOVA with P values adjusted for multiple comparisons using the Tukey-Kramer test: *P<0.05, **P<0.01, ***P<0.001. Error bars represent mean ± SEM.
Extended Data Fig. 2:
Extended Data Fig. 2:. Defining contamination and dissociation-induced gene expression in hESC-macrophages.
(A) hESC-macrophages were stimulated with LPS in the presence or absence of the transcription inhibitor Flavopiridol. qPCR was performed on IL6 and TNF with expression normalized to the housekeeping gene b2M. n=3 replicates per group from one experiment. (B) In control experiments, hESC-macrophages were incubated either (1) alone, (2) with fibroblasts or (3) with fibroblasts and hESC-cardiomyocytes during a 40-minute digestion period at 37 degrees Celsius. hESC-macrophages were sorted for bulk RNA sequencing (n=3 replicates per group from one experiment). (C) Representative gating strategy for fluorescence activated cell sorting (FACS) isolation of hESC-macrophages from each digestion control group in (B). CD14+RFP+CD45+DAPI- live single cells were sorted for bulk RNA sequencing. (D) Principal component analysis. (E) Volcano plots showing differentially expressed genes between CM+FB+MF vs. MF and FB+MF vs. MF. (F-G) Microtissues (HT-Biowires) were seeded in combinations of hESC-cardiomyocytes, human primary cardiac fibroblasts and/or hESC-macrophages. On day 14, hESC-macrophages were sorted for bulk RNA sequencing. (F) Representative gating strategy for fluorescence activated cell sorting (FACS) isolation of hESC-macrophages from microtissues. CD14+RFP+CD45+DAPI- live single cells were sorted for bulk RNA sequencing (n=3 microtissues per group from one experiment). (G) Principal component analysis of hESC-macrophages sorted from each group in microtissues in (F). (H) CM+FB+MF vs. FB+MF DEGs compared in Biowire vs. digestion controls, or FB+MF vs. MF DEGs compared in Biowires vs. in digestion controls. CM: cardiomyocyte; FB: fibroblast; MF: macrophage. One-way ANOVA with P values adjusted for multiple comparisons using the Šídák test: *P<0.05, **P<0.01, ***P<0.001. Error bars represent mean ± SEM.
Extended Data Fig. 3:
Extended Data Fig. 3:. hESC-macrophages improve electromechanical function and reduce electrical instability in iCell-cardiomyocyte containing Biowires.
Microtissues were seeded with iPSC-cardiomyocytes (iCells) and primary human cardiac fibroblasts with or without hESC-macrophages in the Biowire II platform. (A) Independent experiments of distinct iPSC-cardiomyocyte and hESC-macrophage batches. Biowires were seeded with or without hESC-macrophages. Force and electrical properties were measured day 11 post-seeding. Batch 2: n=3 (control) or n=5 (hESC-macrophage) microtissues per group from one experiment, except for excitation threshold and maximum capture rate where n=5 control microtissues. Batch 3: n=4 microtissues per group from one experiment. (B) Microtissues were stimulated at increasing frequencies from 1 Hz to 4 Hz. Graph shows the tracking of pixel movement during contraction and relaxation. n=4 per group. (C) Schematic depicting the categorization of weak amplitude beats during mechanical alternans. (D) Electrical instability threshold representing the minimum frequency at which an alternating reduced force amplitude pattern was observed. n=4 microtissues per group from one experiment. We defined a reduced force amplitude based on whether the amplitude was at least 15% less than the prior measured amplitude. (E) Percentage of peaks at 1 Hz or 2 Hz that contain alternating amplitudes were quantified. n=4 microtissues per group, one experiment. CM: cardiomyocyte; FB: fibroblast; MF: macrophage. Unpaired two-tailed t-test (A, D-E): *P<0.05, **P<0.01, ***P<0.001. Error bars represent mean ± SEM.
Extended Data Fig. 4:
Extended Data Fig. 4:. Baseline heart rate correlates with the effect of hESC-macrophages on the heart rate of cardiac microtissues.
(A) Microtissues (HT-Biowires) were seeded with hESC-cardiomyocytes and fibroblasts with or without hESC-macrophages. Active force was measured on day 14 post-seeding. n=26 (control) or n=24 (hESC-macrophage) microtissues per group pooled from two independent experiments. Unpaired t-test was performed. (B) Relationship between the baseline heart rate of microtissues (HT-Biowires, except for iCell data point from Biowire II platform) without hESC-macrophages to the change in heart rate upon addition of hESC-macrophages. Each data point represents the average of a distinct experiment, with the batch of cardiomyocytes used indicated. Simple linear regression was performed, reporting R-squared and P value indicating whether the slope is significantly non-zero. (C) Fold-change in active force in microtissues (HT-Biowires, except for iCell data from Biowire II platform) with hESC-macrophages relative to controls in each experiment performed. n=14, 20, 6, 9, 11, 2, 6, 18, 6 control microtissues (left to right) or n= 8, 30, 5, 11, 14, 9, 16, 18, 6 microtissues with hESC-macrophages (left to right). Each group represents an independent experiment. CM: cardiomyocyte; FB: fibroblast; MF: macrophage. Unpaired two-tailed t-test (A, C): *P<0.05, **P<0.01, ***P<0.001. Error bars represent mean ± SEM.
Extended Data Fig. 5:
Extended Data Fig. 5:. Expression of proteins in mass spectrometry-based proteomics of cardiac microtissues.
Liquid chromatography mass spectrometry was performed on total protein isolated from individual microtissues (HT-Biowires) on day 3 and day 14. (A) The number of proteins detected in each sample. (B) Histogram showing the number of proteins that are shared across multiple samples as indicated on the x-axis. (C) LFQ intensity of contractile machinery proteins in microtissues with or without hESC-macrophages on day 3. (D) LFQ intensity of JHP2 in microtissues with or without hESC-macrophages on day 14. n=9 microtissues per group from one experiment. (E) Immunofluorescence and confocal microscopy was performed on microtissues with or without hESC-macrophages stained with a-actinin and MLC2v (as in Figure 3G). Myofibril alignment was quantified. n=8 microtissues per group from one experiment. (F) LFQ intensity of collagen proteins in microtissues with or without hESC-macrophages on day 3. n=7 (control) or n=8 (hESC-macrophage) microtissues per group from one experiment. (G) LFQ intensity of extracellular matrix proteins in microtissues with or without hESC-macrophages on day 3. n=7 (control) or n=8 (hESC-macrophage) microtissues per group from one experiment. CM: cardiomyocyte; FB: fibroblast; MF: macrophage. Multiple unpaired (two-tailed) t-tests were conducted with P values adjusted for multiple comparisons using the Holm-Šídák method (C, F-G). Unpaired two-tailed t-test was performed for pairwise comparisons of two groups (D-E). *P<0.05, **P<0.01, ***P<0.001. Error bars represent mean ± SEM.
Extended Data Fig. 6:
Extended Data Fig. 6:. hESC-macrophages increase calcium amplitude in human cardiac microtissues without changes in calcium transients or in single hESC-cardiomyocyte ion channel function.
(A) Liquid chromatography mass spectrometry was performed on total protein isolated from individual microtissues (HT-Biowires). LFQ intensity of calcium handling proteins in microtissues with or without hESC-macrophages on day 14. n=8 (control) n=9 (hESC-macrophage) microtissues per group from one experiment. Multiple unpaired (two-tailed) t-tests were conducted with P values adjusted for multiple comparisons using the Holm-Šídák method. (B-G) Microtissues were seeded with hESC-cardiomyocytes and human primary cardiac fibroblasts with or without hESC-macrophages in a 24-well based HT-Biowire platform. (B) Microtissues were incubated with a calcium indicator dye (Fluo-4). Calcium amplitude relative to baseline intensity was measured 14 days post-seeding either during spontaneous beating or while pacing at 3 Hz. n=12, 13, 12 13 microtissues per group (left to right) from one experiment. (C) Conduction velocity in microtissues with or without hESC-macrophages paced at 3 Hz. n=28 (control) or n=19 (hESC-macrophage) microtissues per group pooled from two independent experiments. Unpaired two-tailed t-test was performed. (D-E) Microtissues were stimulated at increasing frequencies. Calcium transient duration from depolarization to either 50% (CaTD50) or 80% (CaTD80) decay in microtissues with or without hESC-macrophages paced at 2–5 Hz 14 days post-seeding. n=29, 17, 34, 18, 11, 12, 8, 10 microtissues per group (left to right) pooled from two independent. (F) Relaxation time (peak to baseline) in microtissues with or without hESC-macrophages paced at 2–5 Hz 14 days post-seeding. n=29, 17, 34, 19, 11, 12, 8, 10 microtissues per group (left to right) pooled from two independent experiments. (G) Time to peak from 90% depolarization to 10% repolarization in microtissues with or without hESC-macrophages paced at 2–5 Hz 14 days post-seeding. n=29, 16, 36, 17, 12, 11, 8, 9 microtissues per group (left to right) pooled from two independent experiments. (H) Schematic of experimental design made with BioRender.com. Microtissues were seeded with hESC-cardiomyocytes and fibroblasts with or without hESC-macrophages. On day 14, microtissues were dissociated and cells were plated for single cardiomyocyte patch clamp recordings. (I) Representative ICa tracings (left). Peak ICa amplitude at 0 mV (right). n=11 (control) or n=8 (hESC-macrophage) cardiomyocytes per group pooled from two independent experiments. (J) Representative INa tracings (left). Peak INa amplitude at −20mV (right). n=8 (control) or n=11 (hESC-macrophage) cardiomyocytes per group from one experiment. (K) INa+ Current density-voltage (I-V) plot and activation curve with the least-square fits to Boltzmann function. n=8–11 per group, one experiment. (L) Representative action potential (AP) tracings along with peak AP amplitude, AP duration at 50% repolarization (APD50) and resting membrane potential (RMP) (left to right). n=3 cardiomyocytes per group from one experiment. CM: cardiomyocyte; FB: fibroblast; MF: macrophage. Two-way ANOVA with P values adjusted for multiple comparisons using the Holm-Šídák method (B, D-G). Unpaired two-tailed t-test (C, I, J, L). *P<0.05, **P<0.01, ***P<0.001. Error bars represent mean ± SEM.
Extended Data Fig. 7:
Extended Data Fig. 7:. hESC-macrophages reduce accumulation of mitochondrial proteins in cardiac microtissues.
Cytometry by time-of-flight (CyTOF) was performed on microtissues (HT-Biowires) with or without hESC-macrophages on day 3 post-seeding. n=6 replicates per group, each replicate represented 8 pooled microtissues, experiment performed once. (A) UMAP visualization of 580,776 live and dead cells following standard quality control filtering, split by replicate in each group. (B) Percentage of Dead ATP5hi group relative to all events in each replicate. (C) Number of cardiomyocytes or fibroblasts acquired in each replicate in microtissues with or without hESC-macrophages. (D) Percentage of ATP5Amid cells relative to the number of cardiomyocytes (left) or the number of cardiomyocytes and fibroblasts (right) in microtissues with or without hESC-macrophages. (E) Pathways downregulated in microtissues with hESC-macrophages on day 14 from mass spectrometry-based proteomics data (as in Figure 3). (F) Normalized expression of DNA 1 or DNA 2 in each cardiomyocyte subcluster (averaged in each replicate) in microtissues with or without hESC-macrophages. (G) Normalized expression live-dead label in each replicate (averaged) in CM-4 from microtissues with or without hESC-macrophages. (H) Microtissues were seeded with hESC-cardiomyocytes and fibroblasts with or without hESC-macrophages. On day 3 post-seeding, microtissues were labelled with the MitoTracker dye and flow cytometry was performed. Geometric mean fluorescence intensity (MFI) of MitoTracker in total cells, cardiomyocytes (CD45-CD14-), or fibroblasts (CD45dimCD14dim) is shown. n=6 microtissues per group, two experiments shown (MitoTracker Green and MitoTracker Deep Red). (I) Normalized expression of cardiac troponin T (cTnT) in each replicate (averaged) for all cardiomyocyte subclusters (CyTOF data) in microtissues with or without hESC-macrophages. CM: cardiomyocyte; FB: fibroblast; MF: macrophage. Two-way ANOVA with P values adjusted for multiple comparisons using the Šídák method (B, F, I), or unpaired two-tailed t-test (C, D, E, G, H). *P<0.05, **P<0.01, ***P<0.001. Error bars represent mean ± SEM.
Extended Data Fig. 8:
Extended Data Fig. 8:. Global downregulation of metabolic proteins in fibroblasts in cardiac microtissues with hESC-macrophages.
(A) CyTOF data of fibroblasts re-clustered showing 5 subclusters. n=6 replicates per group, each replicate represented 8 pooled microtissues, experiment performed once. (A-F). (B) Frequency of each subcluster of fibroblasts in microtissues with or without hESC-macrophages. (C) Expression of each marker in each subcluster of fibroblasts. (D-F) Expression of each marker in microtissues with or without hESC-macrophages for FB-1 versus FB-2 (D), FB-3 (E) or FB-4 (F). CM: cardiomyocyte; FB: fibroblast; MF: macrophage. Multiple unpaired two-tailed t-tests were conducted with P values adjusted for multiple comparisons using the Bonferroni-Dunn method (D-F), or two-way ANOVA was performed with P values adjusted with Šídák method (B). *P<0.05, **P<0.01, ***P<0.001. Error bars represent mean ± SEM.
Extended Data Fig. 9:
Extended Data Fig. 9:. Gating strategy for sorting hESC-cardiomyocytes from microtissues for bulk RNA sequencing.
(A) Microtissues (HT-Biowires) were seeded with hESC-cardiomyocytes and fibroblasts with or without hESC-macrophages for bulk RNA sequencing of hESC-cardiomyocytes on day 3 post-seeding. Representative gating strategy shown. DAPI live single cells were first gated, followed by CD45CD14CD90RFP cells. (B) hESC-cardiomyocytes, fibroblasts and hESC-macrophages were independently stained and acquired for flow cytometry. Data was overlaid into a single plot. CD45CD14 cells were hESC-cardiomyocytes, CD45dimCD14dim cells were fibroblasts, and CD45+CD14+ cells were hESC-macrophages, confirming the gating strategy utilized in (A). (C) CD45 expression of populations shown in (B), showing that hESC-cardiomyocytes are CD45, fibroblasts are CD45dim and hESC-macrophages are CD45+. (D) hESC-cardiomyocytes or fibroblasts were pre-labeled with CFSE prior to seeding microtissues. On day 3, flow cytometry was performed showing that the CFSE+ hESC-cardiomyocytes were CD14RFP, whereas CFSE+ fibroblasts were CD14dimRFPdim, confirming the gating strategy utilized in (A). CM: cardiomyocyte; FB: fibroblast; MF: macrophage.
Extended Data Fig. 10:
Extended Data Fig. 10:. hESC-macrophage efferocytosis alters the total proteome in cardiac microtissues.
(A) Expression of proliferation genes in bulk RNA sequencing data of hESC-macrophages as in Figure 1. n=3 replicates per group from one experiment. (B) Number of hESC-cardiomyocytes or hESC-macrophages in microtissues with hESC-macrophages in PBS-treated versus Annexin-treated microtissues assessed using flow cytometry. n=4 microtissues per group from one experiment. (C) Pathways enriched in microtissues with hESC-macrophages in PBS treated (with efferocytosis) versus Annexin treated (without efferocytosis) in liquid chromatography mass spectrometry-based proteomics data. Fisher’s one-tailed test was performed with correction for multiple comparisons using the g:SCS method as implemented in gProfiler. (D) Human cytokine array (96-plex Discovery Assay) was performed on culture supernatants from microtissues with or without hESC-macrophages on days 1, 3 and 7. Volcano plots show upregulated versus downregulated cytokines at each timepoint. n=7 replicates (collected from n=7 microtissues) per group at each timepoint from one experiment. (E) Concentration of key cytokines in culture supernatants at each timepoint in microtissues with or without hESC-macrophages. n=7 replicates (collected from n=7 microtissues) per group at each timepoint from one experiment. (F) Microtissues were seeded with or without hESC-macrophages, containing PBS pre-treated versus Annexin pre-treated hESC-cardiomyocytes. On day 14 post-seeding, active force, contraction slope and relaxation slope were measured. n=17, 14, 14, 10 microtissues per group (left to right) from one experiment, first experiment shown in Figure 7. CM: cardiomyocyte; FB: fibroblast; MF: macrophage. One-way ANOVA (F) or two-way ANVOA (A, E) with P values adjusted for multiple comparisons using the Šídák method. Unpaired two-tailed t-test (B, D). *P<0.05, **P<0.01, ***P<0.001. Error bars represent mean ± SEM.
Figure 1:
Figure 1:. hESC-macrophages undergo stepwise in vivo yolk sac tissue macrophage programming in bioengineered human cardiac microtissues.
(A) Single-cell RNA sequencing analysis of publicly available data (Popescu et al.) of human yolk sac macrophages [4 post-conception weeks (PCW)], transitioning monocytes to macrophages (Mono-MF) and progenitors from the contents or membrane of the yolk sac. Uniform manifold approximation and projection (UMAP) dimensionality reduction and Seurat-based clustering was performed. Heatmap shows the average expression of the top 30 differentially expressed genes (DEGs) in each group. Feature plots depict single cell gene expression. (B) Single-cell RNA sequencing analysis of publicly available data (Suryawanshi et al.) of human fetal cardiac myeloid cells (1001 cells) at 19–22 PCWs (N=3 pooled patients). UMAP dimensionality reduction and Seurat-based clustering identified a population of macrophages, monocytes and dendritic cells. Feature plots depict single cell gene expression of macrophage (C1QC, LYVE1, CD163), monocyte (FCN1, CCR2) and dendritic cell (CD1C) markers. (C) Timeline of the differentiation of human embryonic stem cells to hematopoietic progenitors and hESC-macrophages. (D-E) Flow cytometric analysis of immune and macrophage markers (D) and macrophage lineage-specific markers (E) on day 15 of the differentiation of hematopoietic progenitors. (F) Schematic of bulk RNA sequencing experiment (created with BioRender.com). Cells were seeded in 3 groups within a hydrogel (Matrigel + collagen): (1) hESC-macrophages alone, (2) hESC-macrophages and fibroblasts, (3) hESC-macrophages, fibroblasts and hESC-cardiomyocytes. hESC-macrophages were sorted from each group on day 14 (n=3 replicates per group from one experiment; each replicate represents 15 pooled microtissues) and bulk RNA sequencing was performed. (G) Images of microtissues from each group on day 14. hESC-macrophages are RFP-expressing and shown with red fluorescence signal. Representative images shown, experiment repeated 5 times. Scale bar: 200mm. (H) DEGs were computed in FB+MF vs. MF (effect of fibroblasts) and CM+FB+MF vs. MF (combined effect of fibroblasts and cardiomyocytes). Venn diagram shows the number of genes that were unique to each comparison or shared across comparisons. (I) A human yolk sac macrophage signature was generated by computing the top 100 DEGs (ordered by avg_log2FC) in total yolk sac macrophages relative to the monocyte-macrophage population in the Popsecu et al. data in (A). A signature for human fetal cardiac macrophages was generated by computing the top 150 DEGs (ordered by avg_log2FC) in TLF+ macrophages relative to monocytes in the Suryawanshi et al. in (B). Bulk RNA sequencing data from sorted hESC-macrophages from each group were scored for both the yolk sac macrophage and human fetal cardiac macrophage signature. n=3 replicates per group from one experiment. One-way ANOVA was performed with P values adjusted for multiple comparisons using the Tukey-Kramer test. (J) Pathway enrichment analysis was performed in hESC-macrophages from FB+MF vs. MF and in CM+FB+MF vs. MF. Venn diagram shows the number of unique or shared pathways that were significant based on the - log10 of adjusted P value. Heatmap shows the average expression of gene sets from each GO term, including pathways that were induced by fibroblasts or by the combination of fibroblasts and cardiomyocytes. (K-L) Log10 transformed expression of core macrophage survival or identity genes (K) or tissue resident macrophage genes, defined as the TLF+ macrophage signature in Dick et al. 2022 (L). n=3 replicates per group from one experiment. In K-L, two-way ANOVA was performed and P values were adjusted for multiple comparisons using the Tukey-Kramer test. CM: cardiomyocyte; FB: fibroblast; MF: macrophage. *P<0.05, **P<0.01, ***P<0.001. Error bars represent mean ± SEM.
Figure 2:
Figure 2:. hESC-macrophages enhance mechanical and electrical properties of human cardiac microtissues across cell source and platforms.
(A) Diagram of the parameters that were tracked to assess contraction and relaxation properties in each cardiac cycle. (B-H) The Biowire II platform was seeded with human iPSC-cardiomyocytes (iCells) and primary human cardiac fibroblasts with or without hESC-macrophages in a collagen-Matrigel hydrogel, paced at 1 Hz and measurements were performed on day 11 post-seeding. (B) Tissue width on days 0, 2, 3, 4 and 7 post-seeding in Biowires with or without hESC-macrophages. n=10 (control) or n=8 (hESC-macrophages) microtissues per group measured repeatedly across time from 1 representative experiment, repeated 3 times. Scale bar = 1mm. (C) Passive tension generated by Biowires with or without hESC-macrophages while at rest (in between contractions). n=10 (control) or n=7 (hESC-macrophages) microtissues per group from 1 representative experiment, repeated 3 times. (D) Active force upon tissue contraction in Biowires II with or without hESC-macrophages. n=8 (control) or n=6 (hESC-macrophages) microtissues per group from 1 representative experiment, repeated 3 times. (E) The excitation threshold, or voltage required to stimulate synchronized contraction, in Biowires with or without hESC-macrophages. n=8 (control) or n=6 (hESC-macrophage) microtissues per group from 1 representative experiment, repeated 3 times. (F) Biowires were stimulated at increasing frequencies and maximum capture rate at which the tissue contracts synchronously was measured. n=8 (control) or n=6 (hESC-macrophages) microtissues per group from 1 representative experiment, repeated 3 times. (G-H) Contraction and relaxation slope measured in Biowires with or without hESC-macrophages. n=8 (control) or n=6 (hESC-macrophage) microtissues per group from 1 representative experiment, repeated 3 times. (I-N) Microtissues were seeded with hESC-cardiomyocytes and primary human cardiac fibroblasts with or without hESC-macrophages in a high throughput 96-well based Biowire platform (HT-Biowires), and measurements were performed on day 14 post-seeding. (I) Tissue width was measured (days 0–14) post-seeding. n=6, 27, 29, 29, 10 (control) or n=6, 35, 33, 22, 24 (hESC-macrophage) microtissues per group, representative experiment shown, repeated 7 times. Scale bar: 0.5mm. (J) Passive tension generated in HT-Biowires with or without hESC-macrophages was measured in between contractions (day 14). n=19 (control) or n=21 (hESC-macrophage) microtissues per group, representative experiment shown, repeated 7 times. (K) Active force generated during contraction by HT-Biowires. n=20 (control) or n=30 (hESC-macrophage) microtissues per group, representative experiment shown, repeated 7 times. (L) Active force of HT-Biowires seeded with a range of hESC-macrophage concentrations. Percentages represent the proportion of macrophages over the base numbers (cardiomyocytes + fibroblasts). n=27, 14, 8, 35, 18 microtissues per group (left to right), pooled from 3 independent experiments. (M-N) Contraction and relaxation slope of HT-Biowires with or without hESC-macrophages on day 14 post-seeding. n=14 (control) or n=28 (hESC-macrophage) microtissues per group, representative data shown, repeated 7 times. CM: cardiomyocyte; FB: fibroblast; MF: macrophage. One-way ANOVA (L) or two-way ANOVA (B, I) corrected for multiple comparisons using the Tukey-Kramer test, or unpaired two-tailed t-test (C-H, J, K, M, N): *P<0.05, **P<0.01, ***P<0.001. Error bars represent mean ± SEM.
Figure 3:
Figure 3:. hESC-macrophages induce maturation of cardiomyocyte sarcomeric apparatus and alter extracellular matrix composition in human cardiac microtissues
Liquid chromatography mass spectrometry (LC-MS) was performed on total protein isolated from individual microtissues (HT-Biowires) on day 3 and day 14. (A) Principal component analysis of day 3 and day 14 microtissues with or without hESC-macrophages. (B) LFQ intensity of contractile machinery proteins in microtissues with or without hESC-macrophages on day 14. n=8 (control) or n=9 (hESC-macrophage) microtissues per group from one experiment. (C) Ratio of LFQ intensity of adult to fetal isoforms of contractile machinery proteins on day 3 and day 14. n=7, 8, 8, 9 (left to right) microtissues per group from 1 experiment. (D) LFQ intensity of proteins comprising intercalated discs in microtissues with or without hESC-macrophages on day 14. n=8 (control) or n=9 (hESC-macrophage) microtissues per group from one experiment. (E) hESC-cardiomyocytes were pre-labeled with CFSE prior to microtissue seeding. Flow cytometry was performed on day 3 or day 6 and the size of CFSE+ cardiomyocytes was assessed using the forward scatter area (FSC-A) parameter. n=7 (control) or n=8 (hESC-macrophage) microtissues per group from 1 representative experiment performed 3 times. (F) hESC-cardiomyocytes were pre-labeled with CFSE prior to microtissue seeding. Flow cytometry was performed on day 3 or day 6 and the number of CFSE+ cardiomyocytes were quantified. n=8, 7, 8, 6 microtissues per group (left to right) from 1 representative experiment performed 3 times. (G) Immunofluorescence and confocal microscopy of microtissues with or without hESC-macrophages stained with a-actinin and MLC2v. Sarcomere elongation (eccentricity) was quantified. n=8 microtissues per group, one representative experiment performed 2 times. Scale bar = 20mm. (H) Pathway enrichment analysis of proteins significantly upregulated in microtissues with hESC-macrophages (gProfiler). Fisher’s one-tailed test was performed with correction for multiple comparisons using the g:SCS method as implemented in gProfiler. (I) LFQ intensity of collagen proteins on day 14 in microtissues with or without hESC-macrophages on day 14. n=8 (control) or n=9 (hESC-macrophage) microtissues per group from one experiment. (J) Human primary cardiac fibroblasts were pre-labeled with CFSE prior to microtissue seeding. Flow cytometry was performed on day 3 and the number of CFSE+ fibroblasts were quantified. n=7 (control) or n=8 (hESC-macrophage) microtissues per group from one experiment. (K) LFQ intensity of extracellular matrix proteins (proteoglycans and glycoproteins) in microtissues with or without hESC-macrophages on day 14. n=8 (control) or n=9 (hESC-macrophage) microtissues per group from one experiment. CM: cardiomyocyte; FB: fibroblast; MF: macrophage. Multiple unpaired t-tests (two-tailed) were conducted with P-values adjusted for multiple comparisons using the Holm-Šídák method (B-D, I, K). Unpaired two-tailed t-test was performed for pairwise comparisons of two groups (E-G, J). *P<0.05, **P<0.01, ***P<0.001. Error bars represent mean ± SEM.
Figure 4:
Figure 4:. Multi-dimensional CyTOF analyses reveal hESC-macrophages reduce mitochondrial debris, increase ATP production and realign cardiomyocyte metabolism to approximate early fetal ventricular cardiomyocytes.
Cytometry by time-of-flight (CyTOF) was performed on microtissues (HT-Biowires) with or without hESC-macrophages on day 3 post-seeding. n=6 replicates per group; each replicate represents 8 pooled microtissues; experiment performed twice, one representative experiment is shown. (A) Uniform manifold approximation and projection (UMAP) visualization of 580,776 live and dead cells following standard quality control filtering. (B) Feature plots showing single cell expression of cell type (cTnT, CD45, CD14, CD36) markers, mitochondrial markers (ATP5A, Citrate synthase ([CS]), DNA and cell death markers. (C) Heatmap showing expression of all markers in each major cluster identified in (A). (D) Percentage of ATP5Ahi cells relative to the number of cardiomyocytes (left) or the number of cardiomyocytes and fibroblasts (right) in microtissues with or without hESC-macrophages. Unpaired two-tailed t-test was performed. (E) Immunofluorescence staining and confocal microscopy of ATP5 and cTnT expression in microtissues with or without hESC-macrophages. Scale bar: 20mm. (F-G) Mass spectrometry-based proteomics as in Figure 3. LFQ intensity of mitochondrial proteins from a variety of pathways (F) or Krebs cycle proteins (G) in microtissues with or without hESC-macrophages on day 3 or day 14 post-seeding as indicated. n=7 (control; day 3), n=8 (hESC-macrophage; day 3), n=8 (control; day 14), or n=9 (hESC-macrophage; day 14) microtissues per group from one experiment (H) ATP production measured in tissue lysates of total microtissues with or without hESC-macrophages. n=10 (control) or n=8 (hESC-macrophage) replicates per group; each replicate represents 3 pooled microtissues; experiment performed once. Unpaired two-tailed t-test performed. (I) Single-cell RNA sequencing analysis of human fetal ventricular cardiomyocytes from Cui et al. UMAP showing ventricular cardiomyocyte population (left). Average expression of genes comprising the mitochondrial ATP synthesis electron transport pathway from 5–24 post-conception weeks (right). (J) CyTOF data of hESC-cardiomyocytes re-clustered showing 4 subsets. (K) Frequency of each hESC-cardiomyocyte subcluster in microtissues with or without hESC-macrophages. Two-way ANOVA was performed with P values adjusted for multiple comparisons using the Šídák method. (L) Expression of each marker in each subcluster of hESC-cardiomyocytes. (M-O) Expression of each marker in microtissues with or without hESC-macrophages for CM-1 versus CM-2 (M), CM-3 (N) or CM-4 (O). CM: cardiomyocyte; FB: fibroblast; MF: macrophage. Multiple unpaired (two-tailed) t-tests were conducted with P values adjusted for multiple comparisons using the Holm-Šídák method (F-G) or Bonferroni-Dunn method (M-O). *P<0.05, **P<0.01, ***P<0.001. Error bars represent mean ± SEM.
Figure 5:
Figure 5:. hESC-macrophage incorporation into cardiac microtissues results in reduced cytotoxicity and increased differentiation of cardiomyocytes towards in vivo human fetal cardiomyocytes.
(A) Markers of cytotoxicity were measured in culture supernatants from microtissues on day 3 post-seeding, including creatine kinase MB (CKMB; n=8 per group from one experiment), lactate dehydrogenase (LDH; n=36 per group, two pooled experiments shown, 10 experiments performed), adenylate kinase (n=12 per group from one experiment) and glucose-6-phosphate dehydrogenase (G6PD; n=11 per group from one experiment). (B) LDH release in supernatants on day 3 post-seeding from microtissues seeded with hESC-cardiomyocytes and fibroblasts with or without H1 hESC-macrophages. n=8 microtissues per group, two experiments pooled. (C) LDH release in supernatants on day 3 post-seeding from microtissues seeded with hES2 GFP+ hESC-cardiomyocytes and fibroblasts with or without hESC-macrophages. n=8 per group, two experiments pooled. (D) The release of double-stranded DNA (dsDNA) in culture supernatants from microtissues on day 3 post-seeding. n=10 (control) or n=7 (hESC-macrophage) microtissues per group from one experiment. (E) Cell-free mitochondrial DNA (cf-mtDNA) was measured in culture supernatants on day 1, 3 and 7 post-seeding. Genes in both the minor (ND1) and major (ND4) arc of the mitochondrial genome were assessed. n=10, 11, 11, 11, 10, 10 microtissues per group (left to right) from one experiment. (F) Cellular reactive oxygen species were measured in live microtissues on day 7 post-seeding. Percentage of microtissue area positive for CellROX Green. n=3 microtissues per group from one experiment. (G) hESC-cardiomyocytes (DAPICD45CD14CD90RFP live single cells) were sorted from microtissues with or without hESC-macrophages on day 3 post-seeding for bulk RNA sequencing (n=4 replicates per group; each replicate represents two pooled microtissues; one experiment). Principal component analysis showing that the major driver of variation was the presence or absence of hESC-macrophages. (H) A signature for in vivo human fetal ventricular cardiomyocytes was generated using the top differentially expressed genes in ventricular cardiomyocytes relative to immune cells in Cui et al. dataset. hESC-cardiomyocytes from microtissues with or without hESC-macrophages were scored for this signature. n=4 replicates per group, one experiment. (I) Similar to (H), except the signature was generated for early (5–9 post-conception weeks) versus late (17–24 post-conception weeks) separately. n=4 replicates per group, one experiment. Two-way ANOVA was performed. (J) Pathways enriched in hESC-cardiomyocytes from microtissues with or without hESC-macrophages (gProfiler). Fisher’s one-tailed test was performed with correction for multiple comparisons using the g:SCS method as implemented in gProfiler. (K) Expression levels of proliferation genes in in hESC-cardiomyocytes from microtissues with or without hESC-macrophages. n=4 replicates per group, one experiment. (L) Expression levels of NPPA and NPPB in in hESC-cardiomyocytes from microtissues with or without hESC-macrophages. n=4 replicates per group, one experiment. CM: cardiomyocyte; FB: fibroblast; MF: macrophage. Multiple unpaired (two-tailed) t-tests was performed with P values adjusted for multiple comparisons using the Holm-Šídák method (K), or unpaired two-tailed t-test for pairwise comparisons (A-F, H, L). *P<0.05, **P<0.01, ***P<0.001. Error bars represent mean ± SEM.
Figure 6:
Figure 6:. Efferocytic uptake of cardiomyocytes by hESC-macrophages is driven by phosphatidylserine recognition and is required for full macrophage maturation.
(A) Transwell co-cultures were performed with each combination of cells specified. LDH was measured in culture supernatants on day 3. n=7, 7, 5, 5, 5 microtissues per group (left to right) from one experiment. (B) Log transformed expression of efferocytosis or phagocytosis related genes from bulk RNA sequencing of hESC-macrophages as in Figure 1. Two-way ANOVA was performed and P values were adjusted for multiple comparisons using the Tukey-Kramer test. (C) Microtissues were seeded with or without hESC-macrophages and flow cytometry was performed on day 1 post-seeding. The percentage of ApoTracker+DAPI cardiomyocytes (left; CD14-CD45-) or fibroblasts (right; CD45dimCD14dim) is shown. n=6 microtissues per group from one experiment. (D) hESC-cardiomyocytes or fibroblasts were pre-labeled with CFSE prior to seeding microtissues. Flow cytometry was performed on day 3 post-seeding, and the intensity of CFSE within hESC-macrophages (CD45+CD14+) cells is shown. n=7 (CM-CFSE) or n=6 (FB-CFSE) microtissues per group; two experiments performed, representative experiment shown. (E) hESC-cardiomyocytes were pre-incubated with Annexin V to block exposed phosphatidylserine, then pre-labeled with CFSE prior to seeding microtissues. On day 3, flow cytometry was performed and the intensity of CFSE within hESC-macrophages (CD45+CD14+) or in fibroblasts (CD45dimCD14dim) is shown. (F) Percentage of hESC-macrophages or fibroblasts that are CFSE+ on day 3 post-seeding in microtissues containing PBS pre-treated versus Annexin pre-treated hESC-cardiomyocytes. n=4 microtissues per group from one experiment. (G) Geometric MFI of CFSE within hESC-macrophages or fibroblasts on day 3 post-seeding in microtissues containing PBS pre-treated versus Annexin pre-treated hESC-cardiomyocytes. n=4 microtissues per group from one experiment. (H) Liquid chromatography mass spectrometry was performed on individual whole microtissues with or without hESC-macrophages, containing PBS pre-treated versus Annexin pre-treated hESC-cardiomyocytes (4 groups) on day 14. n=19 (control PBS), n=19 (control Annexin), n=17 (hESC-macrophage PBS), or n=16 (hESC-macrophage Annexin) microtissues per group from one experiment (H-K). Principal component analysis is shown. (I-J) LFQ intensity of mitochondrial proteins (I) or Krebs cycle proteins (J) in each group. The top 10 mitochondrial ribosomal proteins are shown (based on fold-change of annexin vs. PBS microtissues with hESC-macrophages). (K) LFQ intensity of macrophage-specific proteins that were detected only in microtissues with hESC-macrophages in either PBS or Annexin groups (normalized to PBS group). All pairwise comparisons in “reduced” graph were significantly different (FDR<0.01). An: Annexin; CM: cardiomyocyte; FB: fibroblast; MF: macrophage. Multiple unpaired (two-tailed) t-tests were conducted with P values adjusted for multiple comparisons using the false discovery rate (FDR) approach (two-stage step-up, Benjamini, Krieger, and Yekutieli method). I-K: * indicates discoveries below desired FDR of 0.05. Two-way ANVOA for multiple groups (F-G) or unpaired two-tailed t-test for pairwise comparisons (A, C, D) were performed. *P<0.05, **P<0.01, ***P<0.001. Error bars represent mean ± SEM.
Figure 7:
Figure 7:. Inhibiting hESC-macrophage efferocytosis of cardiomyocytes leads to blunted cardiomyocyte maturation, increased cytotoxicity and impaired microtissue function.
(A-F) Liquid chromatography mass spectrometry was performed on individual microtissues (HT-Biowires) with or without hESC-macrophages, containing PBS pre-treated versus Annexin pre-treated hESC-cardiomyocytes (4 groups) on day 14 post-seeding. n=19 (control PBS), n=19 (control Annexin), n=17 (hESC-macrophage PBS), or n=16 (hESC-macrophage Annexin) microtissues per group from one experiment. (A) LFQ intensity of contractile machinery proteins is shown in microtissues with or without hESC-macrophages. (B) Contractile machinery proteins that were upregulated with hESC-macrophages in (A) are shown as a direct comparison between microtissues with hESC-macrophages in PBS versus Annexin treated groups. Fold change of LFQ intensity relative to control microtissues without hESC-macrophages. (C) Ratio of LFQ intensity of MYH7 to MYH6 in each group. (D) LFQ intensity of CDH2 and DSG2 in each group. (E) LFQ intensity of collagen proteins is shown in microtissues with or without hESC-macrophages. (F) Collagen proteins that were significantly upregulated or downregulated with hESC-macrophages in (E) are shown as a direct comparison between microtissues with hESC-macrophages in PBS versus Annexin treated groups. Fold change of LFQ intensity relative to control microtissues without hESC-macrophages. (G-J) Microtissues were seeded with or without hESC-macrophages, containing PBS pre-treated versus Annexin pre-treated hESC-cardiomyocytes. (G) LDH was measured in culture supernatants on day 3 or day 14 post-seeding. n=41, 41, 45, 45 (day 3, left to right) microtissues per group from three independent experiments pooled or n=37 microtissues per group (day 14) from two independent experiments pooled. (H) Tissue width was measured on day 14. n=38, 37, 33, 28 microtissues per group (left to right) from two independent experiments pooled. (I) Force traces showing the measured force above passive tension across time in microtissues with hESC-macrophages in PBS versus Annexin treated groups. Representative traces shown. (J) On day 14 post-seeding, active force, contraction slope and relaxation slope were measured. n=20, 18, 18, 16 microtissues per group (left to right) from one representative experiment; second experiment shown in Figure S10. An: Annexin; CM: cardiomyocyte; FB: fibroblast; MF: macrophage. One-way ANOVA with P values adjusted for multiple comparisons using the Šídák method (C-D, G-H, J). Multiple unpaired (two-tailed) t-tests with P values adjusted for multiple comparisons using the Holm-Šídák method (A, E) or the false discovery rate approach (two-stage step-up, Benjamini, Krieger, and Yekutieli; [B, F]). *P<0.05, **P<0.01, ***P<0.001. Error bars represent mean ± SEM.
Figure 8:
Figure 8:. Graphical summary of findings.
Created with BioRender.com.

References

    1. Dick SA et al. Self-renewing resident cardiac macrophages limit adverse remodeling following myocardial infarction. Nature Immunology 20, 29–39, doi:10.1038/s41590-018-0272-2 (2019). - DOI - PMC - PubMed
    1. Dick SA et al. Three tissue resident macrophage subsets coexist across organs with conserved origins and life cycles. Sci Immunol 7, eabf7777, doi:10.1126/sciimmunol.abf7777 (2022). - DOI - PubMed
    1. Epelman S. et al. Embryonic and adult-derived resident cardiac macrophages are maintained through distinct mechanisms at steady state and during inflammation. Immunity 40, 91–104, doi:10.1016/j.immuni.2013.11.019 (2014). - DOI - PMC - PubMed
    1. Epelman S, Lavine KJ & Randolph GJ Origin and functions of tissue macrophages. Immunity 41, 21–35, doi:10.1016/j.immuni.2014.06.013 (2014). - DOI - PMC - PubMed
    1. Bajpai G. et al. The human heart contains distinct macrophage subsets with divergent origins and functions. Nature Medicine 24, 1234–1245, doi:10.1038/s41591-018-0059-x (2018). - DOI - PMC - PubMed