. 2024 Jul 4;8(8):ziae085.
doi: 10.1093/jbmrpl/ziae085. eCollection 2024 Aug.

Macrophages modulate mesenchymal stem cell function via tumor necrosis factor alpha in tooth extraction model

Affiliations

Macrophages modulate mesenchymal stem cell function via tumor necrosis factor alpha in tooth extraction model

Aung Ye Mun et al. JBMR Plus. .

Abstract

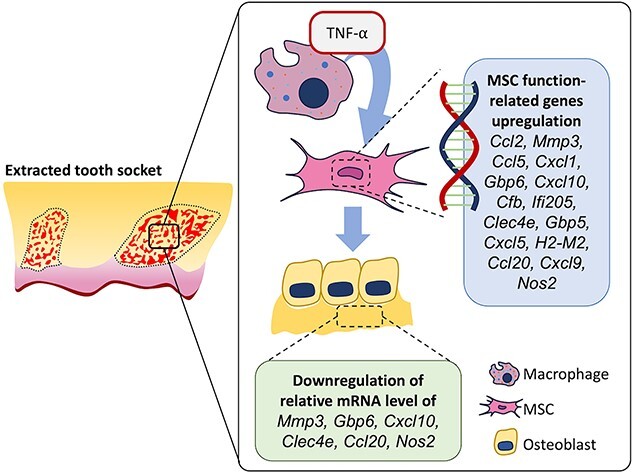
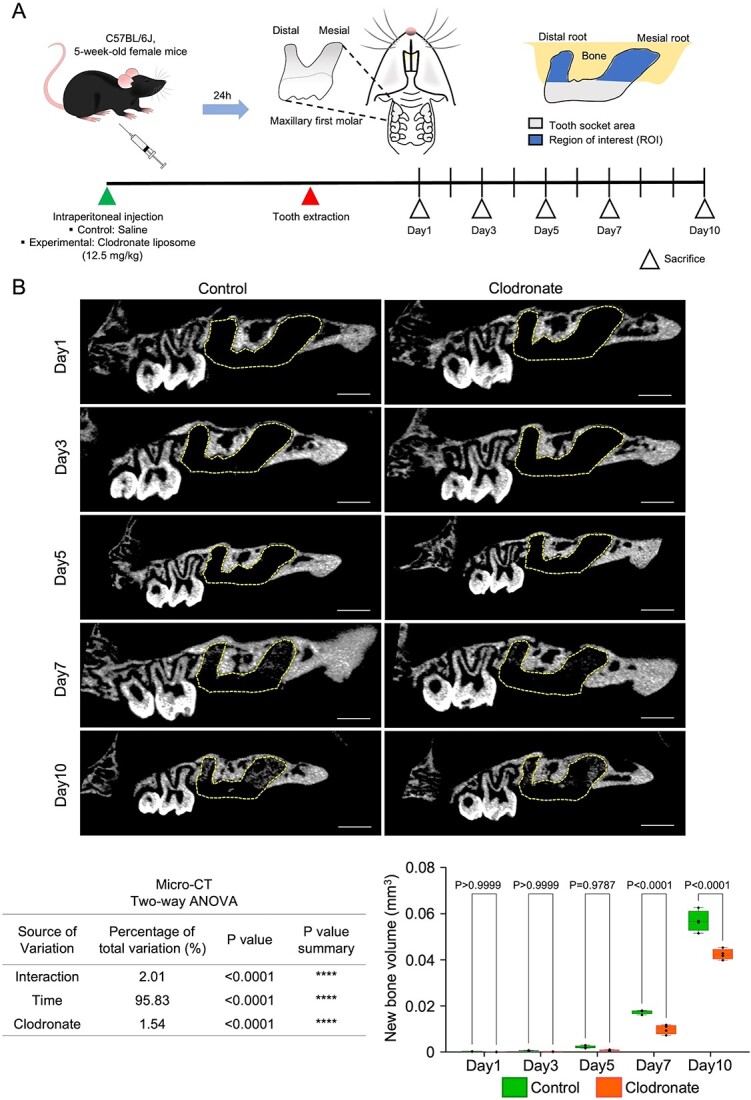
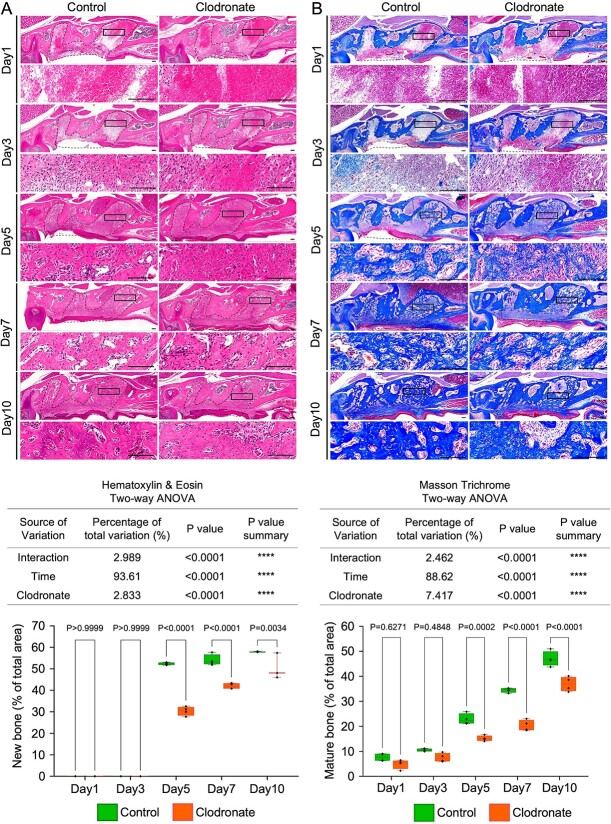
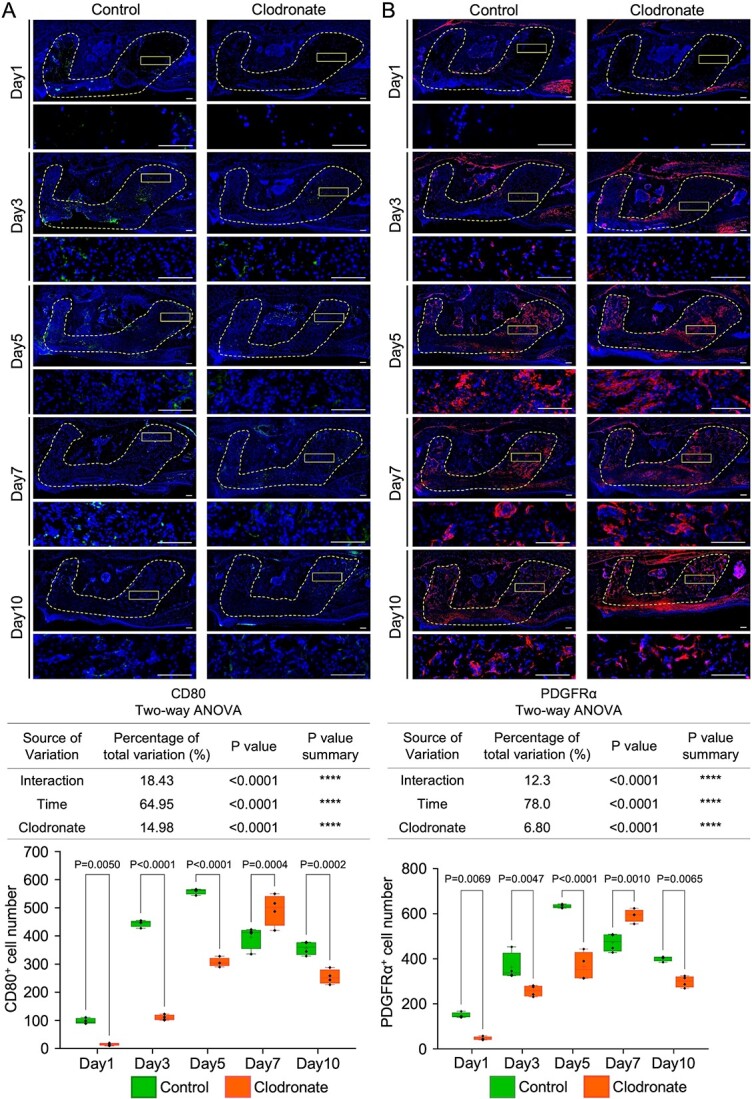
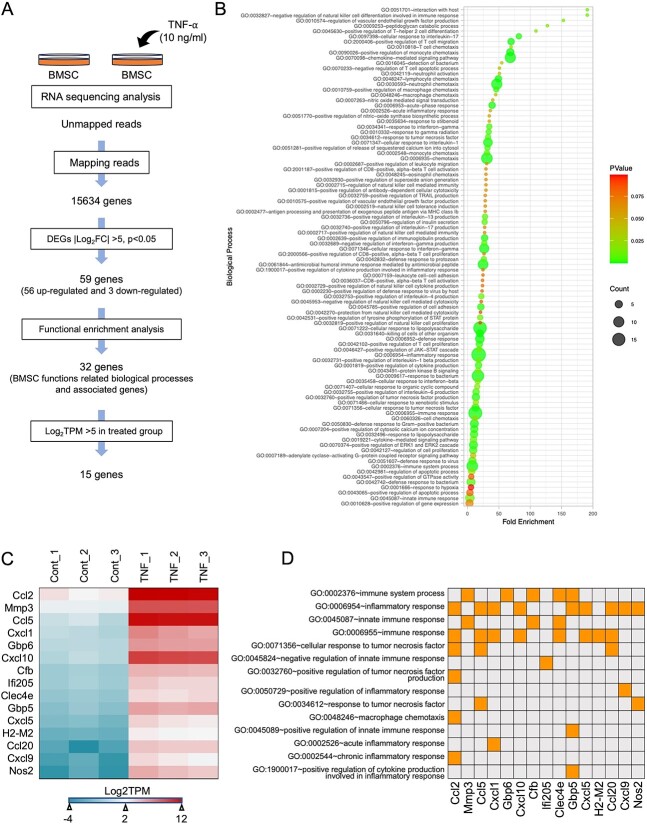
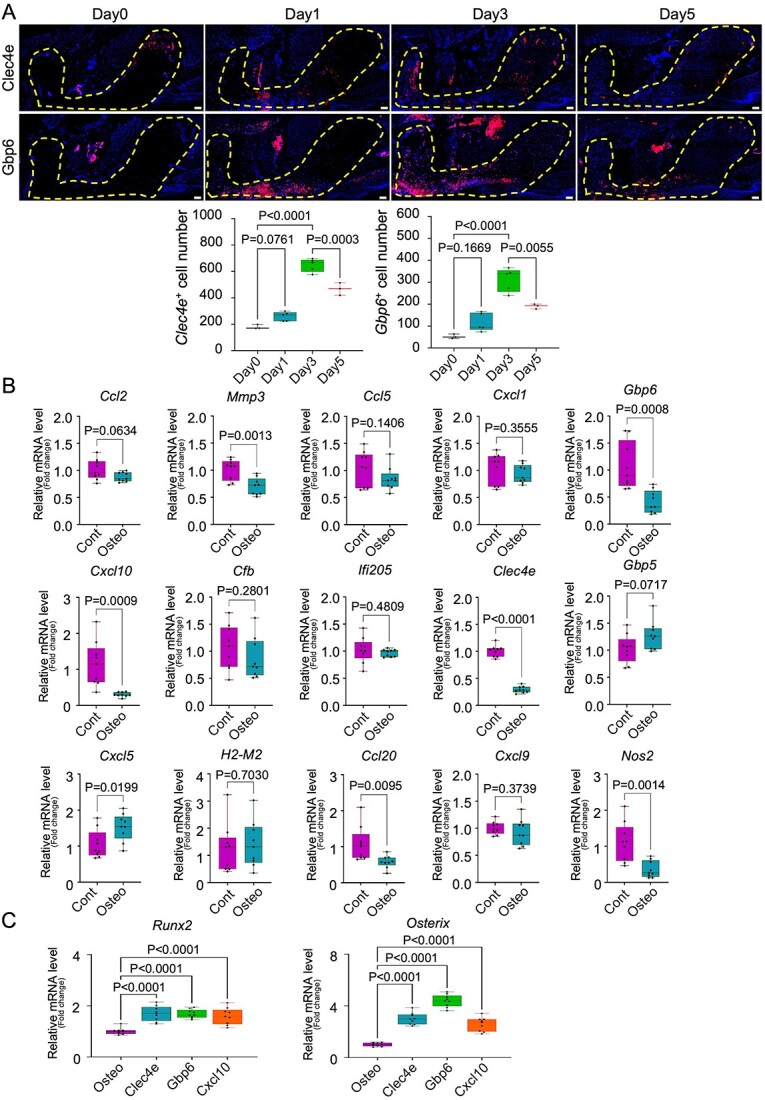
Mesenchymal stem cells (MSCs) and macrophages collaboratively contribute to bone regeneration after injury. However, detailed mechanisms underlying the interaction between MSCs and inflammatory macrophages (M1) remain unclear. A macrophage-depleted tooth extraction model was generated in 5-wk-old female C57BL/6J mice using clodronate liposome (12.5 mg/kg/mouse, intraperitoneally) or saline injection (control) before maxillary first molar extraction. Mice were sacrificed on days 1, 3, 5, 7, and 10 after tooth extraction (n = 4). Regenerated bone volume evaluation of tooth extraction socket (TES) and histochemical analysis of CD80+M1, CD206+M2 (anti-inflammatory macrophages), PDGFRα+MSC, and TNF-α+ cells were performed. In vitro, isolated MSCs with or without TNF-α stimulation (10 ng/mL, 24 h, n = 3) were bulk RNA-sequenced (RNA-Seq) to identify TNF-α stimulation-specific MSC transcriptomes. Day 7 micro-CT and HE staining revealed significantly lower mean bone volume (clodronate vs control: 0.01 mm3 vs 0.02 mm3, p<.0001) and mean percentage of regenerated bone area per total TES in clodronate group (41.97% vs 54.03%, p<.0001). Clodronate group showed significant reduction in mean number of CD80+, TNF-α+, PDGFRα+, and CD80+TNF-α+ cells on day 5 (306.5 vs 558.8, p<.0001; 280.5 vs 543.8, p<.0001; 365.0 vs 633.0, p<.0001, 29.0 vs 42.5, p<.0001), while these cells recovered significantly on day 7 (493.3 vs 396.0, p=.0004; 479.3 vs 384.5, p=.0008; 593.0 vs 473.0, p=.0010, 41.0 vs 32.5, p=.0003). RNA-Seq analysis showed that 15 genes (|log2FC| > 5.0, log2TPM > 5) after TNF-α stimulation were candidates for regulating MSC's immunomodulatory capacity. In vivo, Clec4e and Gbp6 are involved in inflammation and bone formation. Clec4e, Gbp6, and Cxcl10 knockdown increased osteogenic differentiation of MSCs in vitro. Temporal reduction followed by apparent recovery of TNF-α-producing M1 macrophages and MSCs after temporal macrophage depletion suggests that TNF-α activated MSCs during TES healing. In vitro mimicking the effect of TNF-α on MSCs indicated that there are 15 candidate MSC genes for regulation of immunomodulatory capacity.

Keywords: cytokines; dental biology; injury healing; osteoimmunology; stem cells.


Conflict of interest statement

The authors declare no conflicts of interest.

Figures

Graphical Abstract
Graphical Abstract
Figure 1
Figure 1
Macrophage depletion related to decreased volume of regenerated bone in the extracted tooth socket. (A) Illustration of tooth extraction mouse model and ROI. (B) Representative micro-CT images of tooth-extracted maxillary bone and quantification of regenerated bone volume in the tooth extraction area. The dotted line-bound area represents the extracted tooth socket area. Scale bar: 900 μm. Statistical analyses were performed using 2-way ANOVA and Tukey’s multiple comparison method. n = 4.
Figure 2
Figure 2
Rate of new bone formation delayed in the extracted tooth socket. (A) Representative images of HE staining of tooth extraction models and quantification of new bone area per total tooth socket area. (B) Representative images of Masson’s trichrome staining of tooth extraction models and quantification of mature bone area per total tooth socket area. Low- and high-magnification images are depicted. The inset shows the location of the high-magnification image, and the dotted line-bound area shows the extracted tooth socket area. Left panel: control group. Right panel: clodronate group. Scale bar: 100 μm. Statistical analyses were performed using 2-way ANOVA and Tukey’s multiple comparison method. n = 4.
Figure 3
Figure 3
Temporal macrophage depletion by clodronate liposome administration induced a transient reduction and apparent recovery of CD80-positive and PDGFRα-positive cells on day 7 in the extracted tooth socket. (A) Representative images of immunofluorescence CD80 staining in tooth extraction models and quantification of the mean positive cell numbers of CD80 staining per total tooth socket area. (B) Representative images of immunofluorescence PDGFRα staining in tooth extraction models and quantification of the mean number of PDGFRα staining per total tooth socket area. Low- and high-magnification images are depicted. The inset shows the location of the high-magnification image, and the dotted line-bound area shows the extracted tooth socket area. Left panel: control group. Right panel: clodronate group. Scale bar: 100 μm. Statistical analyses were performed using 2-way ANOVA and Tukey’s multiple comparison method. n = 4.
Figure 4
Figure 4
Restoration of CD80/TNF-α double-positive cell recruitment on day 7 in the macrophage-depleted tooth extraction model. (A) Representative images of CD80 and TNF-α double-positive immunofluorescence staining in tooth extraction models as a reference for high-magnification images for all groups. (B) Representative images of high-magnification double-positive CD80 and TNF-α staining in the control and clodronate groups and quantification of mean positive cell numbers of CD80+ TNF-α+ double staining per selected ROI size in the total tooth socket area. High-magnification images are shown. The inset shows the location of the high-magnification image, and the dotted line-bound area shows the extracted tooth socket area. Upper panel, control group. Lower panel, clodronate group. Scale bar: 100 μm. Statistical analyses were performed using 2-way ANOVA and Tukey’s multiple comparison method. n = 4.
Figure 5
Figure 5
Comprehensive analysis of TNF-α stimulation-specific MSCs transcriptomes revealed that 15 immune-related genes were significantly upregulated in TNF-α-stimulated MSCs. (A) Flow chart of BMSC function-related gene screening. We analyzed DEGs of TNF-α-stimulated and unstimulated MSCs and cut-off values of p<.05 and |log2Fold Change| >5. We performed functional enrichment analysis using DAVID Version 6.8 and selected BMSC function-related biological processes. We observed highly expressed genes in the TNF-α-stimulated MSCs group with absolute log2TPM > 5. (B) Bubble plot for functional enrichment analysis of 59 genes using R v4.22. (C) Heatmap of the expression levels of selected genes with high expression in TNF-α-stimulated MSCs. (D) Table presentation of biological processes related to highly expressed genes in TNF-α-stimulated MSCs.
Figure 6
Figure 6
Candidate genes for regulation of the immunomodulatory capacity of MSCs and Clec4e, Gbp6, and Cxcl10 are involved in the inflammatory process and bone healing of the tooth extraction socket. (A) Representative images of immunofluorescence Clec4e and Gbp6 staining in tooth extraction models and quantification of the mean positive cell numbers of Clec4e and Gbp6 staining per total tooth socket area. Low-magnification images are shown, and the dotted line-bound area indicates the extracted tooth socket area. Scale bar: 100 μm. Statistical analyses were performed using one-way ANOVA and Tukey’s multiple comparison method. n = 3–5. (B) Quantification of relative mRNA levels (fold-change) of Ccl2, Mmp3, Ccl5, Cxcl1, Gbp6, Cxcl10, Cfb, Ifi205, Clec4e, Gbp5, Cxcl5, H2-M2, Ccl20, Cxcl9, and Nos2 after induction of osteogenic differentiation in isolated MSCs. MSCs cultured in basal medium were used as controls. Statistical analyses were performed using 2-tailed unpaired t-tests. n = 9. (C) Quantification of the relative mRNA levels (fold-change) of Runx2 and Osterix after siRNA transfection of Clec4e, Gbp6, and Cxcl10. Osteogenic differentiated MSCs without transfection as controls. Statistical analyses were performed using an ordinary one-way ANOVA and Tukey’s multiple comparison method. n = 9.

Similar articles

References

    1. Claes L, Recknagel S, Ignatius A. Fracture healing under healthy and inflammatory conditions. Nat Rev Rheumatol. 2012;8(3):133–143. 10.1038/nrrheum.2012.1 - DOI - PubMed
    1. Pahwa R, Goyal A, Jialal I. Chronic inflammation. In: StatPearls [Internet]. Treasure Island (FL): StatPearls Publishing; 2023: http://www.ncbi.nlm.nih.gov/books/NBK493173/.
    1. Pajarinen J, Lin T, Gibon E, et al. Mesenchymal stem cell-macrophage crosstalk and bone healing. Biomaterials. 2019;196:80–89. 10.1016/j.biomaterials.2017.12.025 - DOI - PMC - PubMed
    1. Maruyama M, Rhee C, Utsunomiya T, et al. Modulation of the inflammatory response and bone healing. Front Endocrin. 2020;11:386. 10.3389/fendo.2020.00386 - DOI - PMC - PubMed
    1. Odgren PR, Witwicka H, Reyes-Gutierrez P. The cast of clasts: catabolism and vascular invasion during bone growth, repair, and disease by osteoclasts, chondroclasts, and septoclasts. Connect Tissue Res. 2016;57(3):161–174. 10.3109/03008207.2016.1140752 - DOI - PMC - PubMed

LinkOut - more resources