. 2022 Nov;1(11):1039-1055.
doi: 10.1038/s44161-022-00160-3. Epub 2022 Nov 17.

Single-cell and spatial transcriptomics of the infarcted heart define the dynamic onset of the border zone in response to mechanical destabilization

Affiliations

Single-cell and spatial transcriptomics of the infarcted heart define the dynamic onset of the border zone in response to mechanical destabilization

D M Calcagno et al. Nat Cardiovasc Res. 2022 Nov.

Abstract

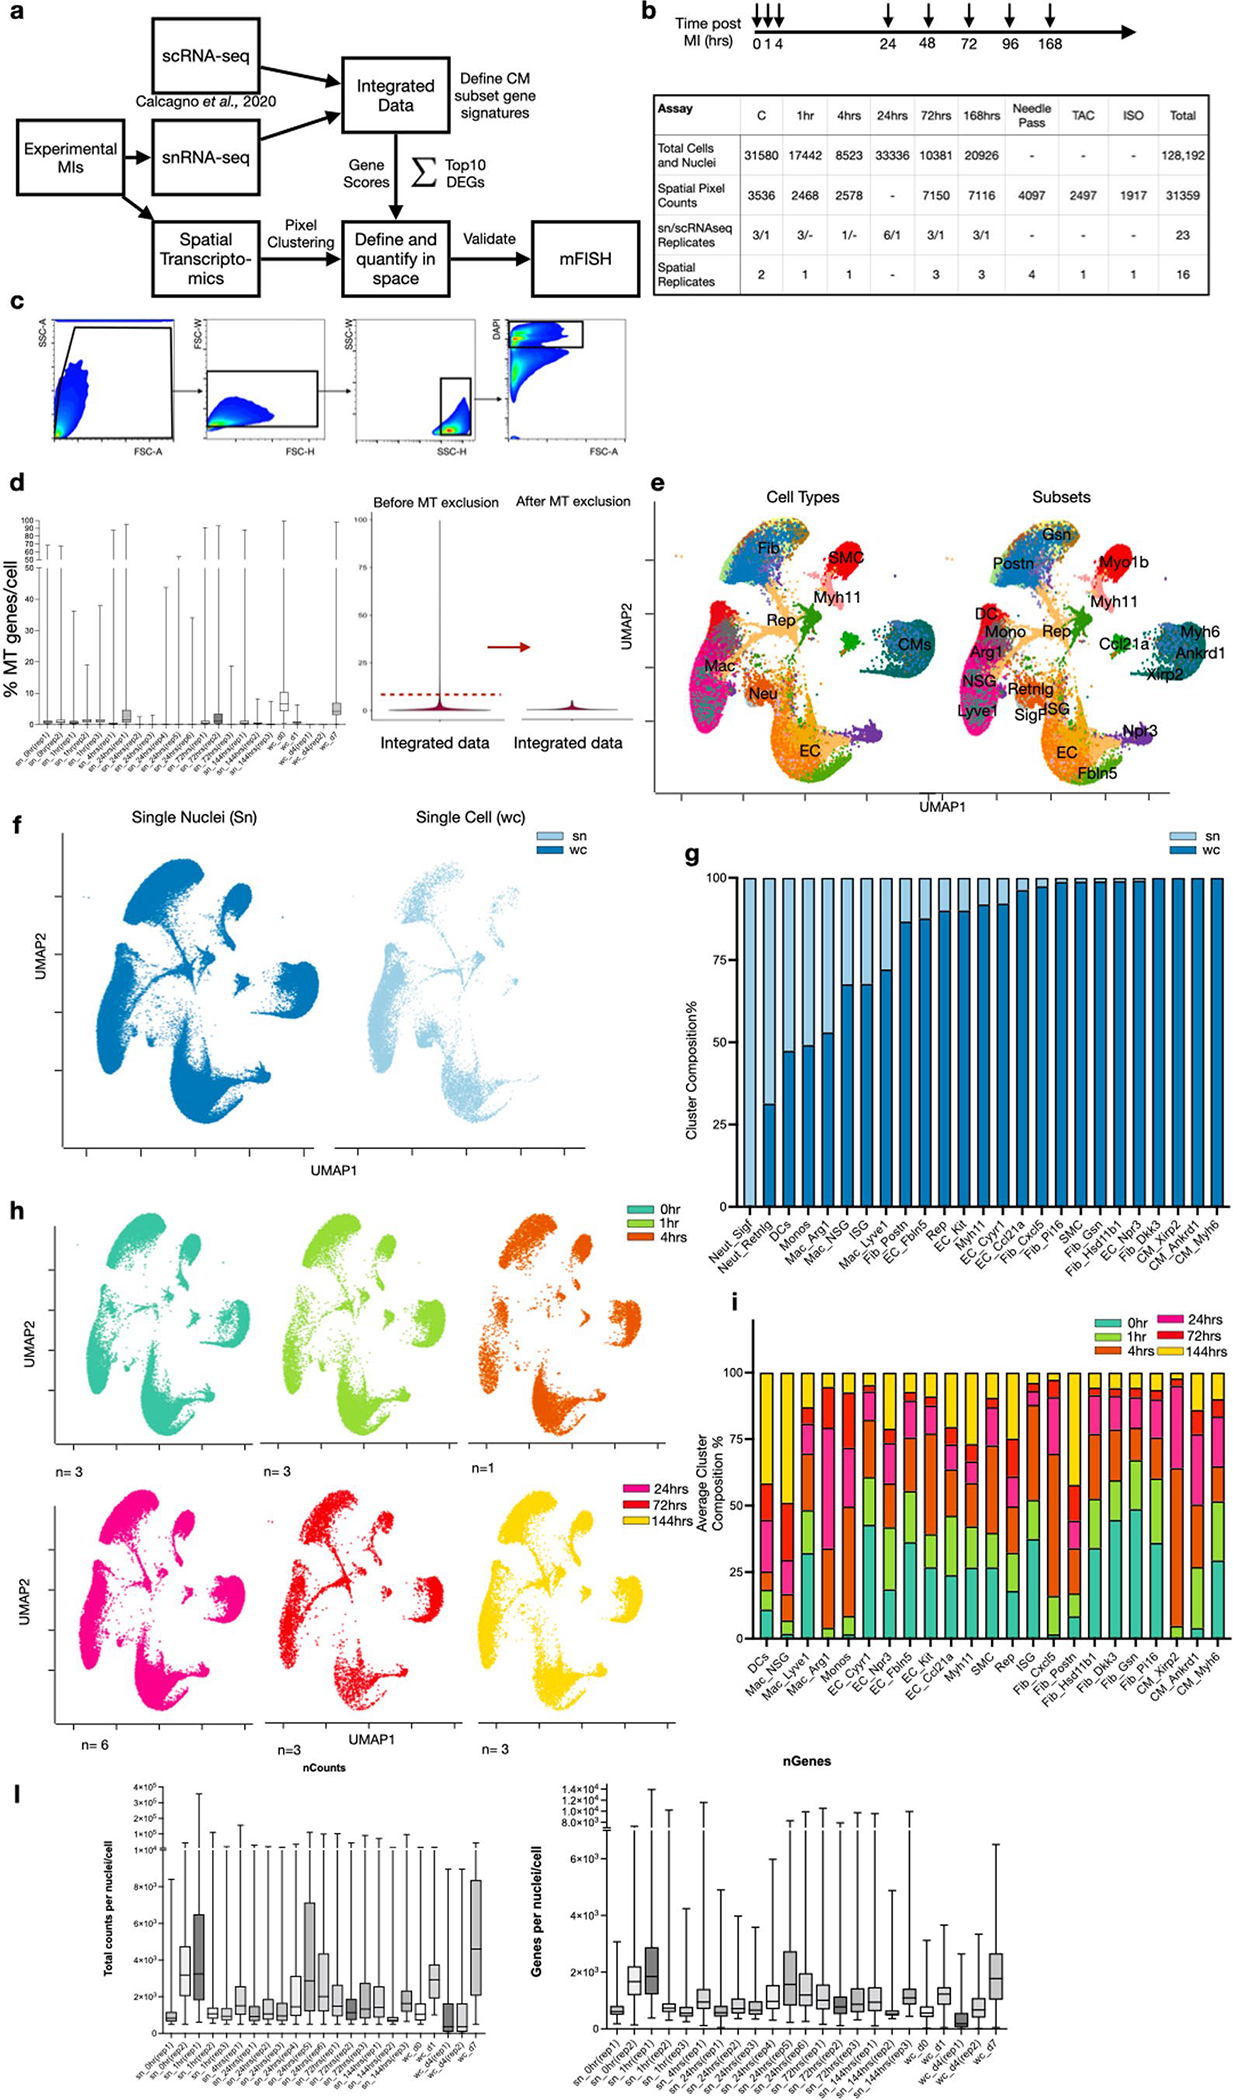
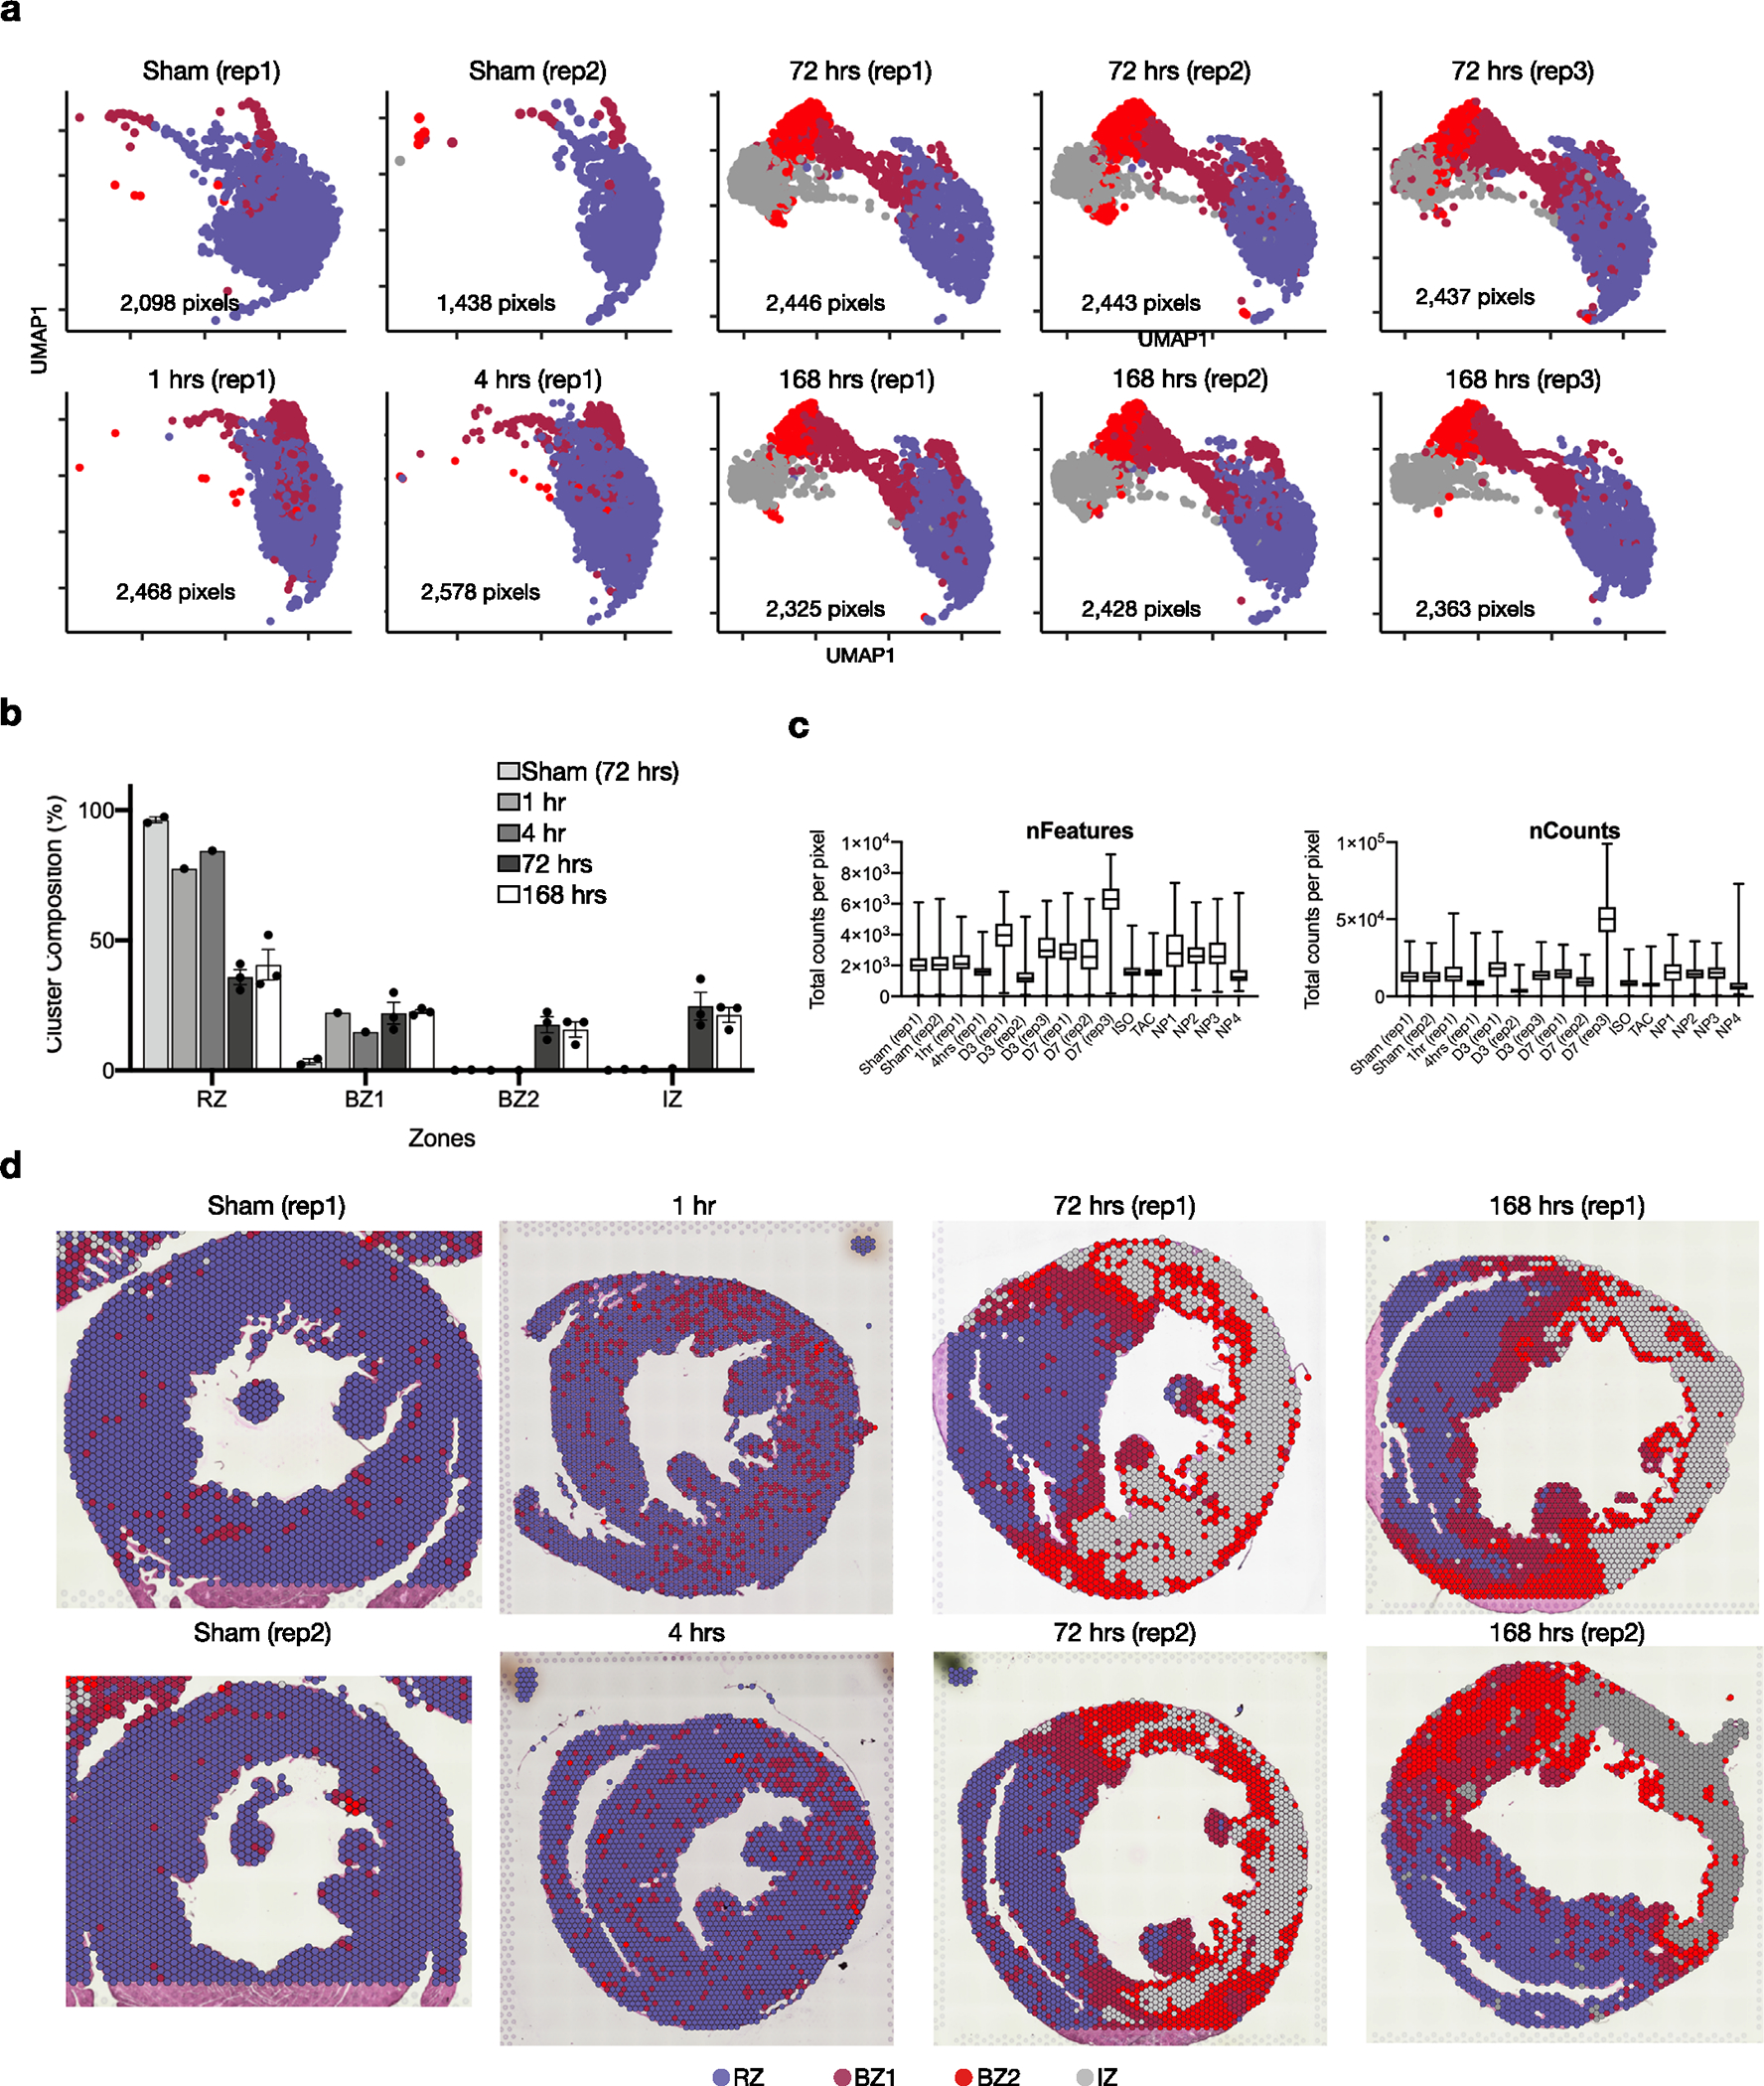
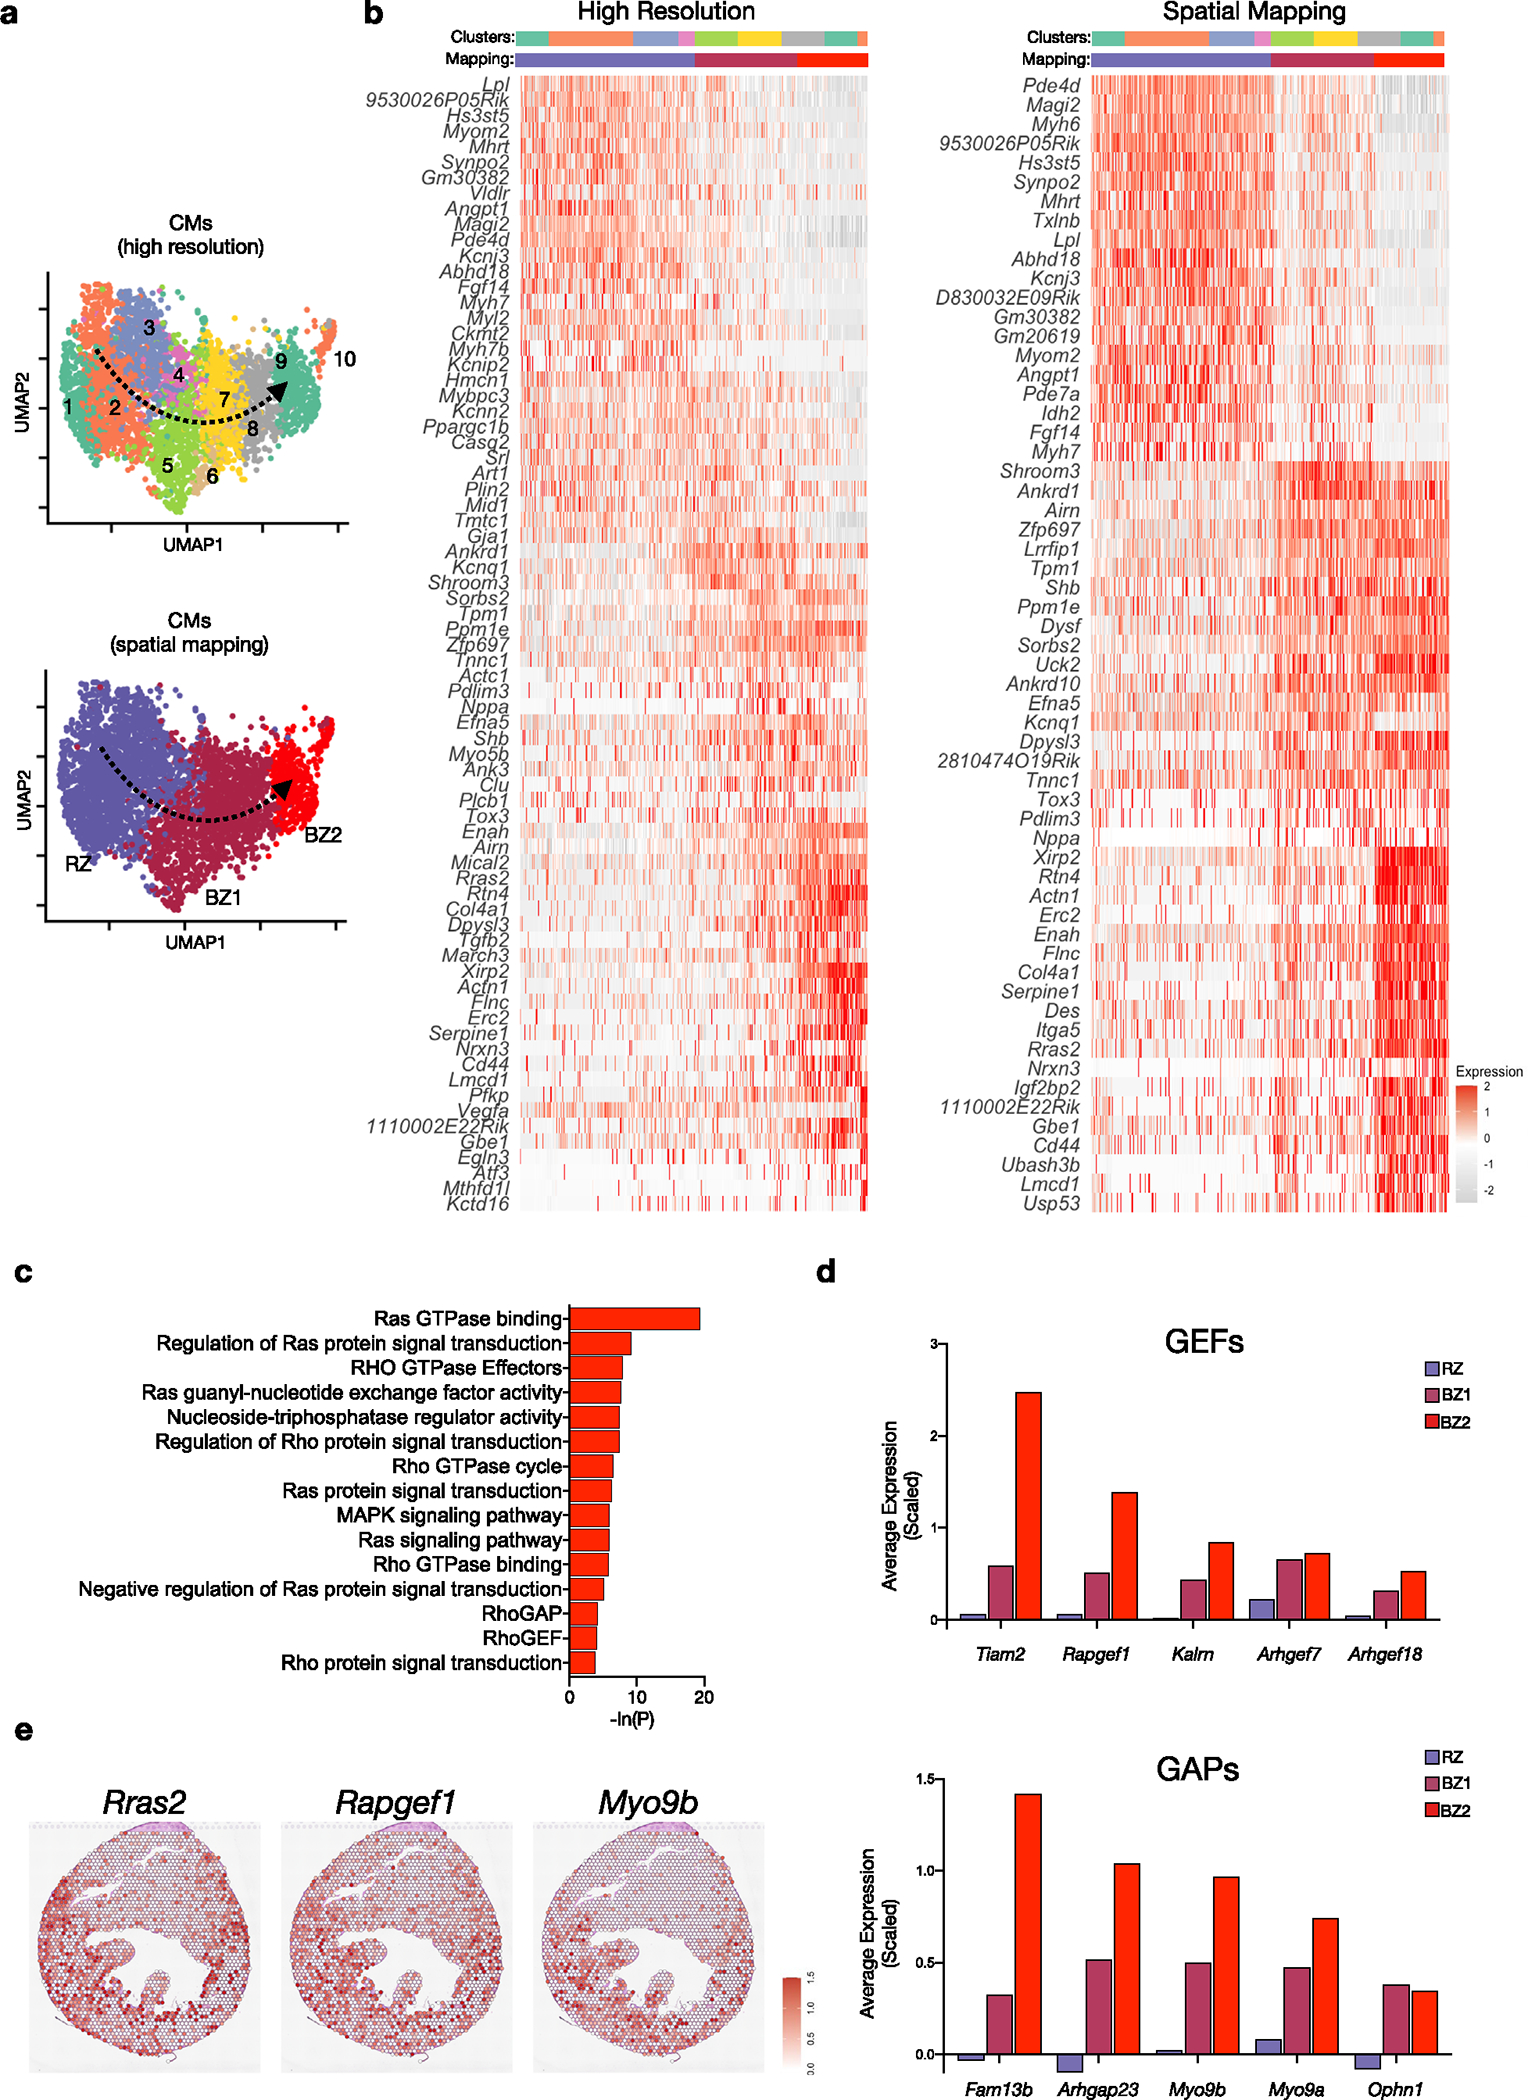
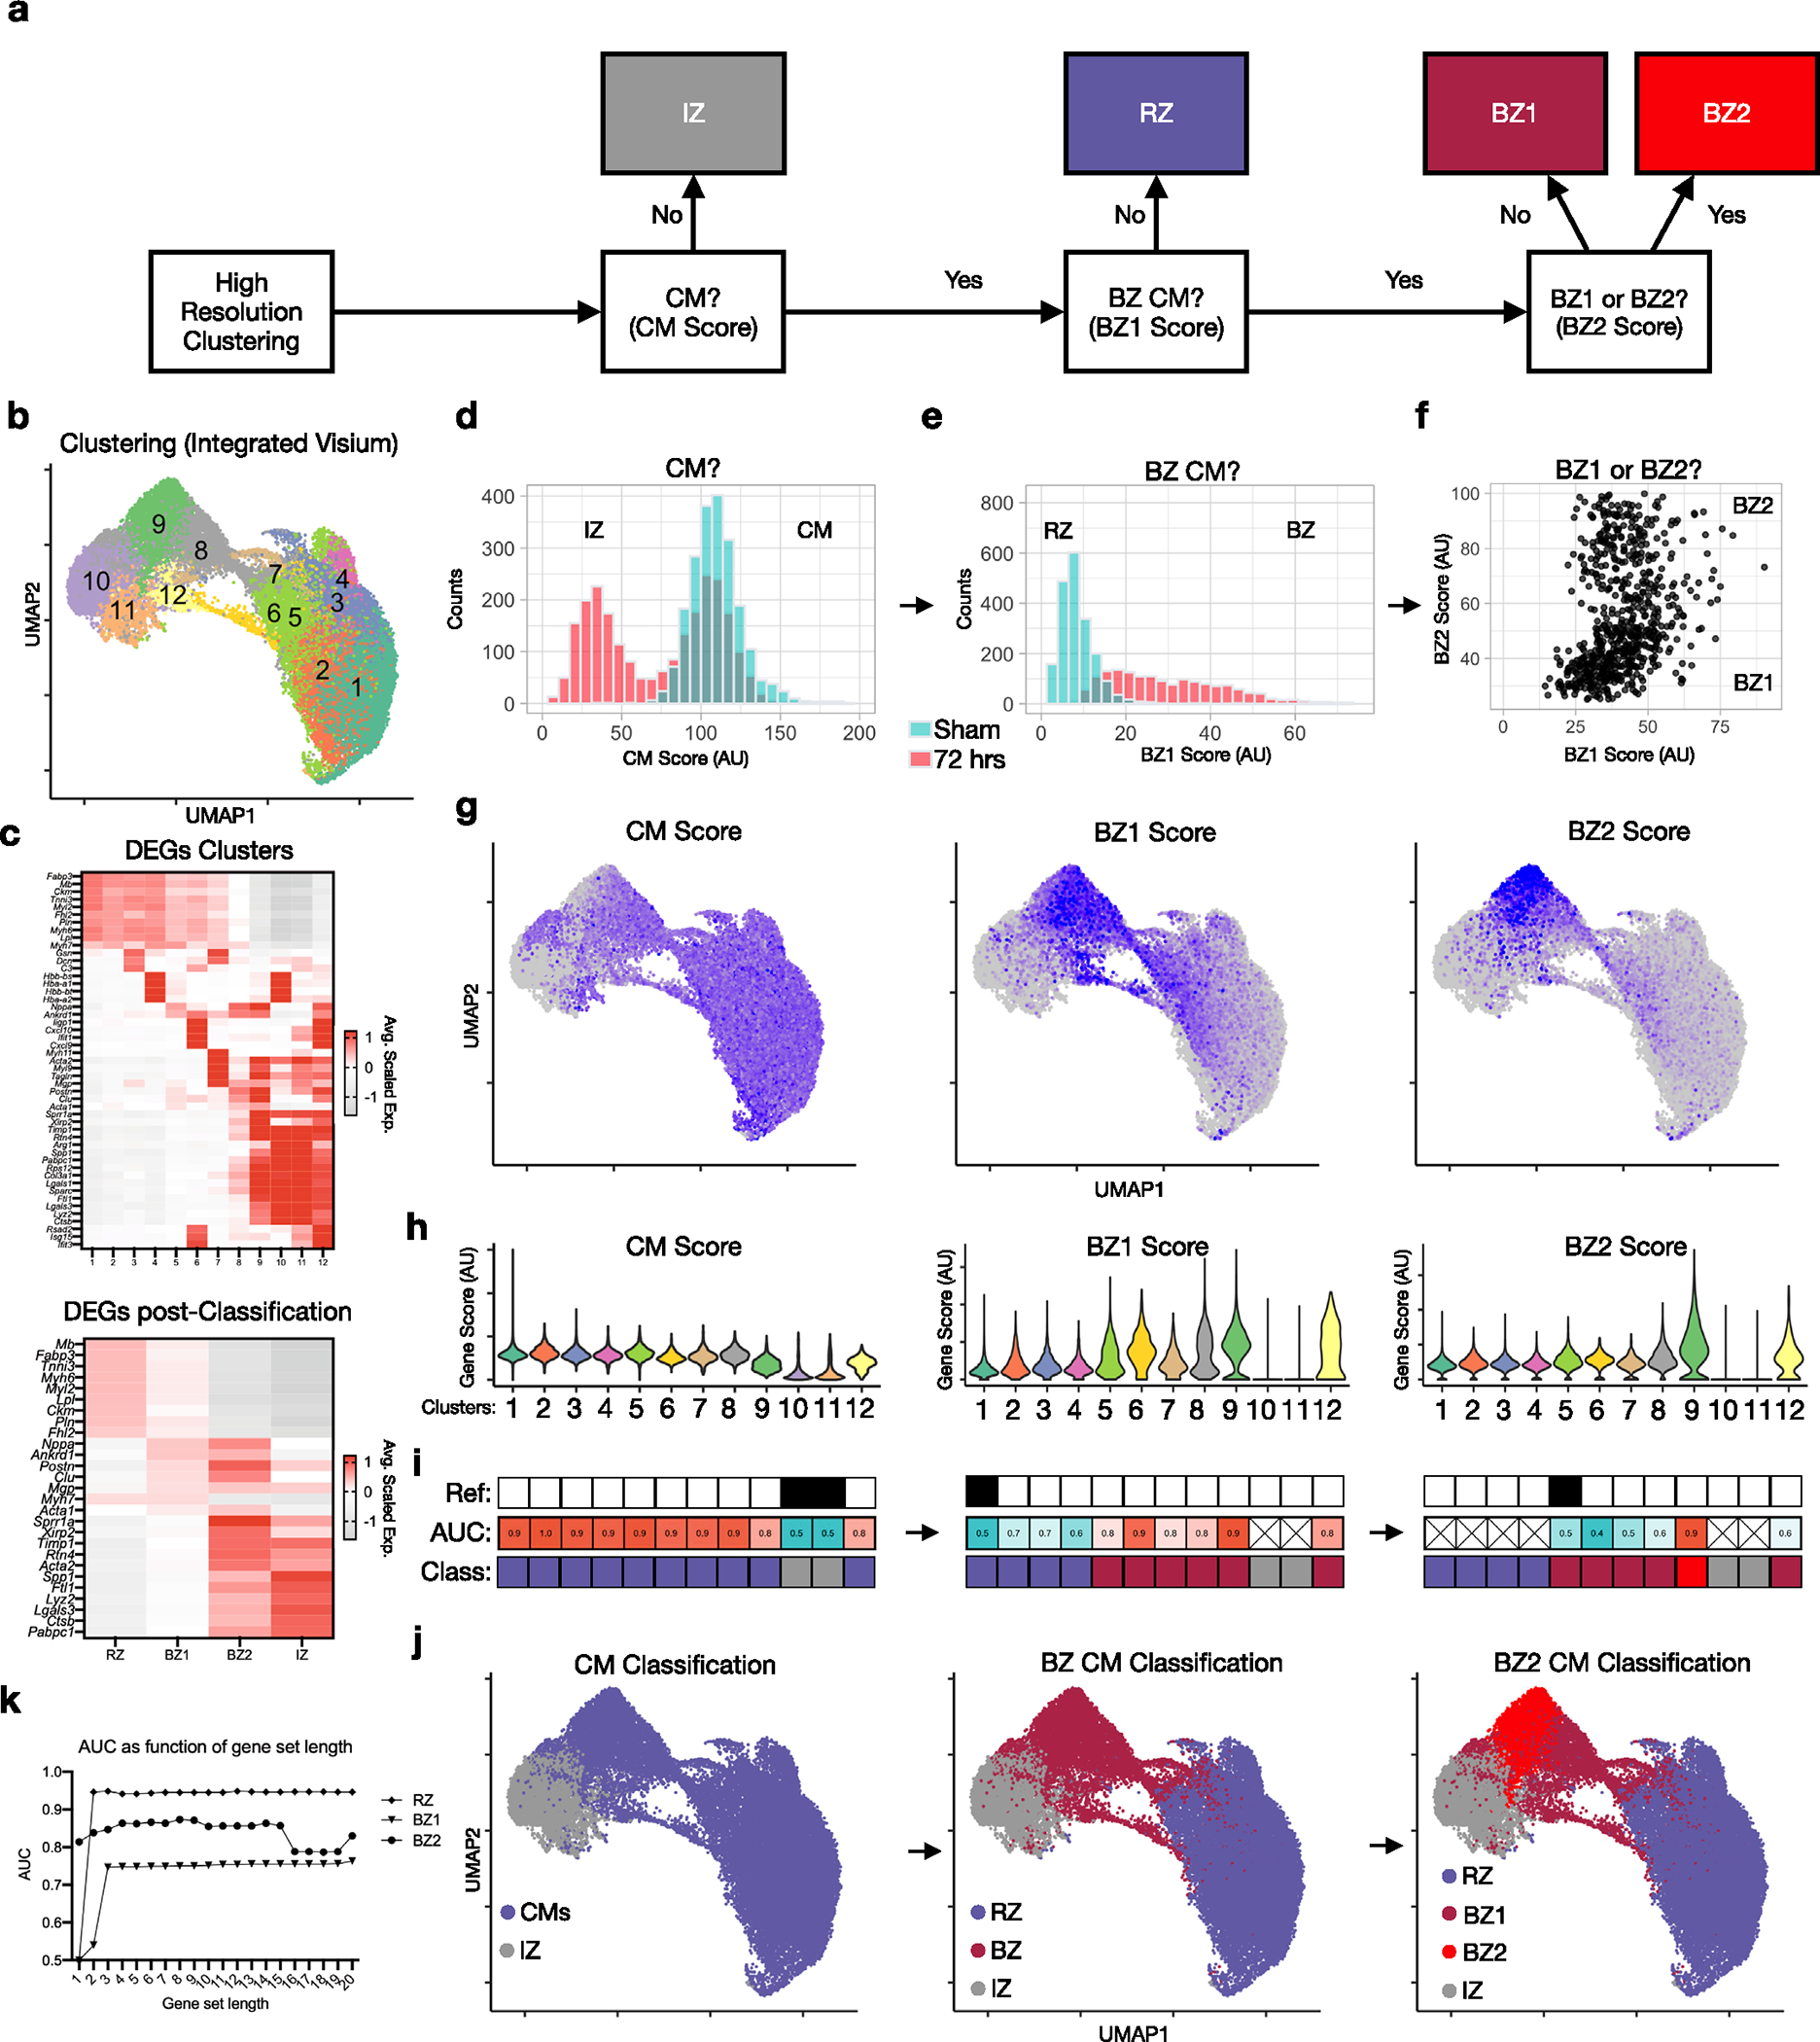
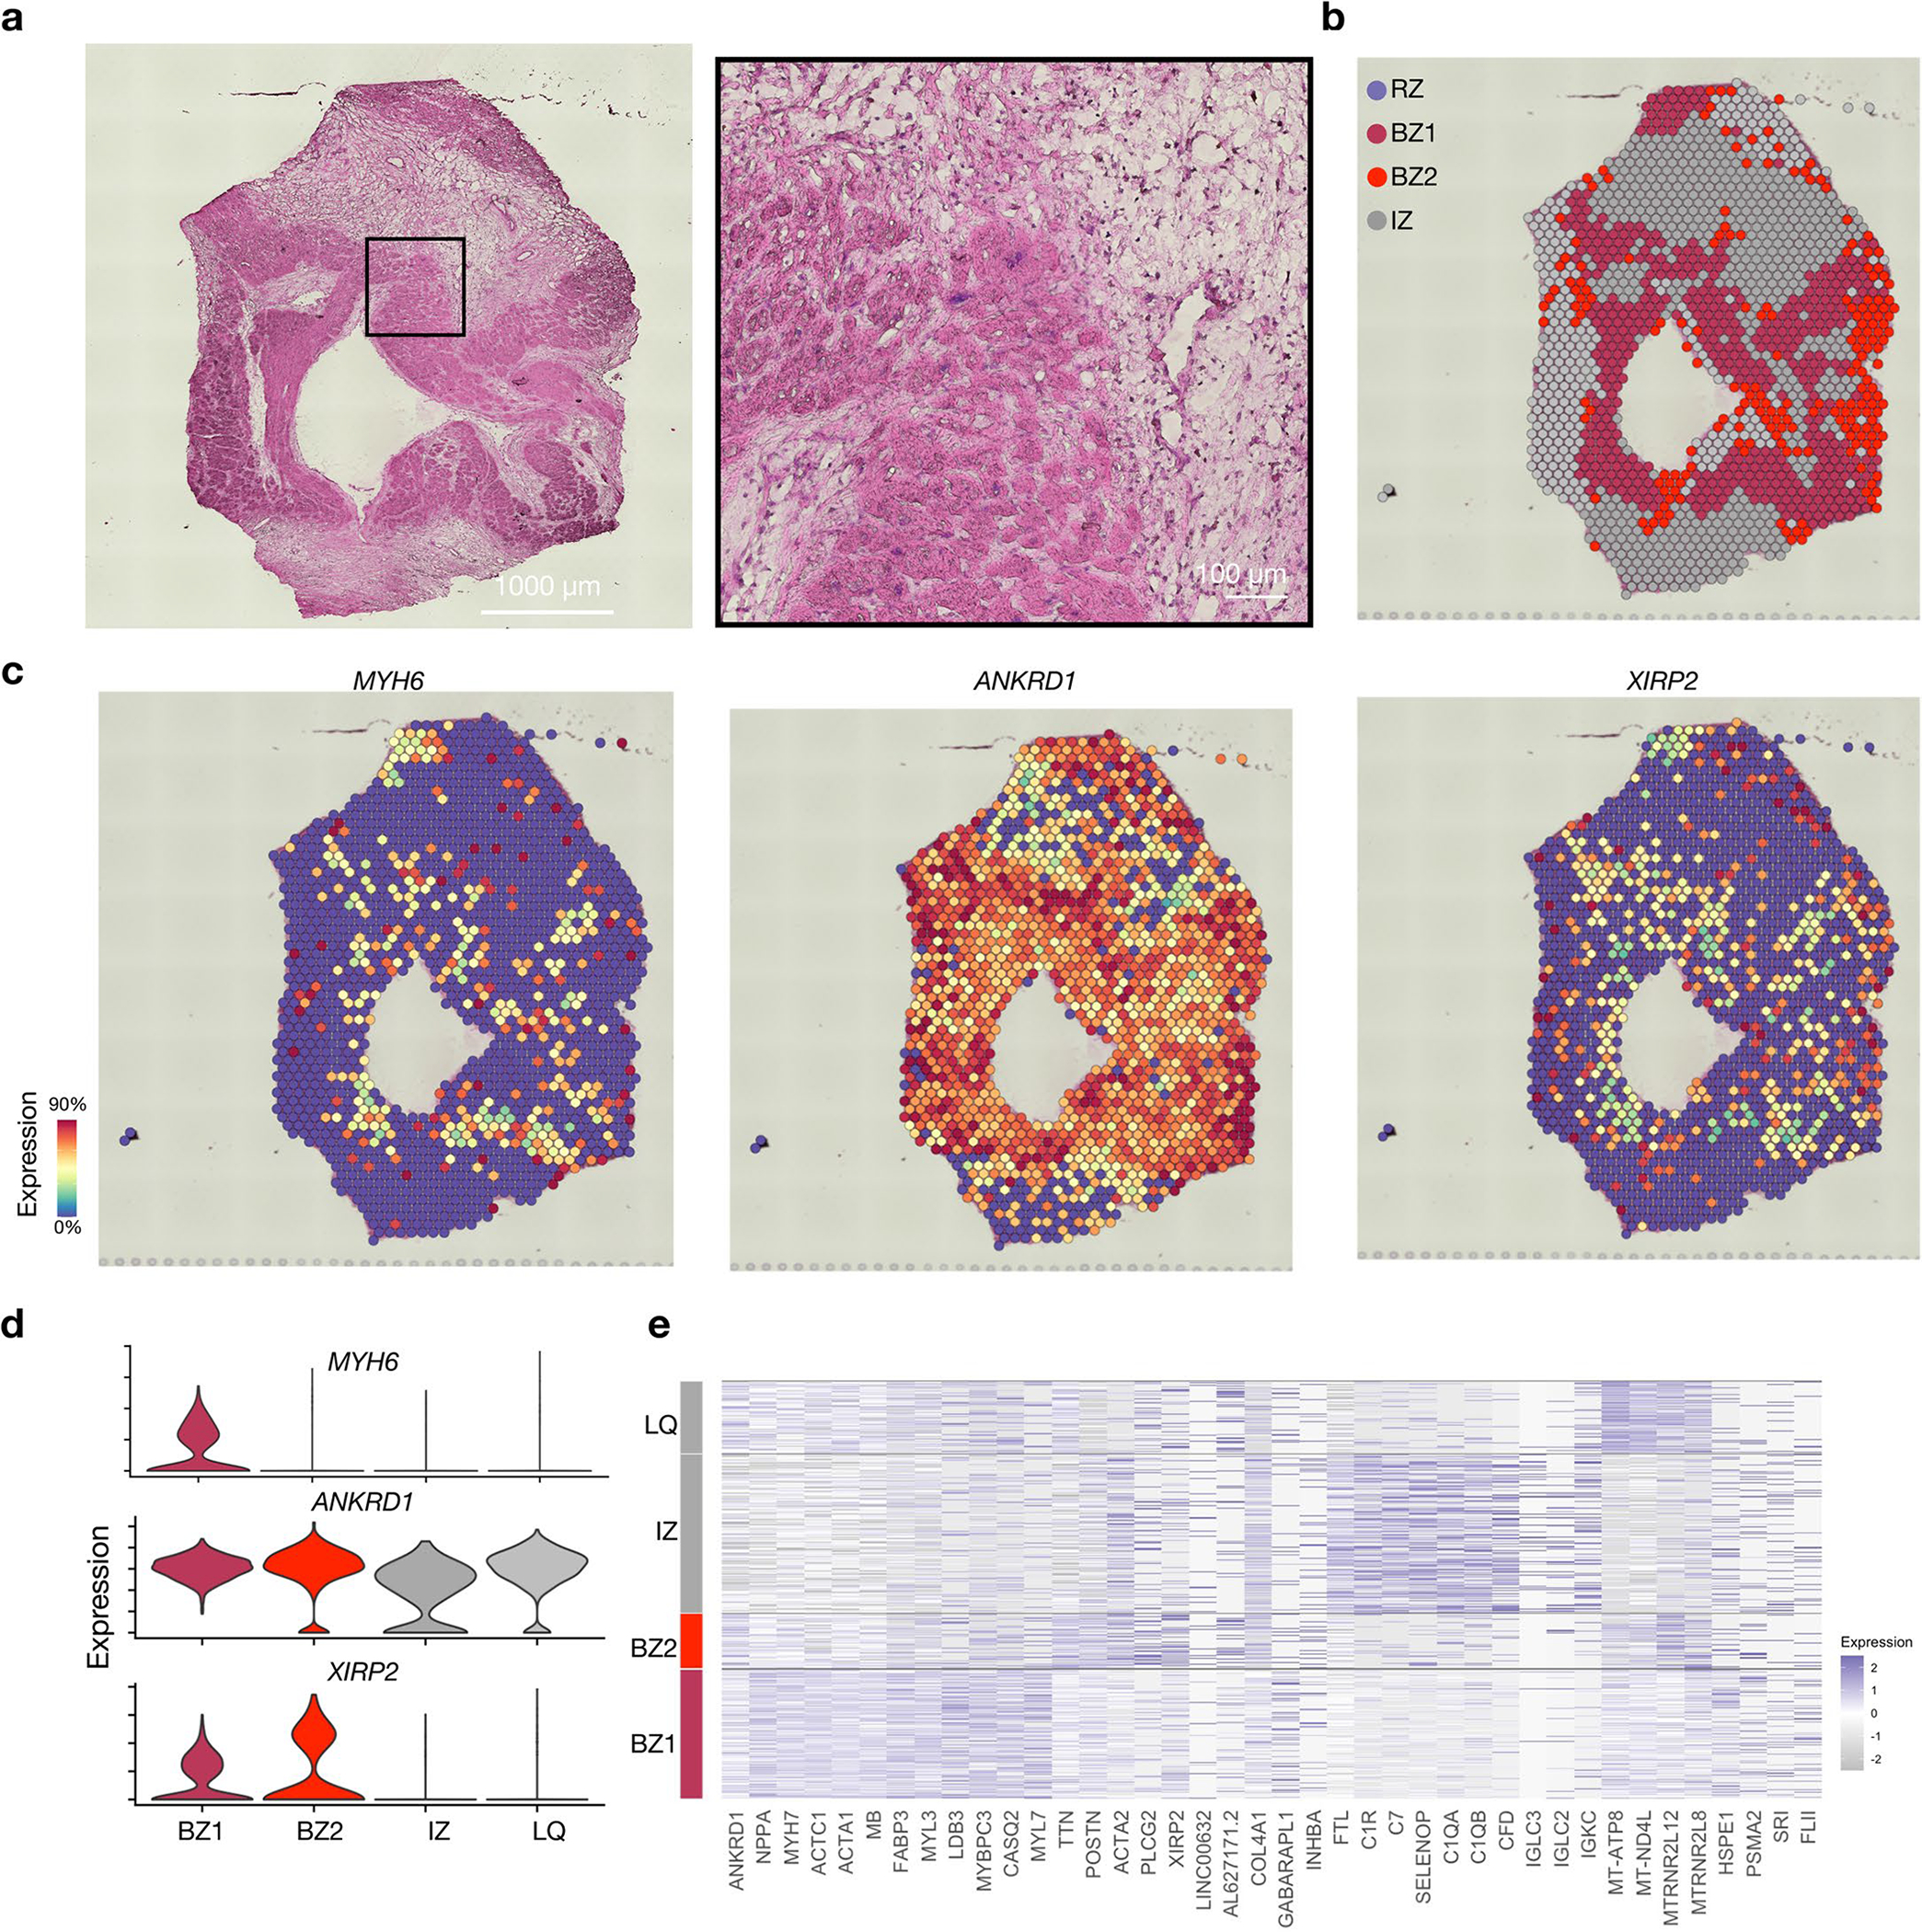
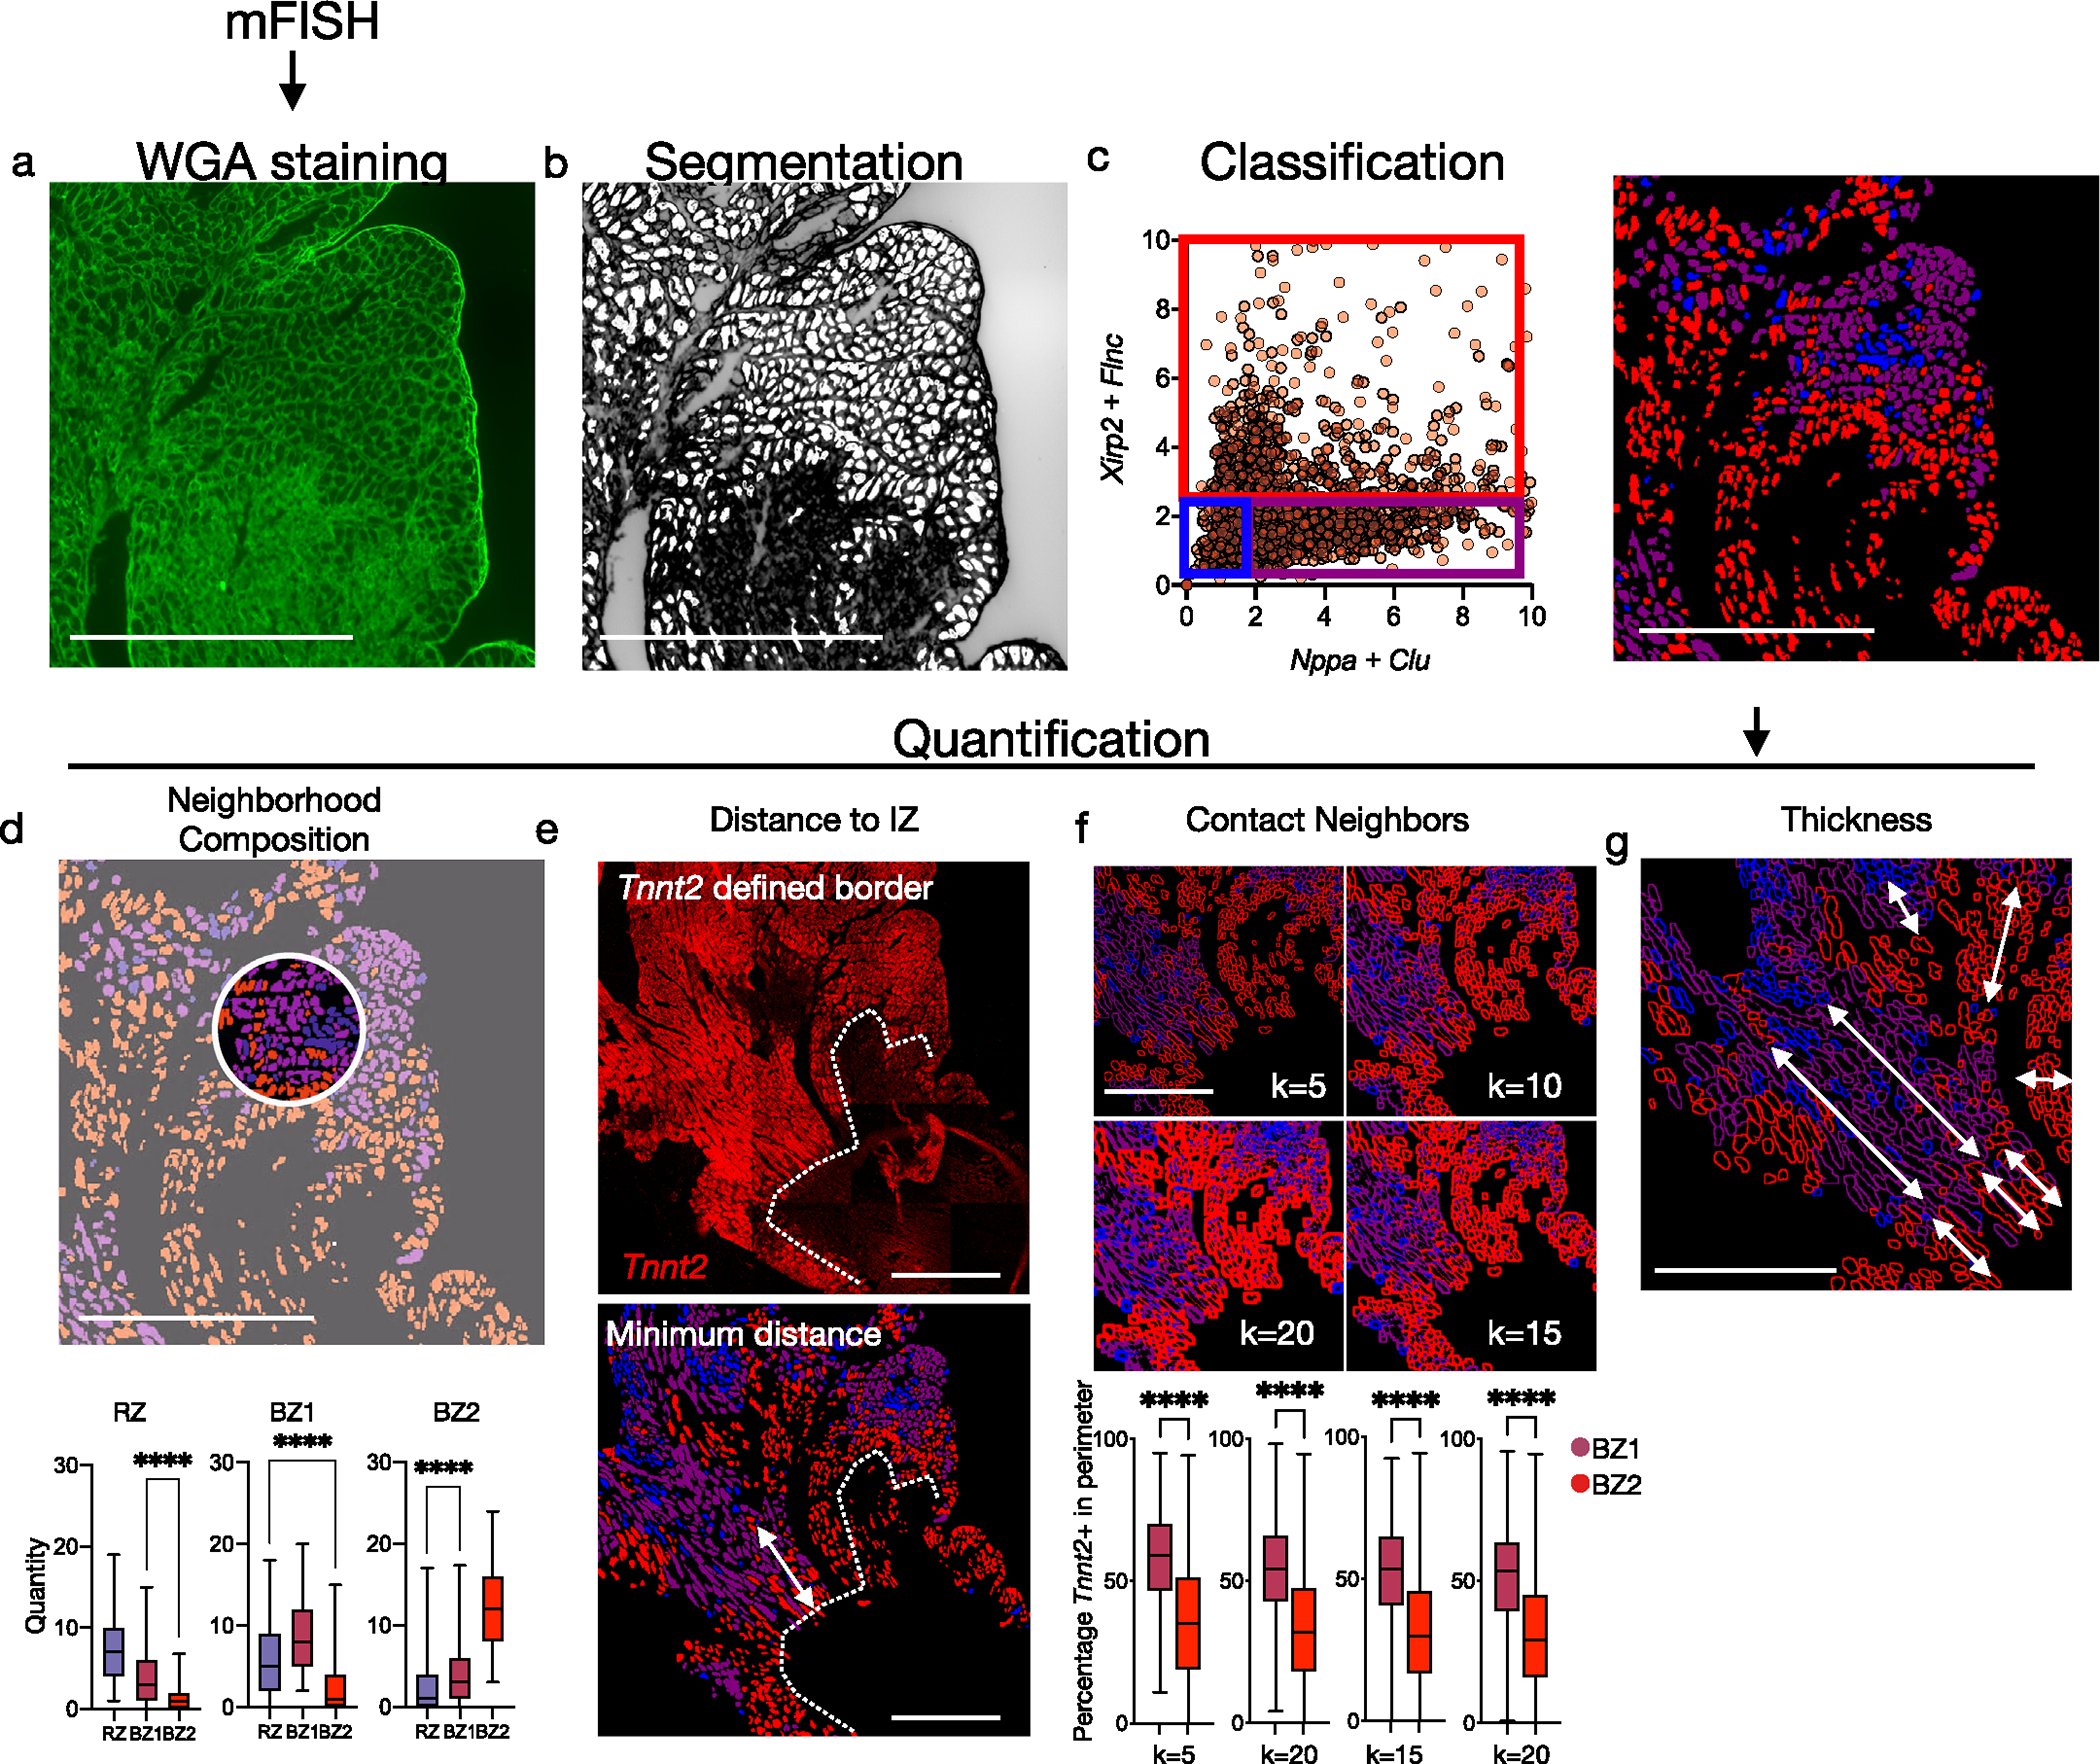
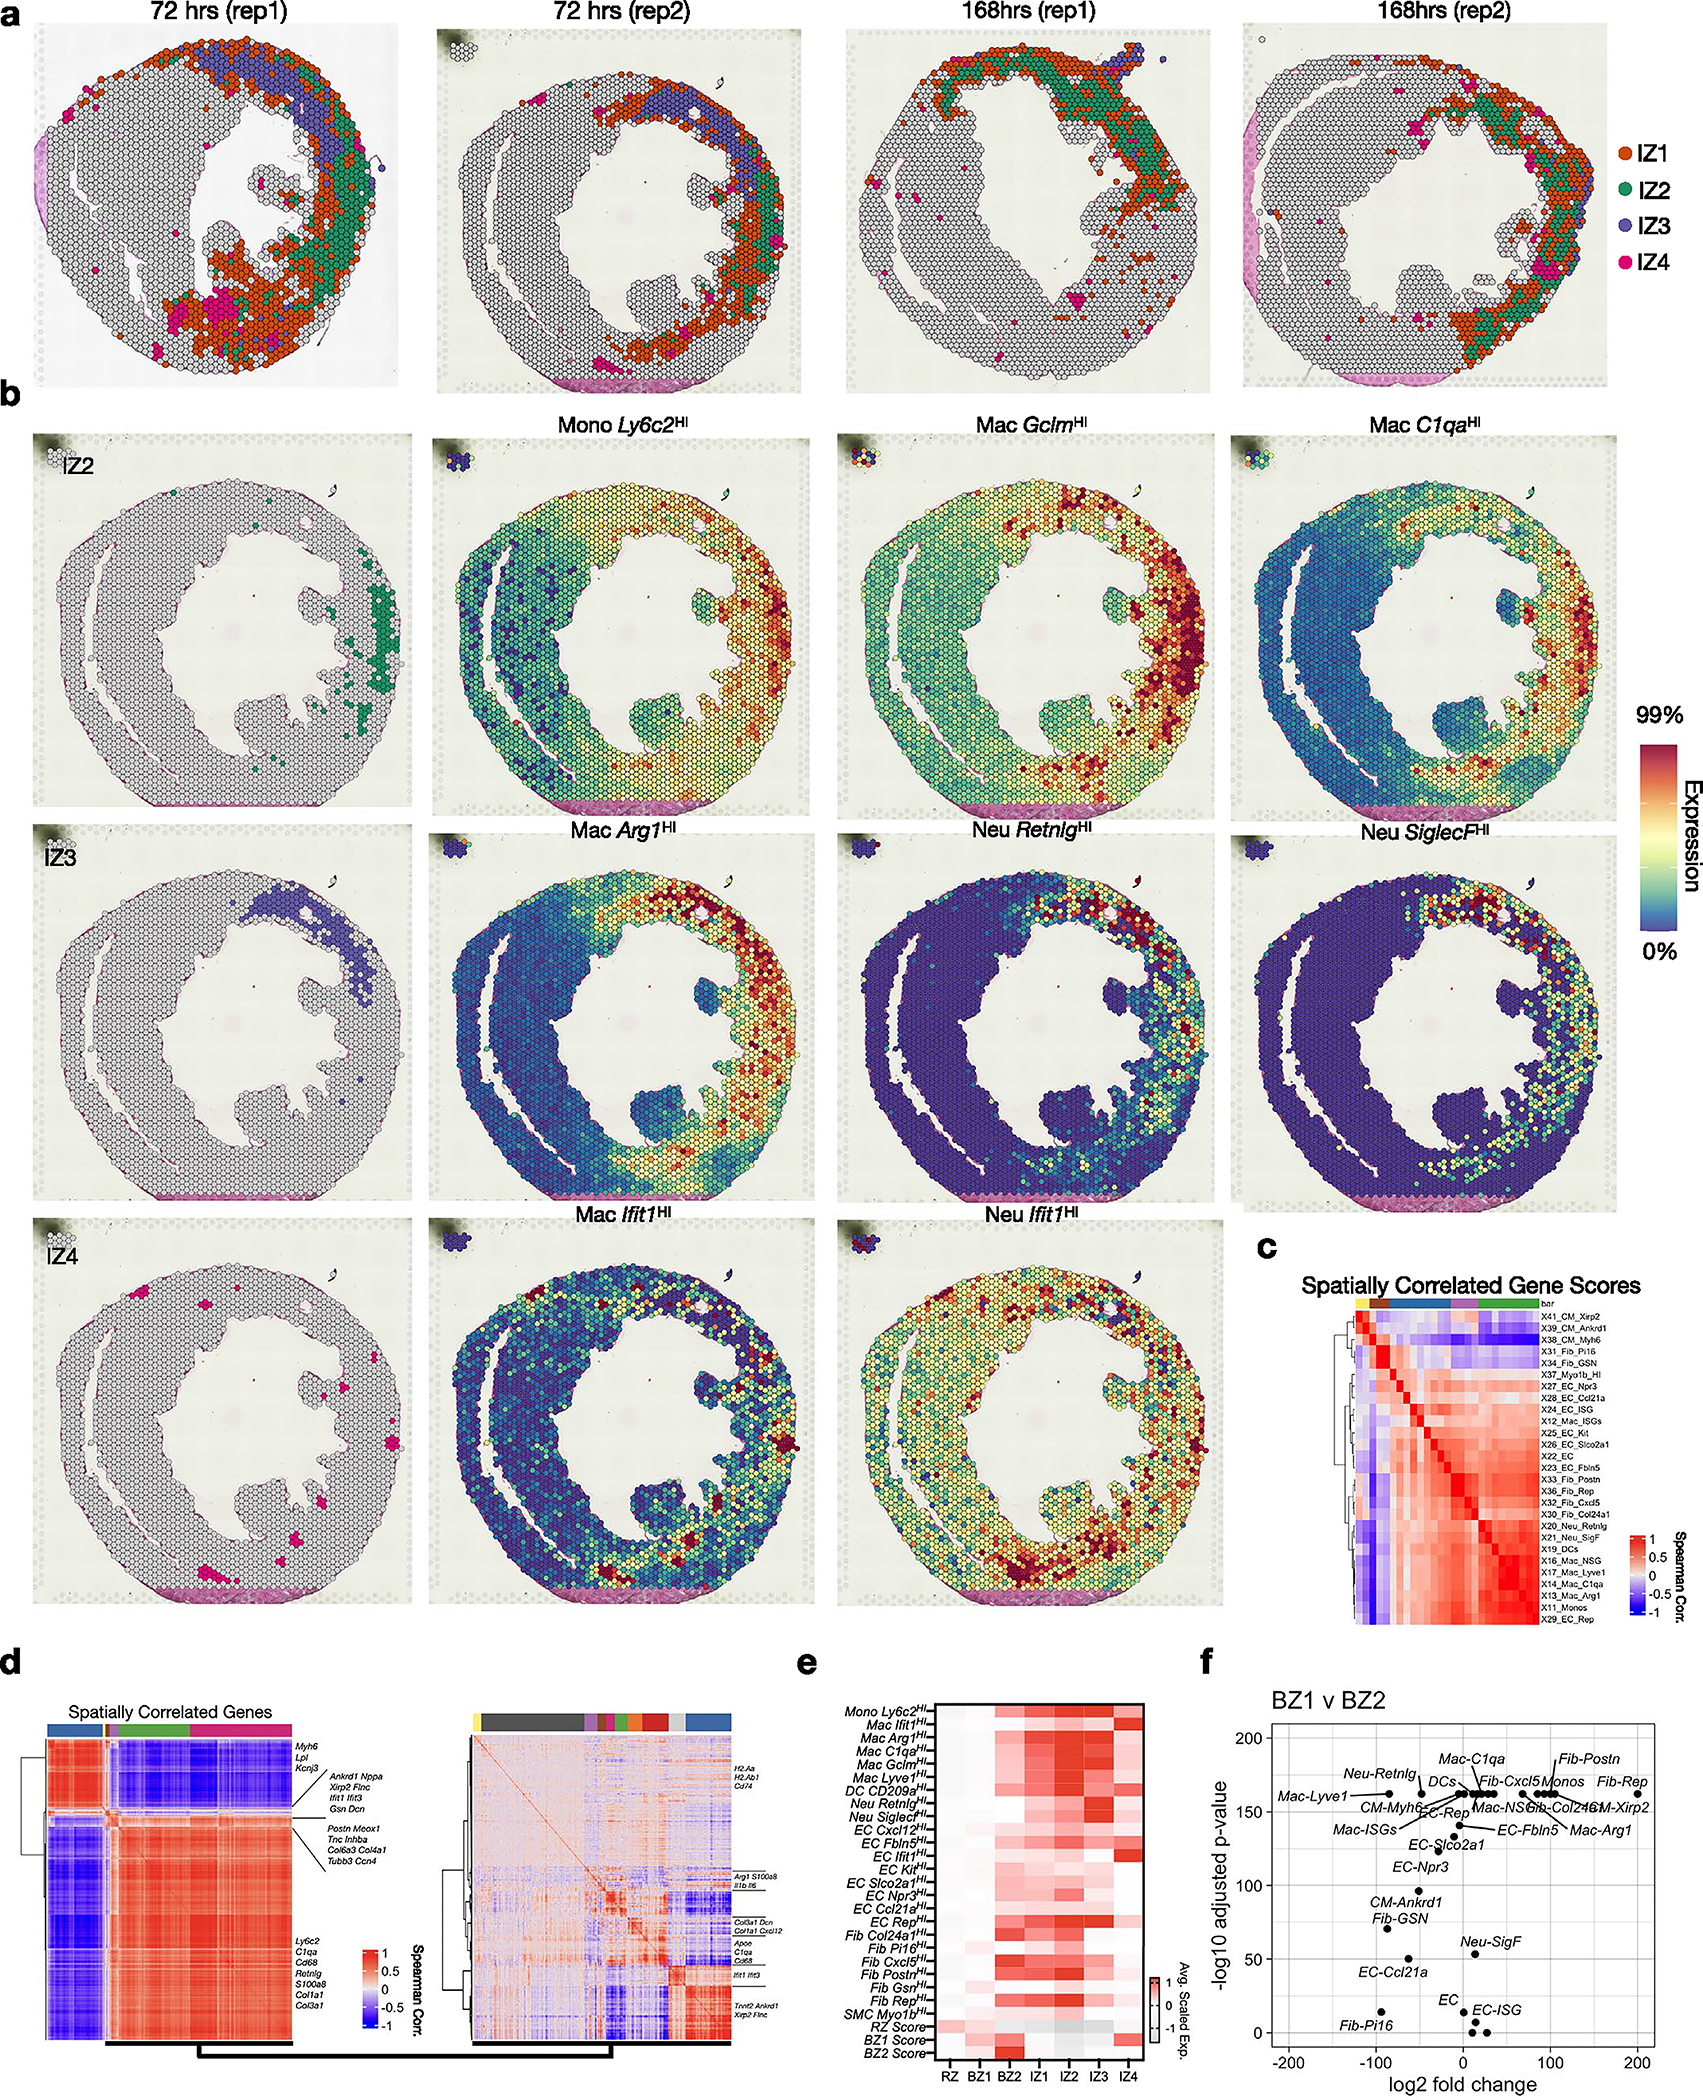
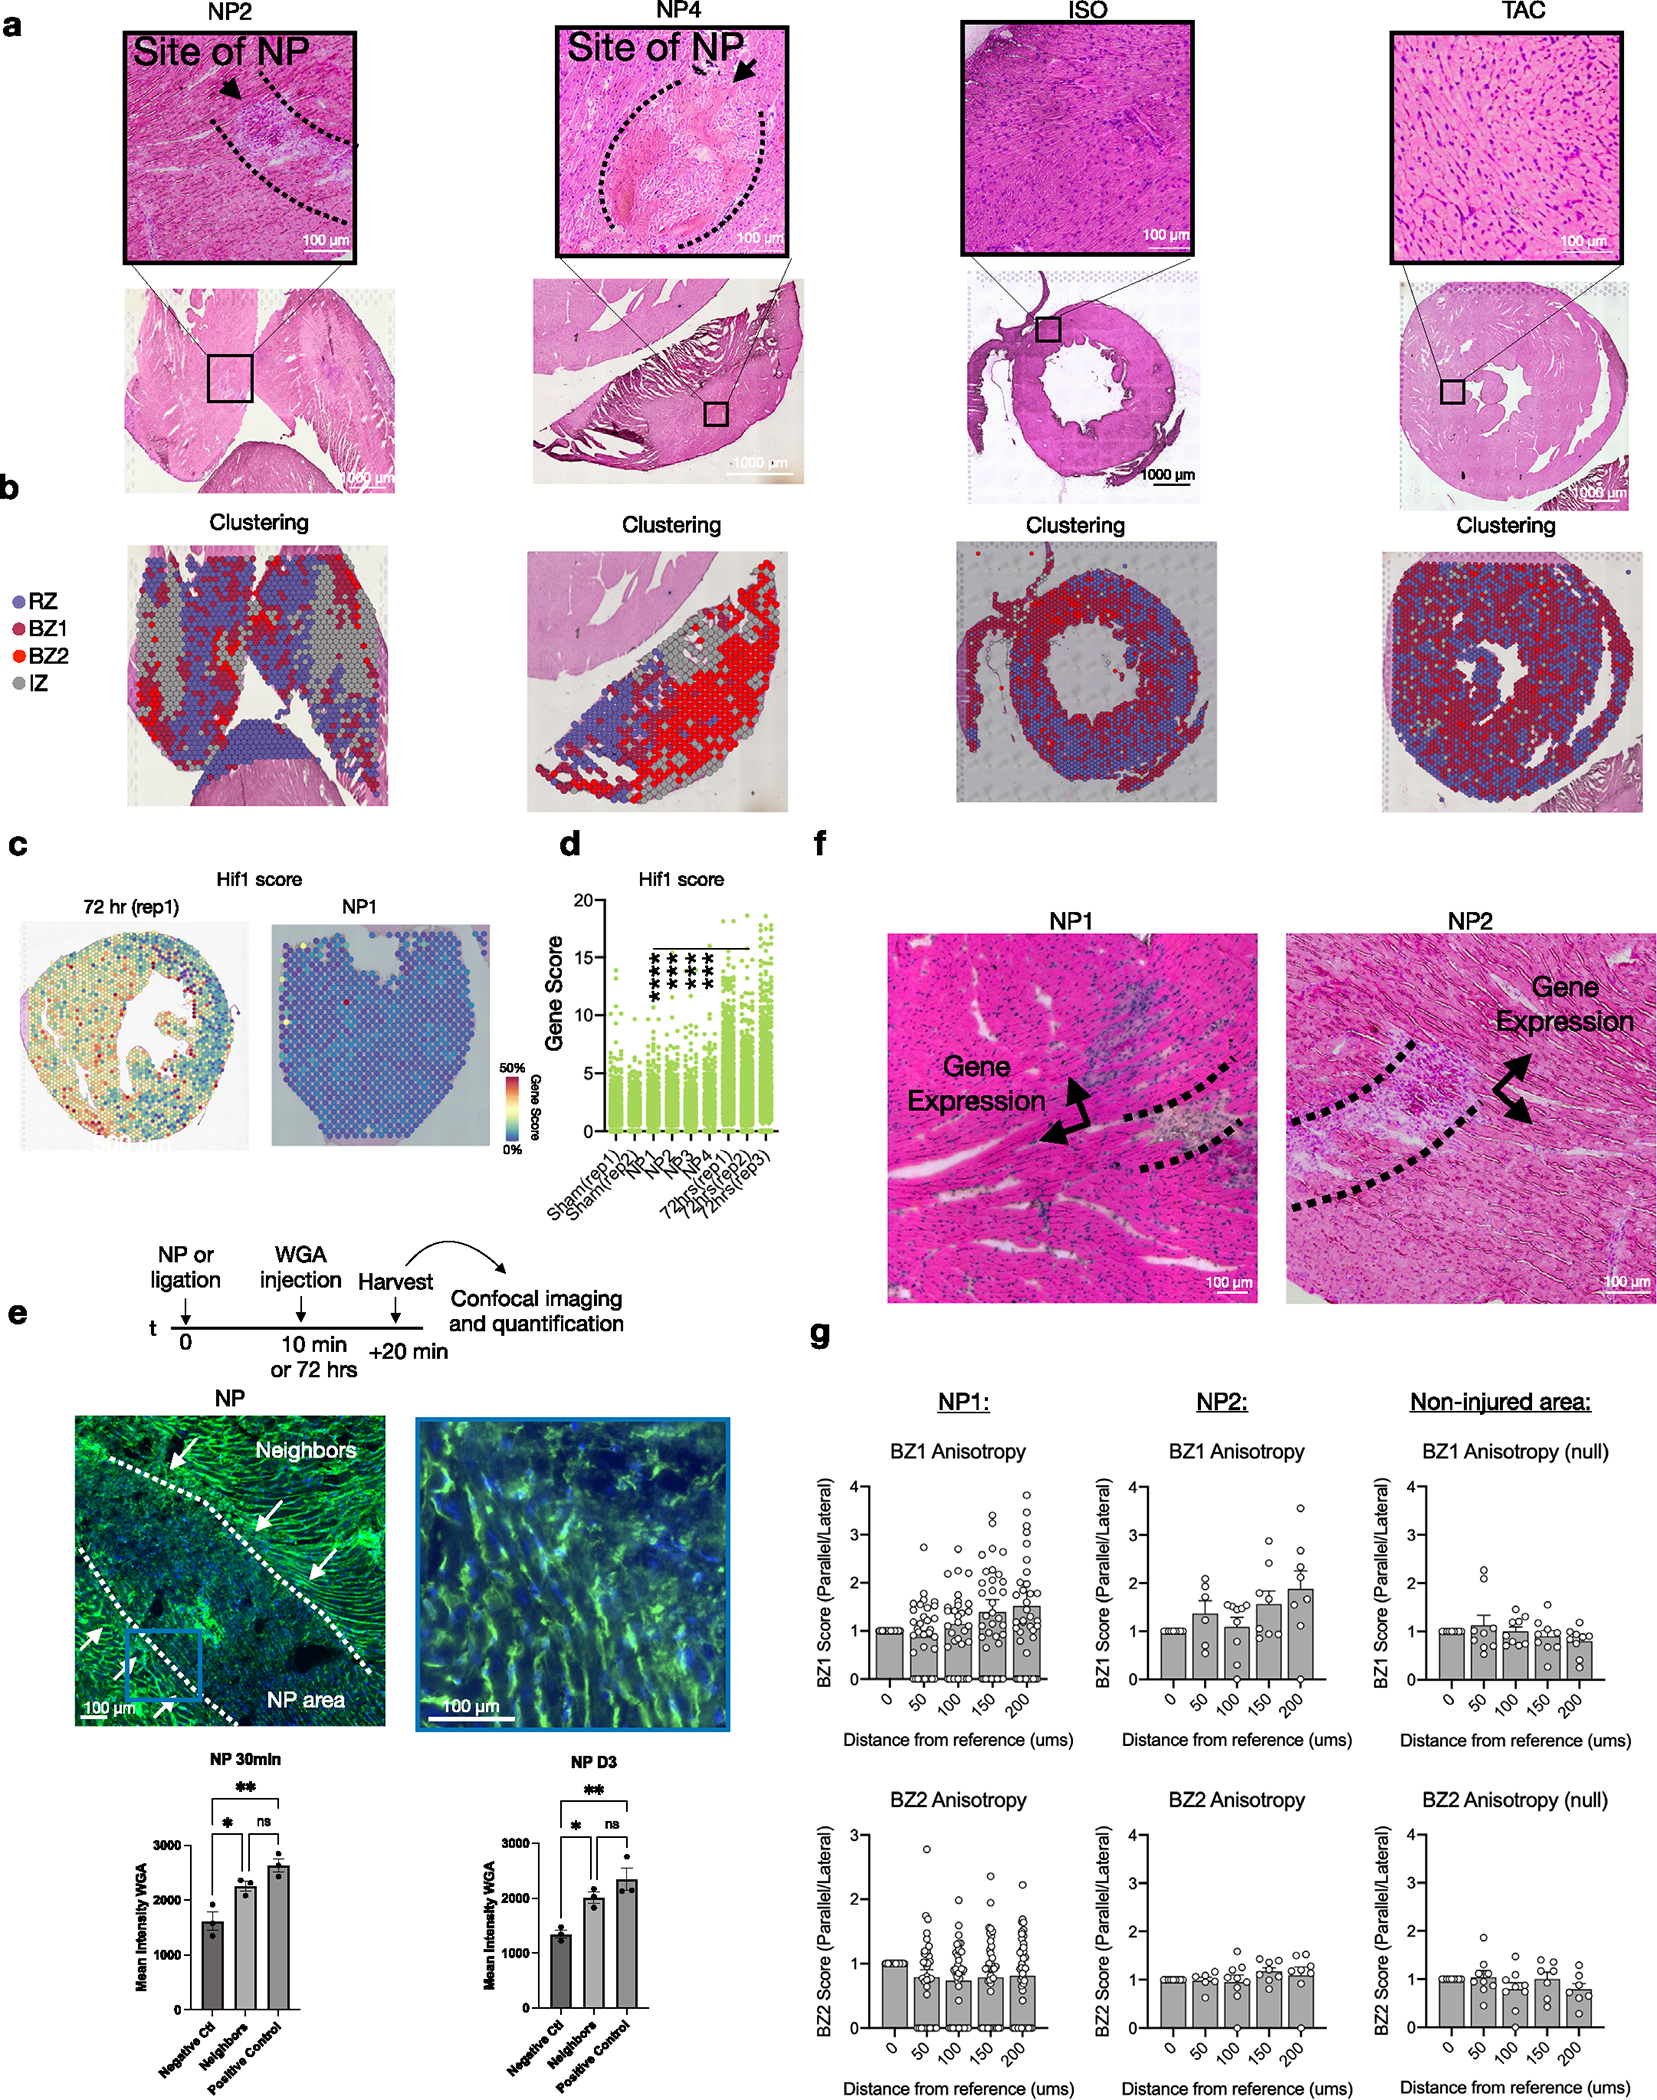
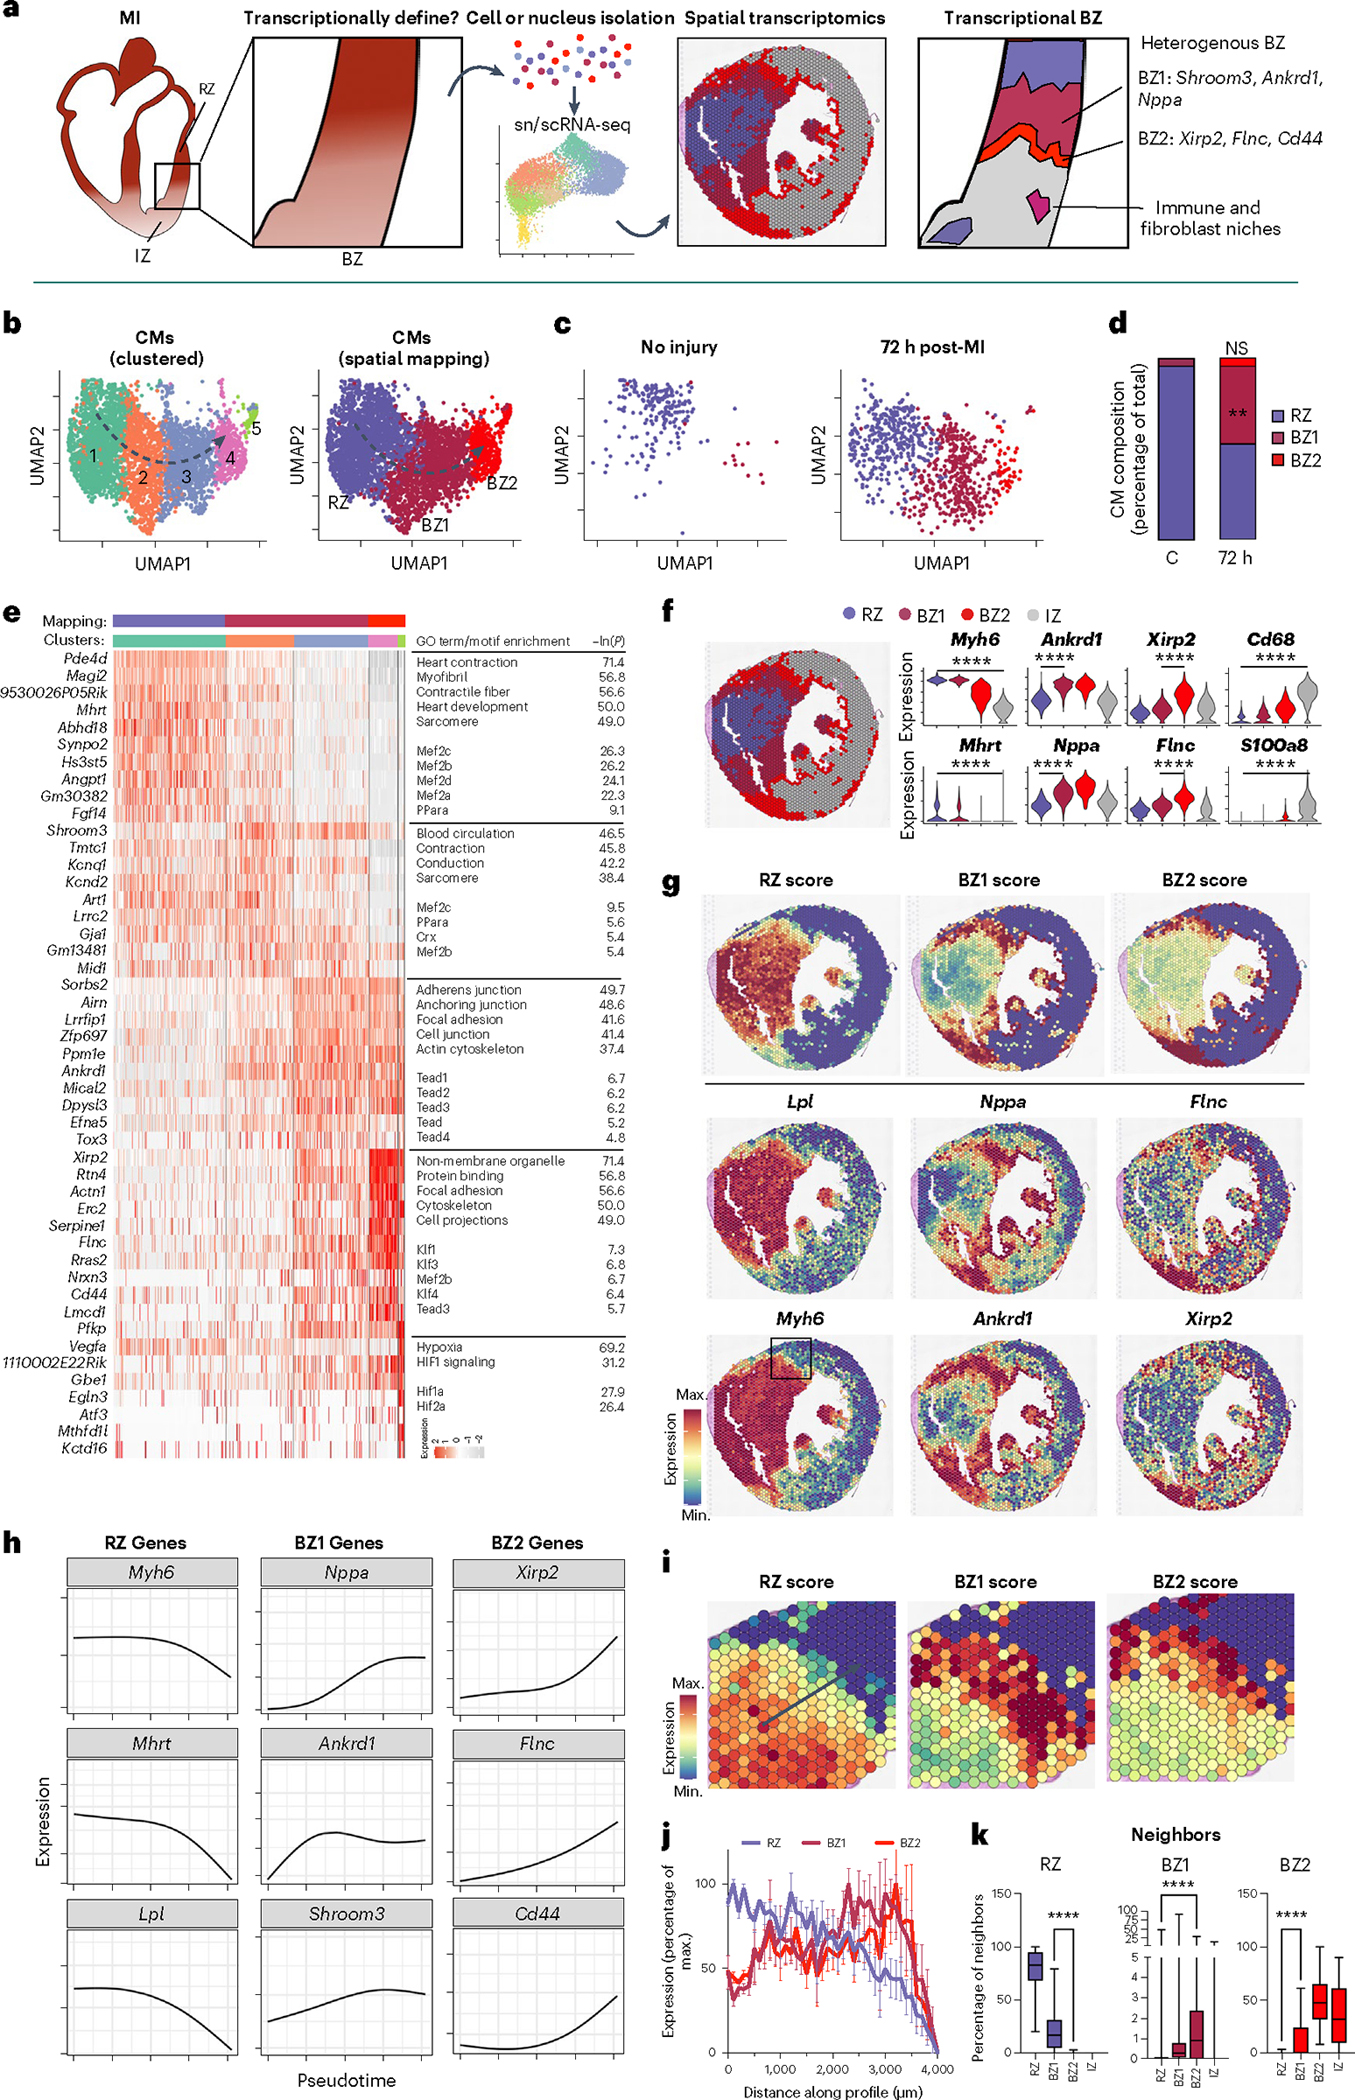
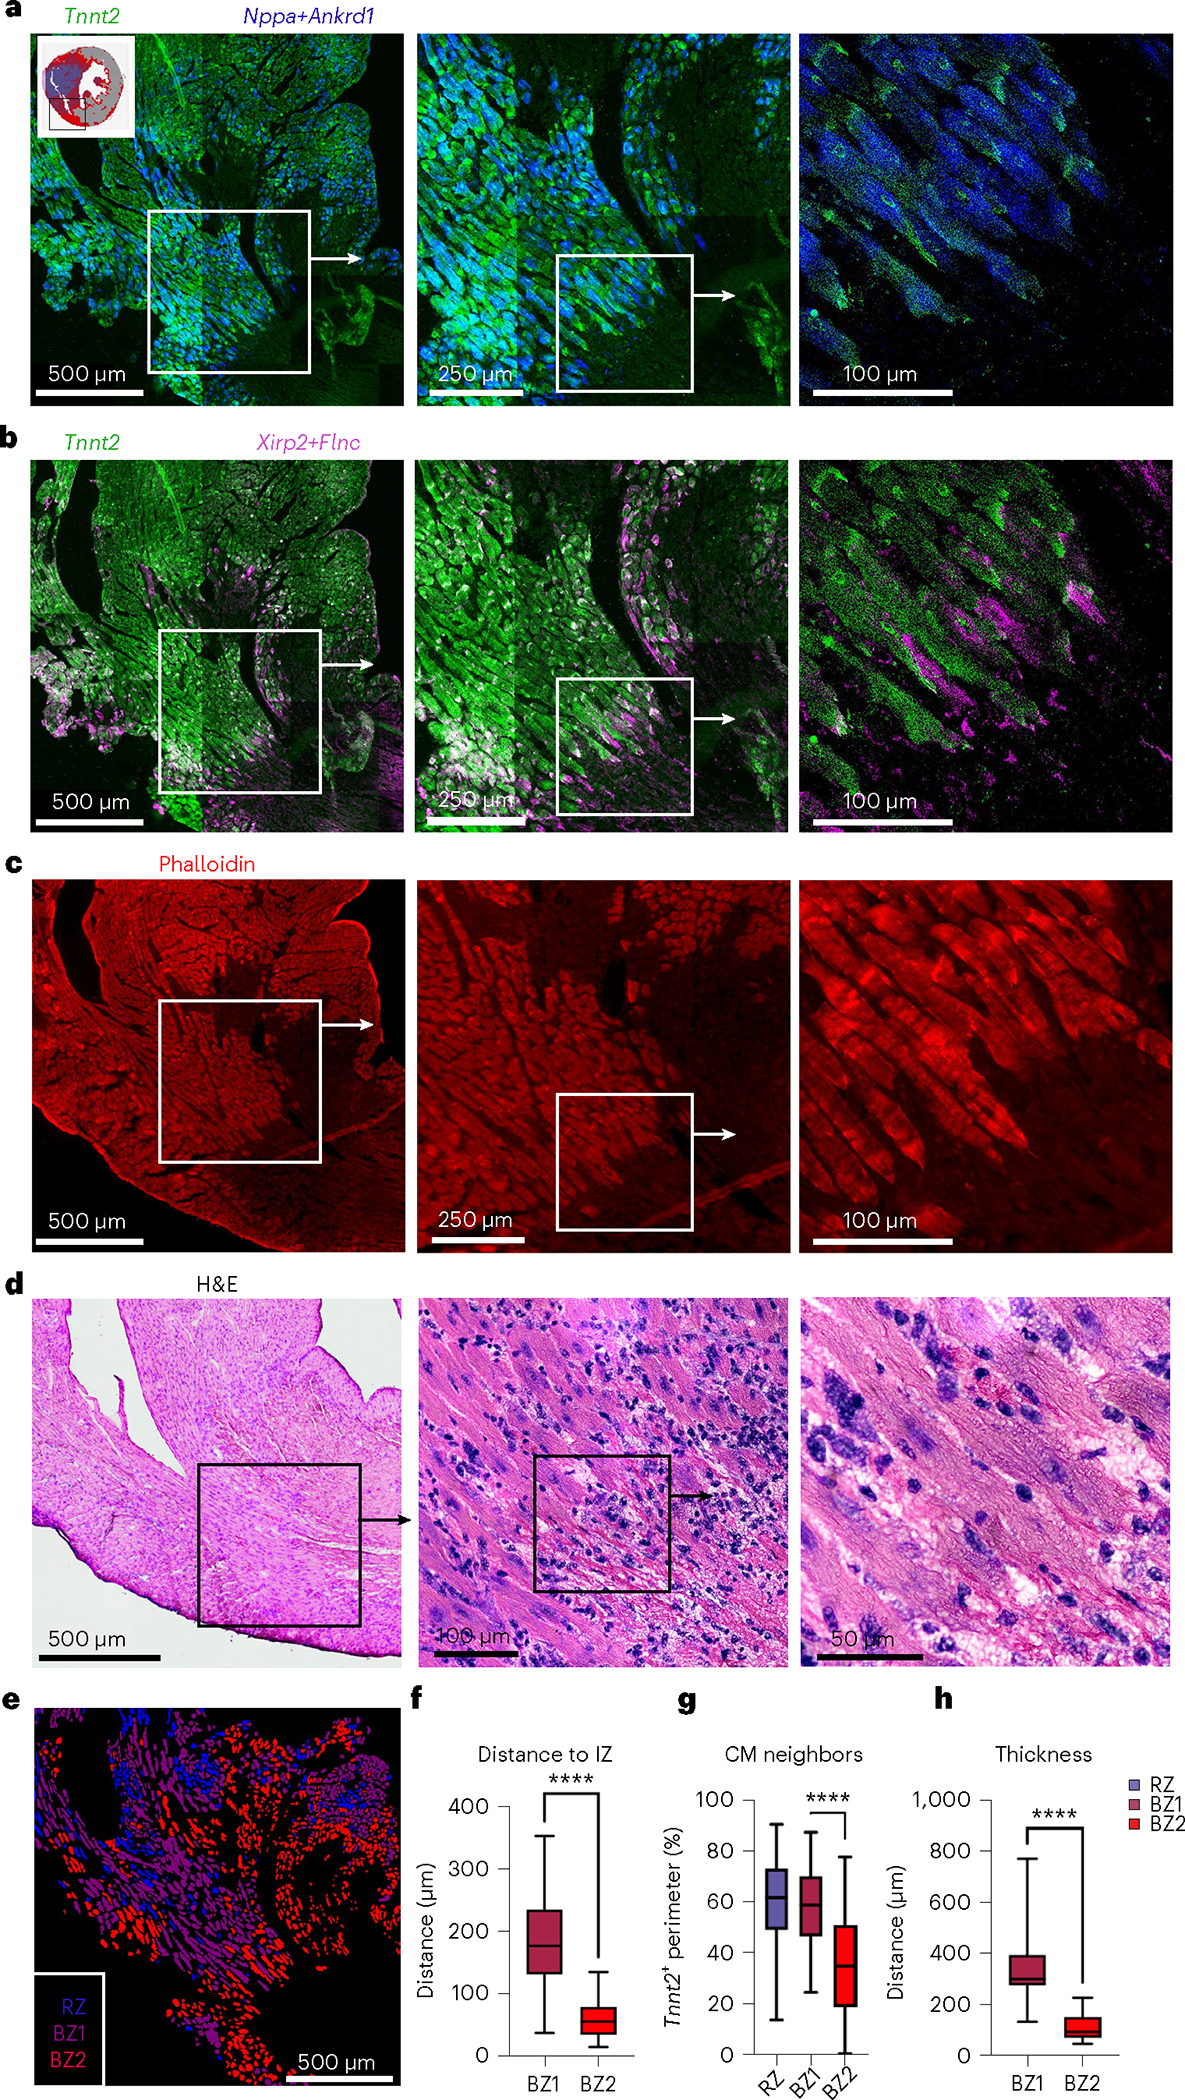
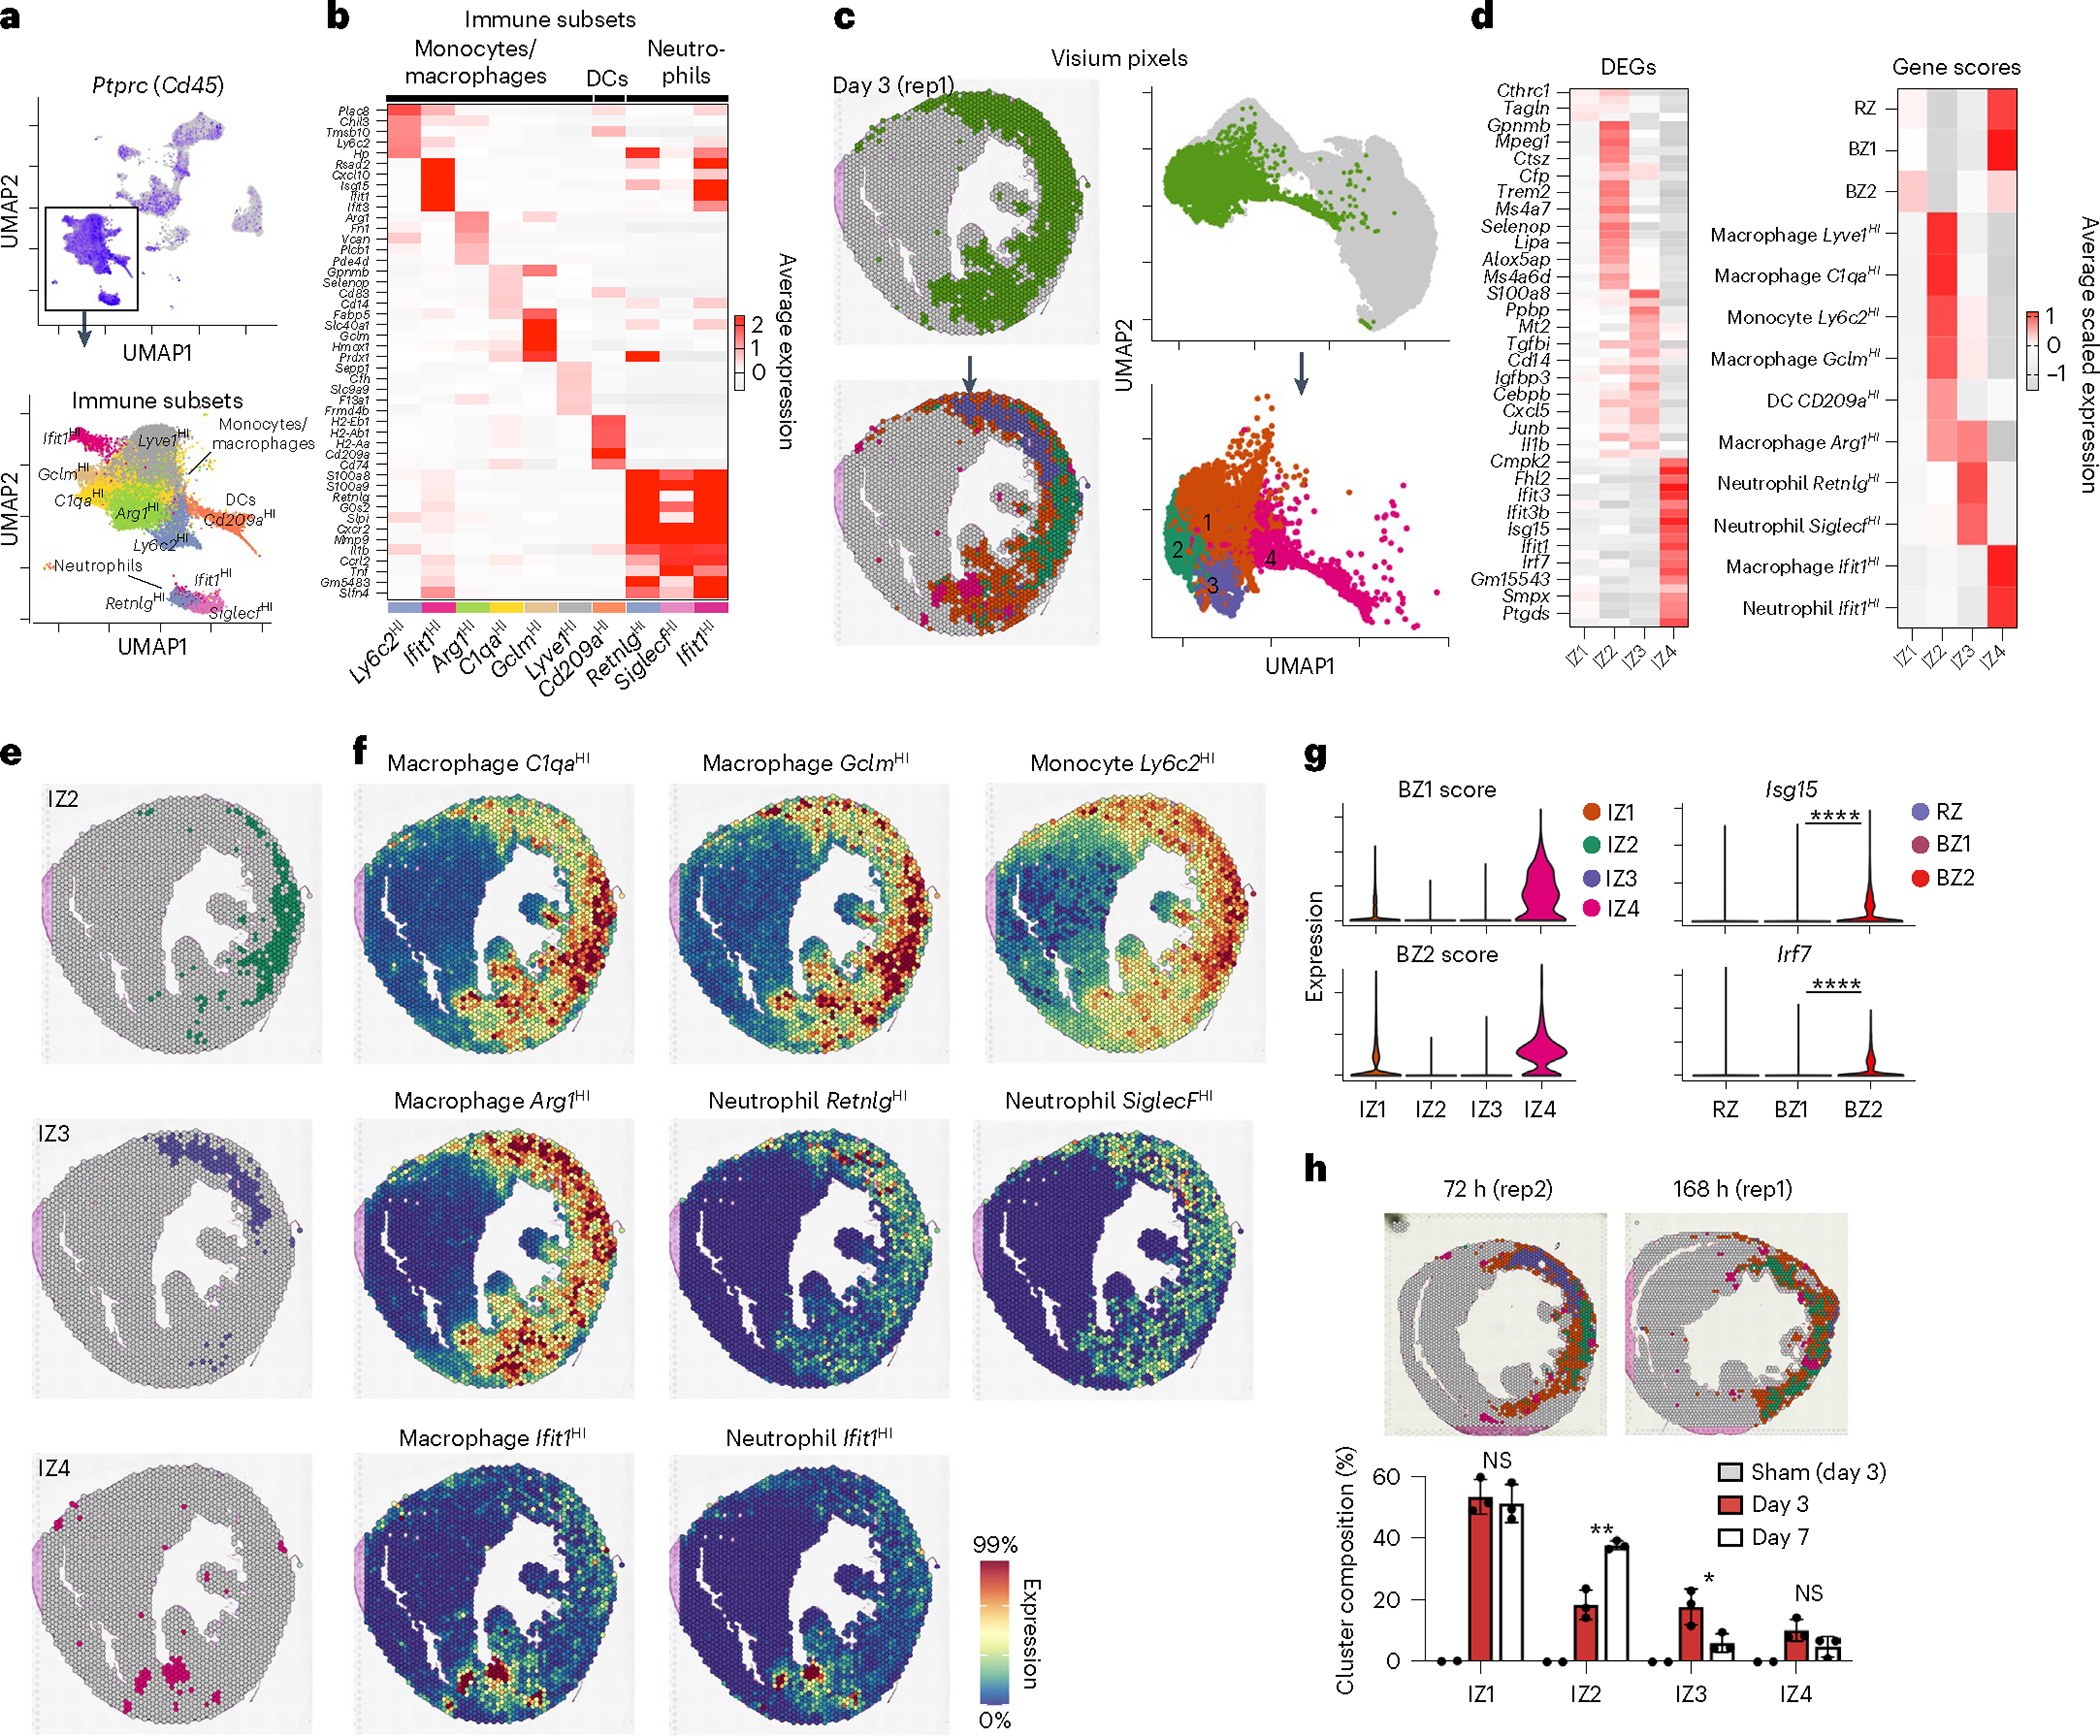
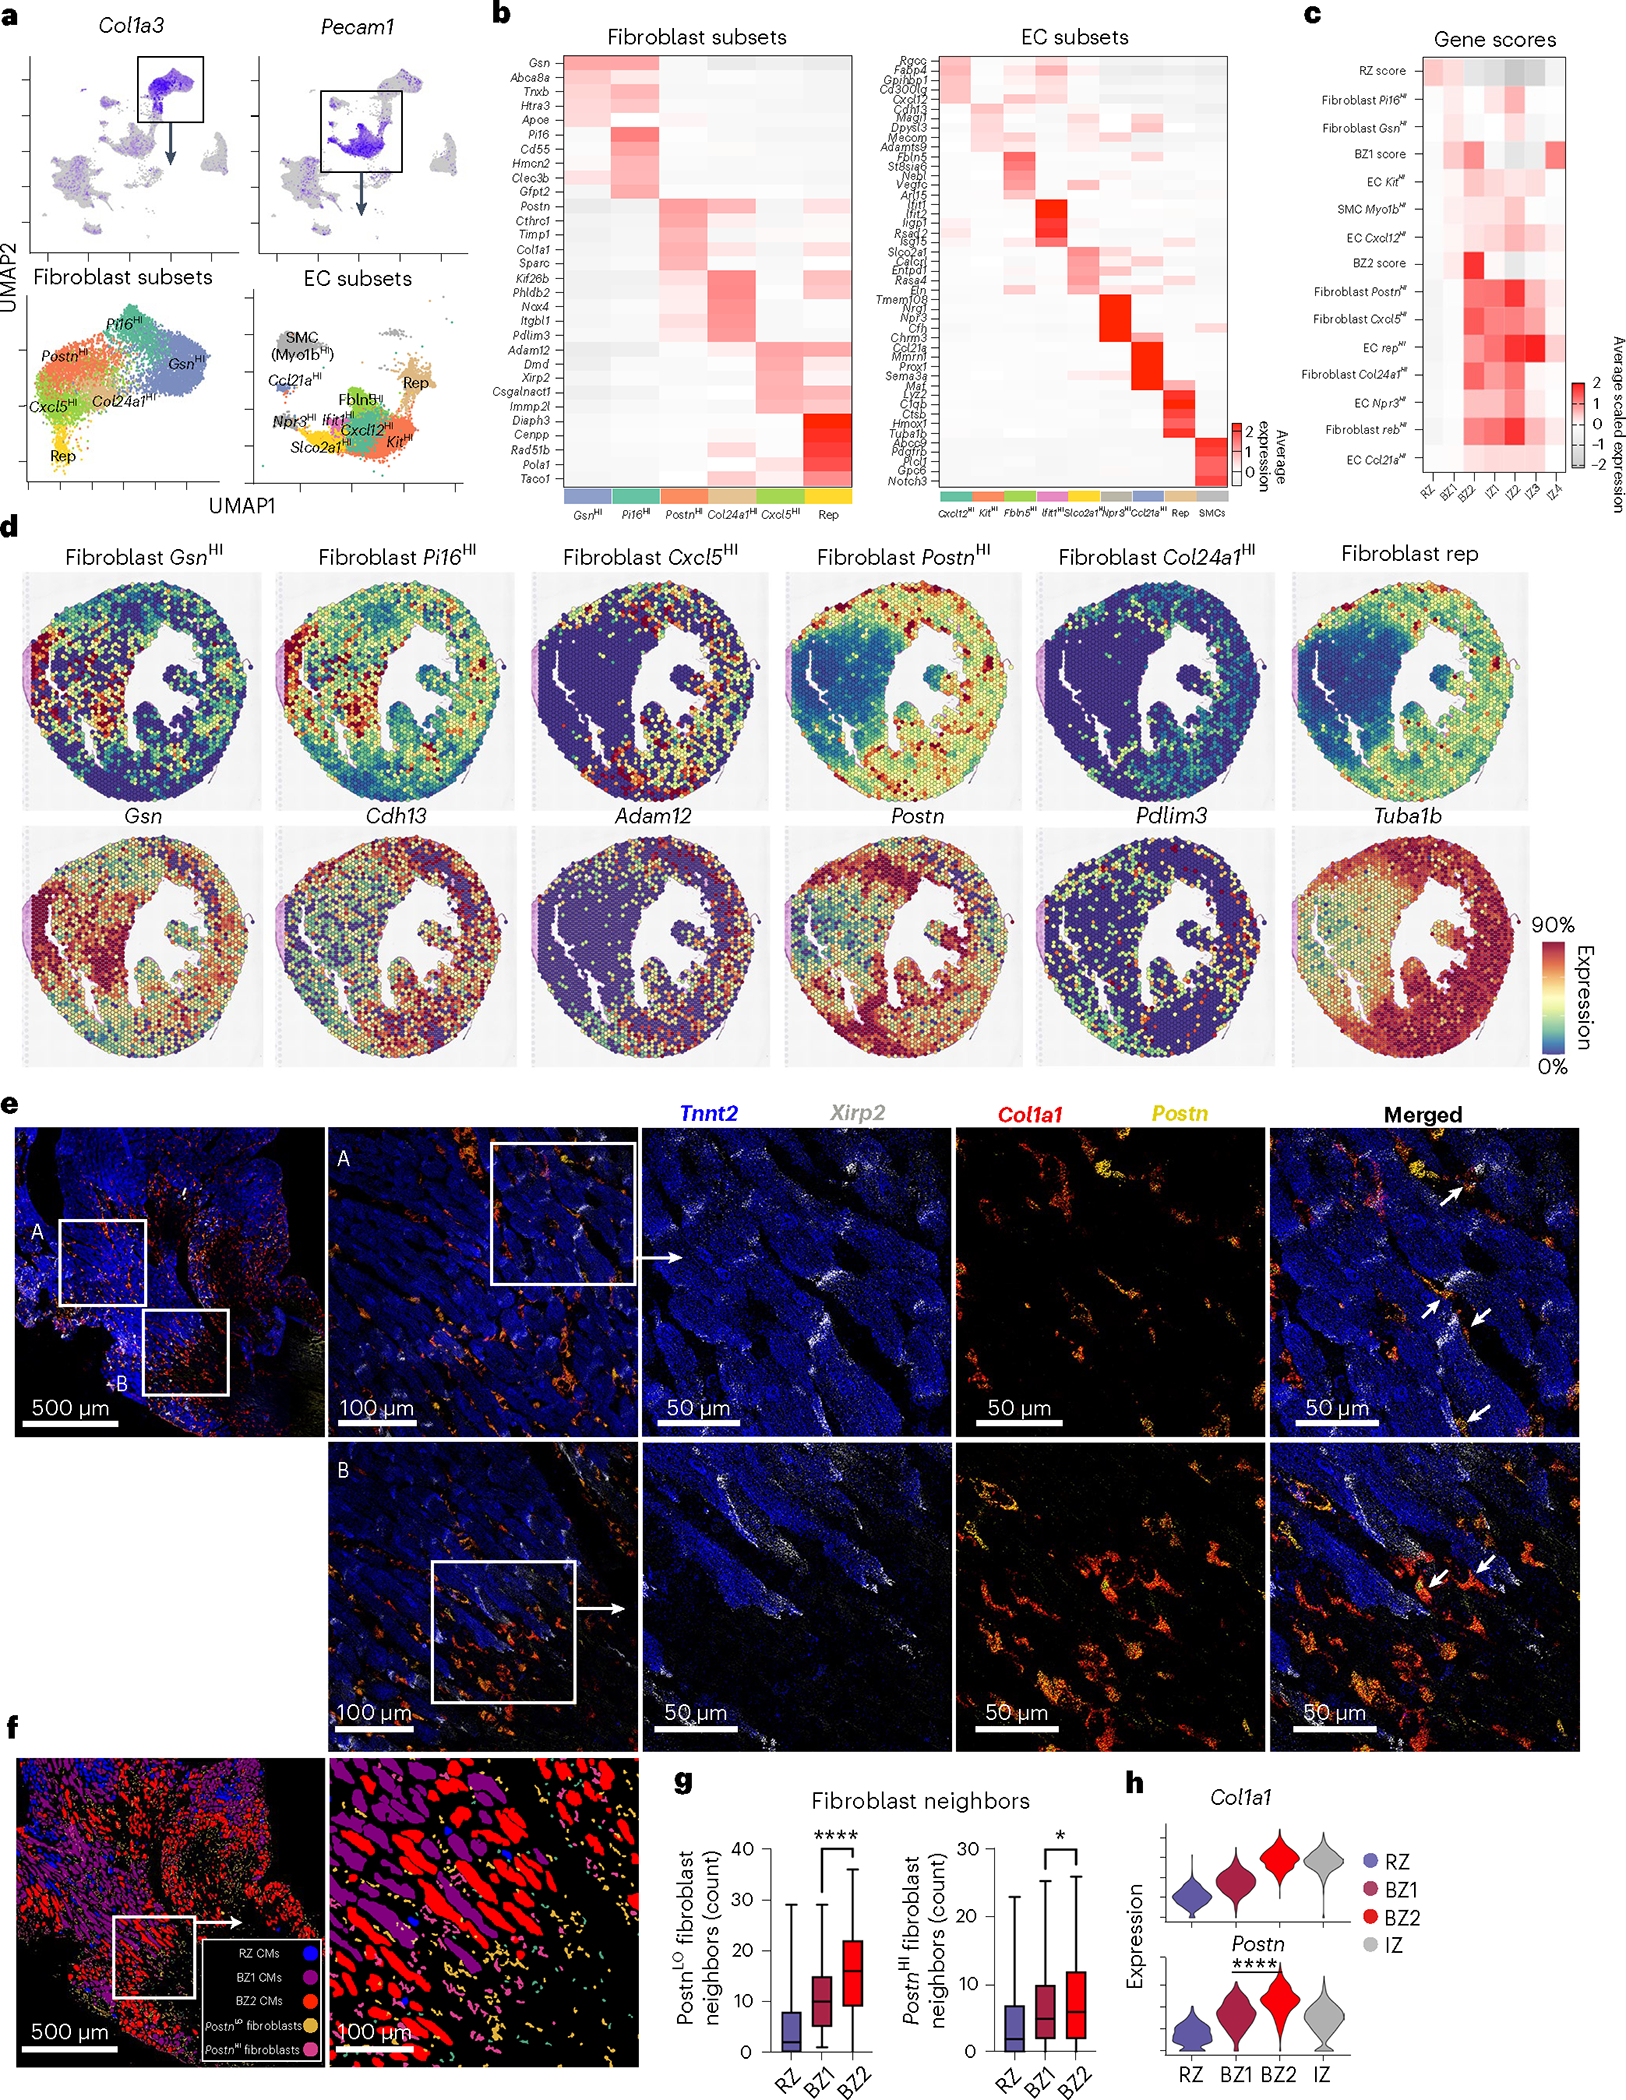
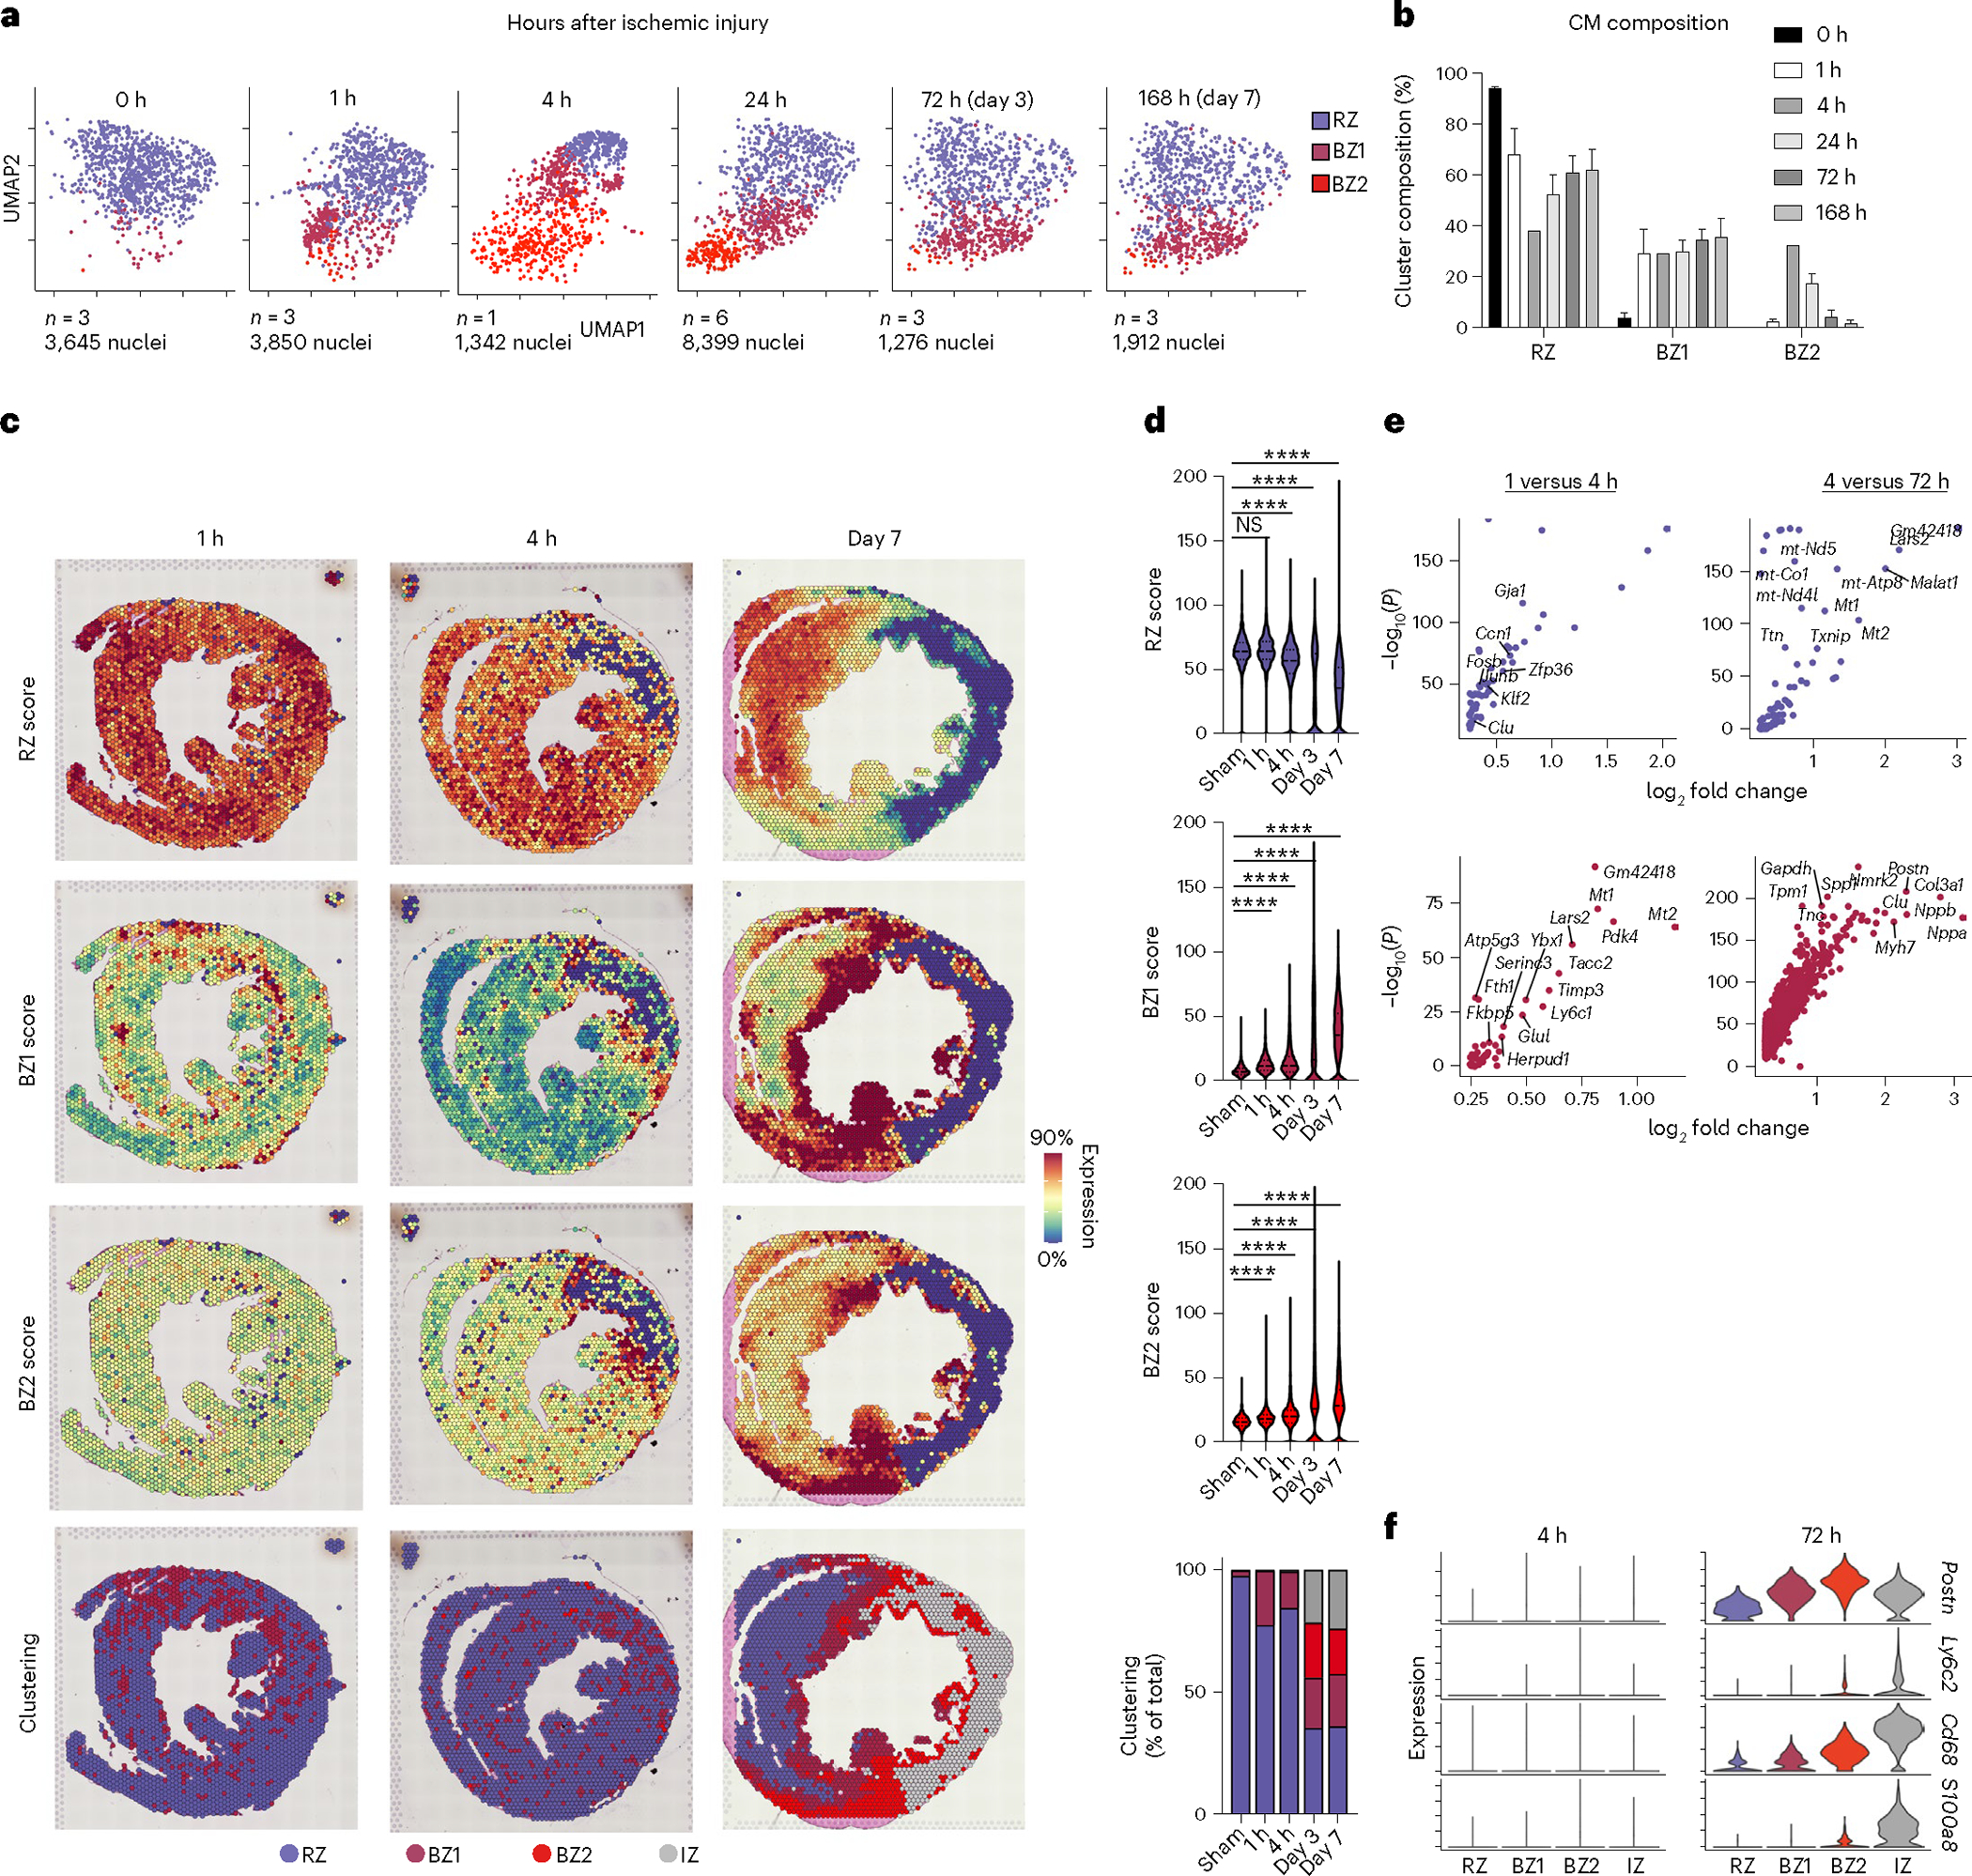
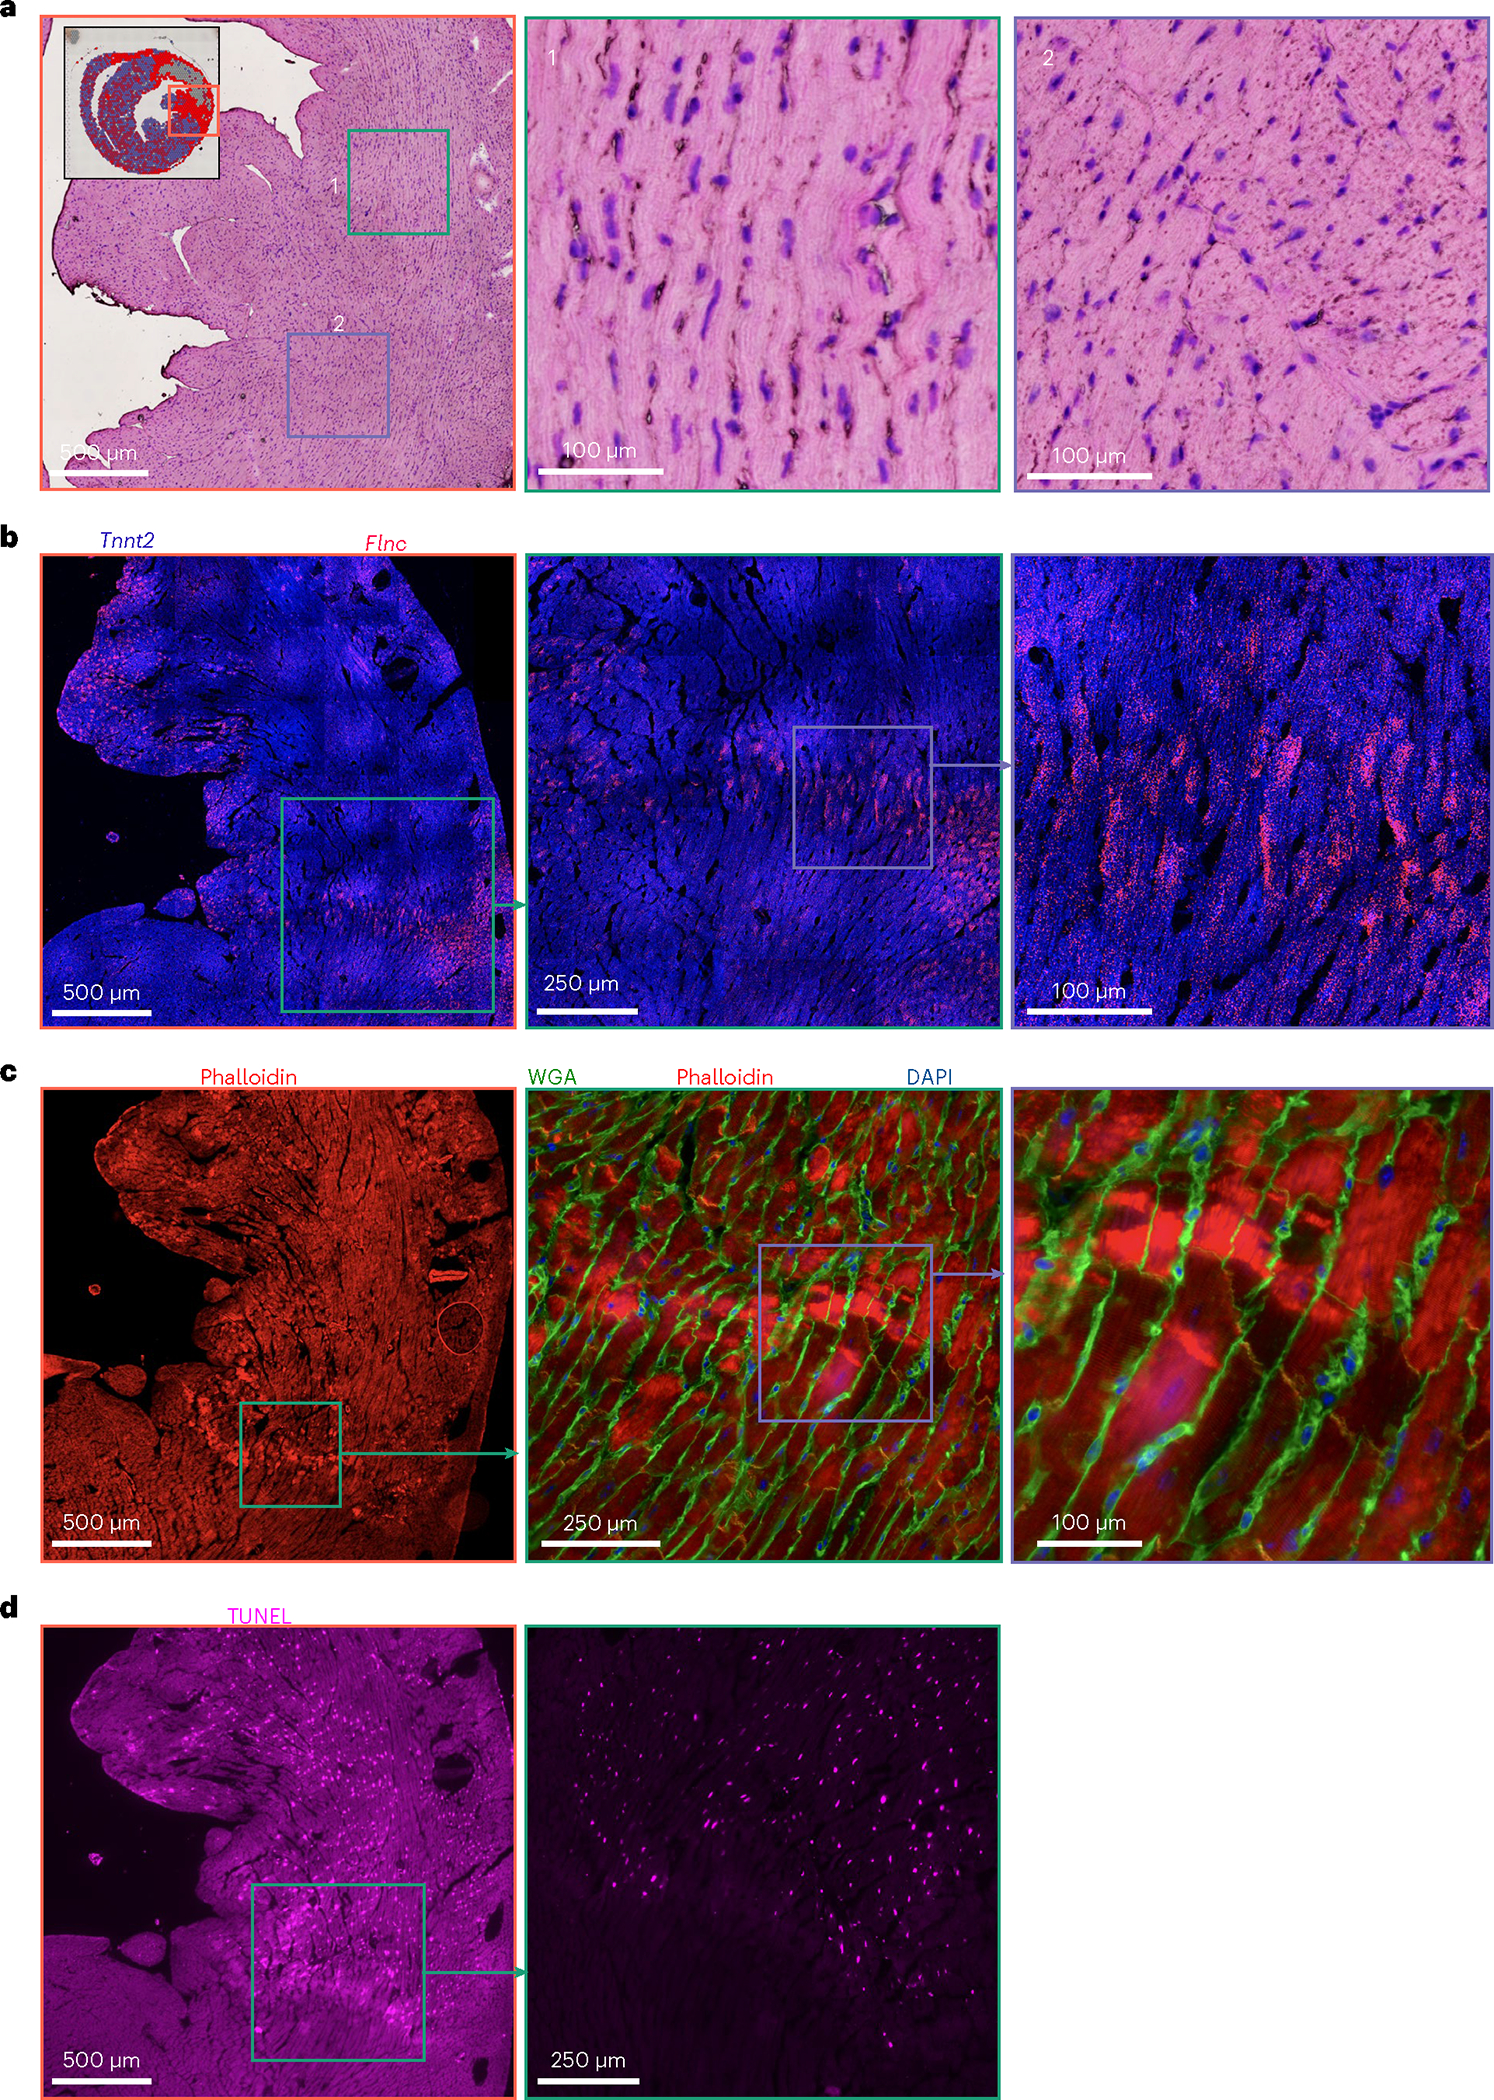
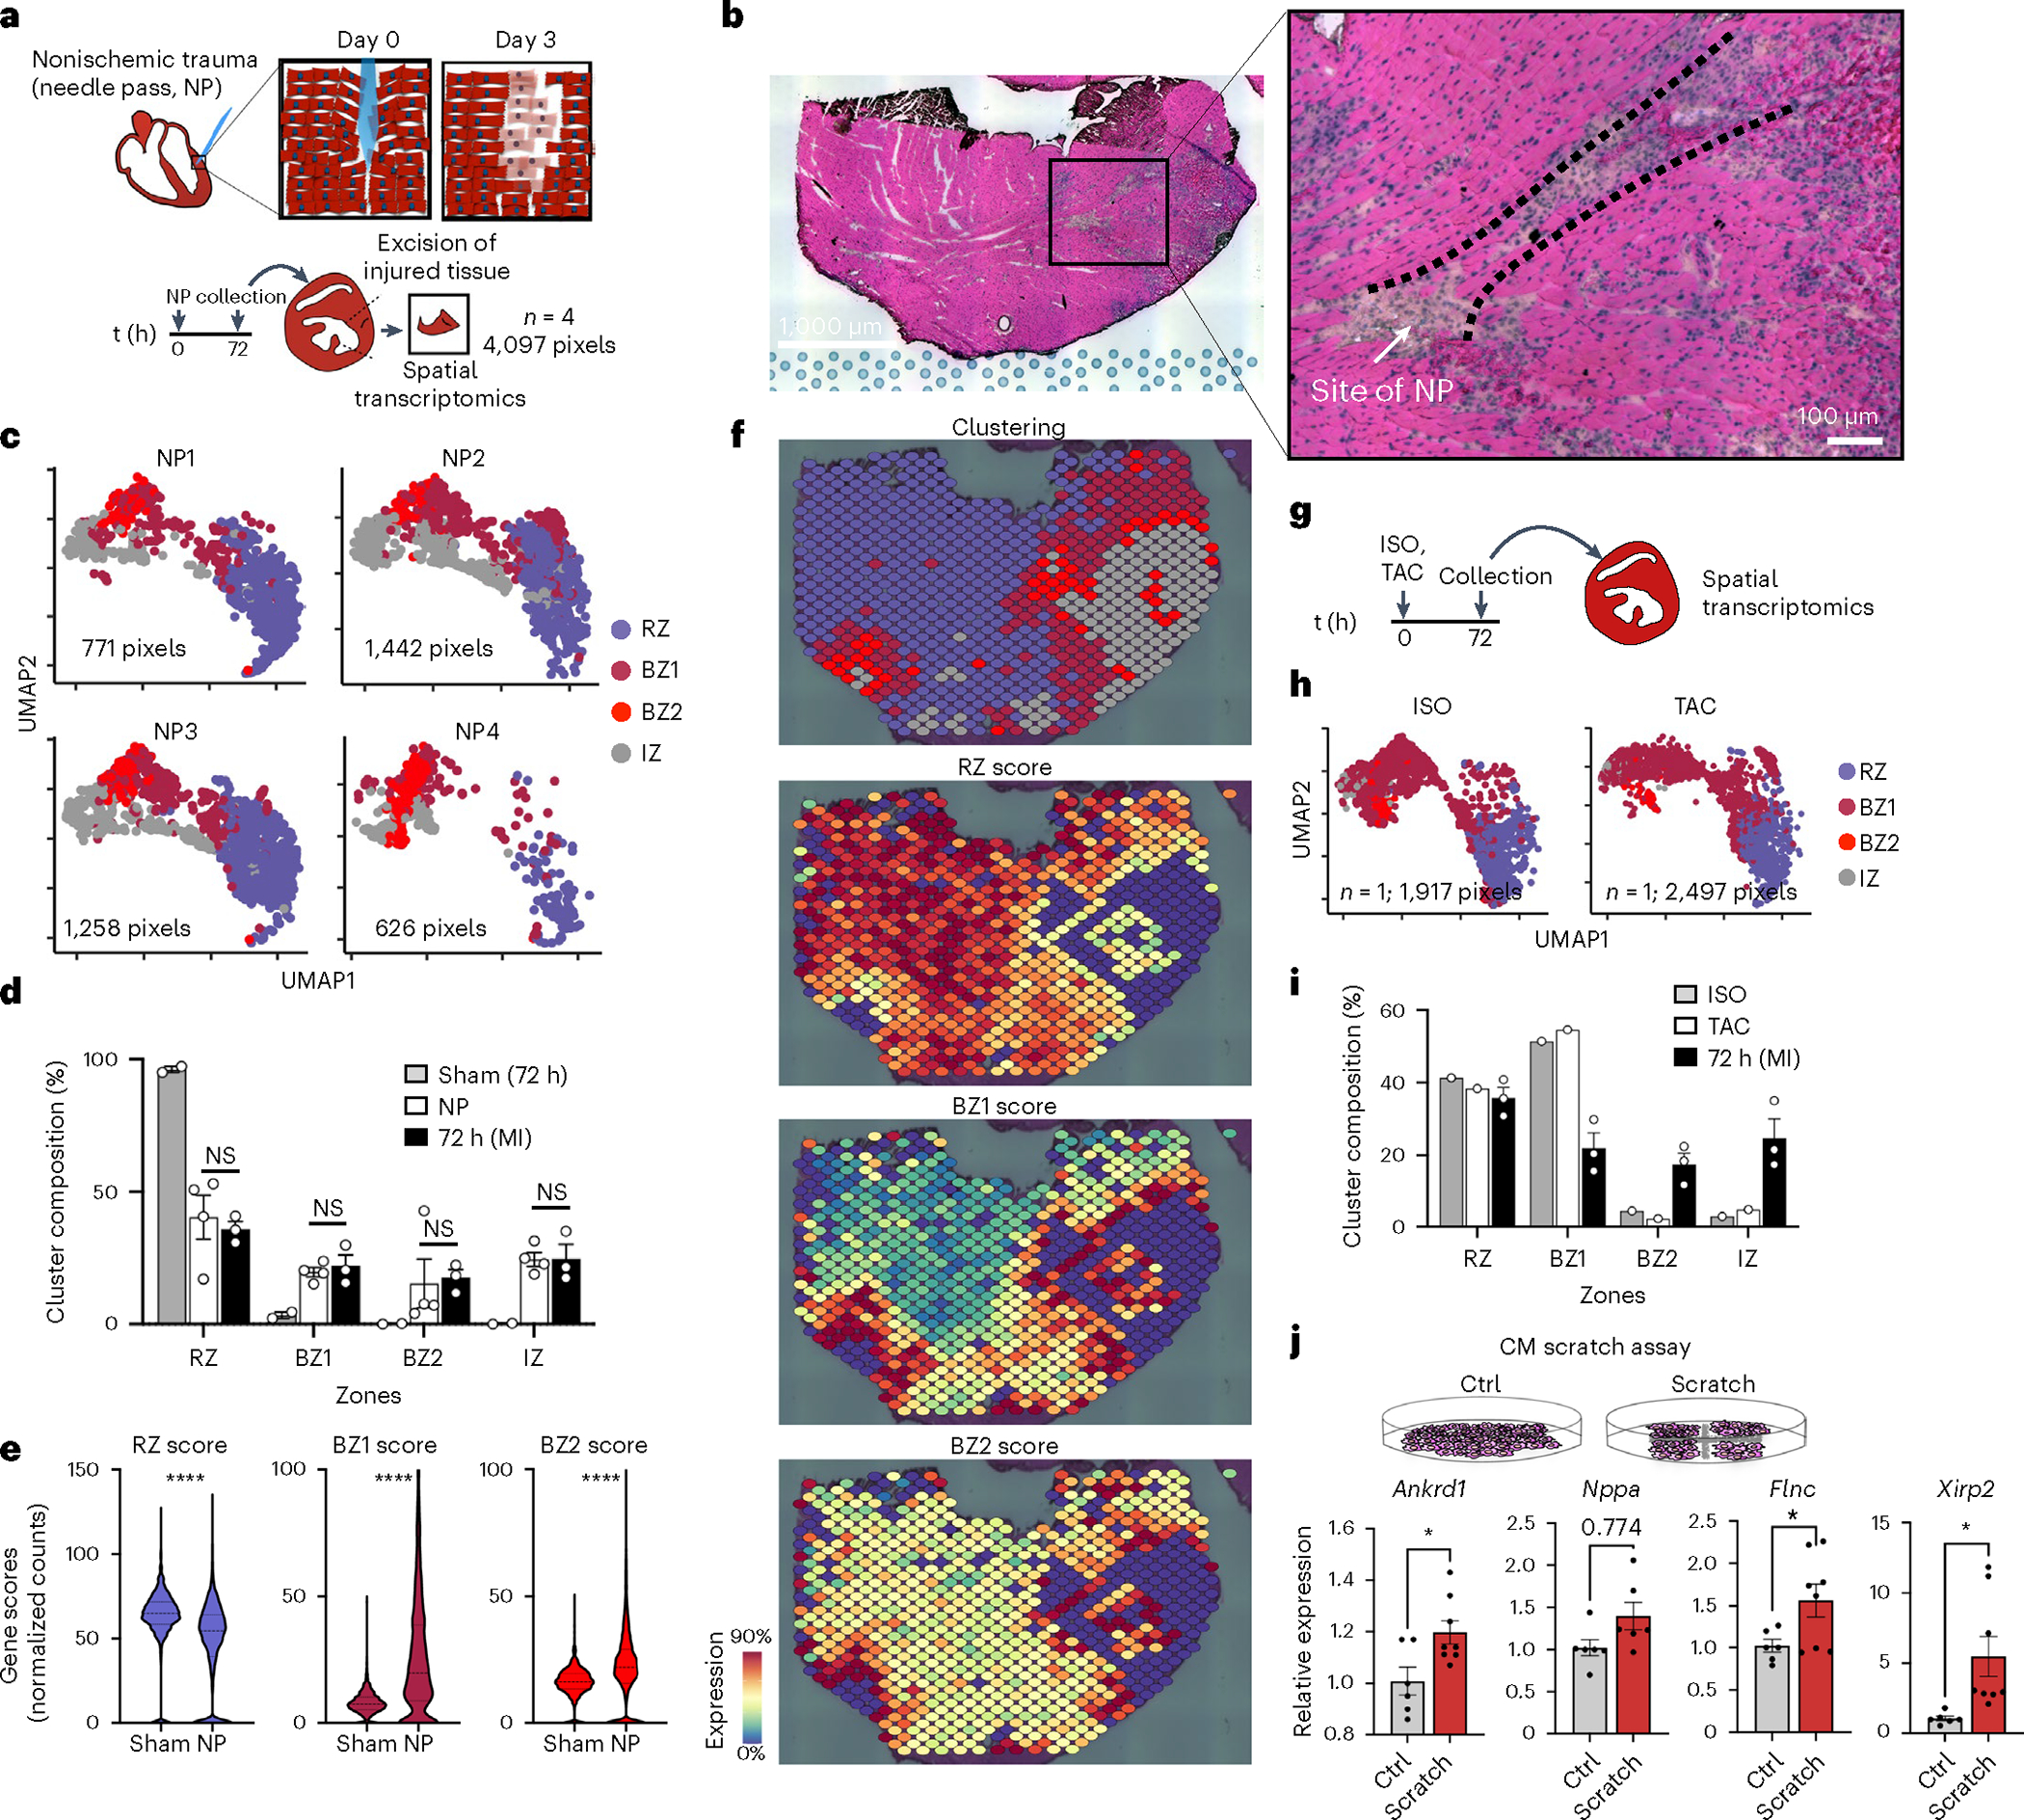
The border zone (BZ) of the infarcted heart is a geographically complex and biologically enigmatic interface separating poorly perfused infarct zones (IZs) from remote zones (RZs). The cellular and molecular mechanisms of myocardial BZs are not well understood because microdissection inevitably combines them with uncontrolled amounts of RZs and IZs. Here, we use single-cell/nucleus RNA sequencing, spatial transcriptomics and multiplexed RNA fluorescence in situ hybridization to redefine the BZ based on cardiomyocyte transcriptomes. BZ1 (Nppa + Xirp2 -) forms a hundreds-of-micrometer-thick layer of morphologically intact cells adjacent to RZs that are detectable within an hour of injury. Meanwhile, BZ2 (Nppa + Xirp2 +) forms a near-single-cell-thick layer of morphologically distorted cardiomyocytes at the IZ edge that colocalize with matricellular protein-expressing myofibroblasts and express predominantly mechanotransduction genes. Surprisingly, mechanical injury alone is sufficient to induce BZ genes. We propose a 'loss of neighbor' hypothesis to explain how ischemic cell death mechanically destabilizes the BZ to induce its transcriptional response.


Conflict of interest statement

Competing interests F.S. is a cofounder and has an equity interest in Papillon Therapeutics; he is a consultant and has equity interest and a research grant from LEXEO Therapeutics. The other authors declare no competing interests.

Figures

Extended Data Fig. 1 |
Extended Data Fig. 1 |. Integration of single cell and nuclei RNA-seq heart datasets during acute responses to MI.
(a) Overall experimental design and integration of sc/snRNA-seq data with whole transcriptome spatial data. Hearts were harvested at several time points following experimental MI and collected for snRNA-seq. The resulting data matrices were integrated with available scRNA-seq data. (b) Experimental timepoints post-MI that were examined in our study with a summary table of total numbers of cells, nuclei and spatial pixels analyzed to support the robustness of our claims across biological replicates. (c) Gating strategy to isolate nuclei using DAPI and FACS. (d) Mitochondrial QC metrics of samples and replicates for both single nuclei, single cell and integrated sn/sc data. (e) UMAP plots annotated by major cell types (left) and subsets (right) after removing nuclei and cells that have more than 5% mitochondrial counts. (f) UMAP plots displaying composition of single nuclei (left) and single cell (right) derived samples. (g) Subcluster composition as derived from UMAPs shown in (f). (h) UMAP plots split by timepoint and across biological replicates. (i) Average subcluster composition displayed in (h). (l) QC metric of samples and replicates for both single nuclei and single cell represented in counts per sample (nCounts) and features per sample (nGenes).
Extended Data Fig. 2 |
Extended Data Fig. 2 |. Integration and quantification of spatial transcriptomic datasets.
(a) UMAP plots split by sample. (b) Quantification of cluster classification as a percentage of total pixels captured by sample (data presented as mean values ± SEM; n = 2, sham; n = 1, 1 hr and 4hrs; n = 3, 72 hrs and 168hrs post-MI). (c) Quality control metrics, split by sample. (d) Spatial plot showing results of clustering across different time points after MI and replicates.
Extended Data Fig. 3 |
Extended Data Fig. 3 |. High resolution clustering of CMs at 24 hrs and 72 hrs post-MI.
(a) UMAP plots of subset and reclustered CMs as shown in Fig. 1b with higher resolution (top) and annotated based on spatial mapping (bottom). (b) Heatmap of resulting DEGs based on resolution. (f) Heatmap of DEGs based on spatial mapping. (c) Select gene ontology terms enriched in BZ2 CMs related to Ras/Rho signaling. (d) Average scaled expression of guanine nucleotide exchange factors (GEFs) and GTPase activating proteins (GAPs) in CM subsets. (e) Spatial feature plots of representative Ras/Rho related genes showing distribution in BZ.
Extended Data Fig. 4 |
Extended Data Fig. 4 |. Mapping of snRNA-seq derived CM subsets to space.
(a) Strategy for mapping labels (IZ, RZ, BZ1 and BZ2) from CM nuclei to spatial clusters (see methods). (b) UMAP plot of integrated dataset composed of 34,116 pixels in 16 samples (summarized in Extended Data Fig. 1b, see Extended Data fig. 8). (c) DEGs based on high-resolution clustering (top) and post-classification regions (bottom). (d) Histogram of counts from representative samples (green, sham; red, 72 hrs post-MI). (e) Histogram of BZ1 scores. (f) Dot plot of BZ1 and BZ2 scores. (g,h) Feature plots (g) and violin plots (h) of CM, BZ1 and BZ2 scores. (i) Results of ROC analysis (AUC, area under the curve) and stepwise label-mapping (reference cluster indicated above). (j) Classification results shown in UMAP space. (k) AUC as a function of gene-set length.
Extended Data Fig. 5 |
Extended Data Fig. 5 |. Spatial transcriptomics of human STEMI tissue.
(a) H&E of cross section of a single human heart sample from a patient presenting with anterior wall STEMI. (b) Spatial transcriptomic clustering results based on DEG analysis and assessment of BZ marker genes shown in space in (c) and by violin plots in (d). (e) Heatmap of cluster defining DEGs. LQ, low quality.
Extended Data Fig. 6 |
Extended Data Fig. 6 |. Segmentation, classification and quantification of mFISH data.
(a) After mFISH imaging, slides were stained for WGA to label the CM membrane. (b) Areas with well-defined perimeters were converted to regions-of-interest (shown in white). (c) Expression of BZ1 markers (Nppa, Clu) and BZ2 markers (Xirp2, Flnc) across ROIs. Scatter plot was visually inspected to establish thresholds and classify ROIs as RZ, BZ1, or BZ2 (blue, purple, red). (d) Quantification of neighbor composition in 25-pixel radius (n = 625 cells, and 1008 cells examined over 1 sample for BZ1 and BZ2, respectively). (e) Quantification of minimum distance to the IZ border defined by Tnnt2 staining. (f) To quantify direct contact of CMs, the percentage of Tnnt2 + pixels were calculated in ROI perimeters with various degrees of thickness (n = 625 cells, and 1008 cells examined over 1 sample for BZ1 and BZ2, respectively). (g) Contiguous regions of respective CM subsets were measured. Images shown are representative of 2 separate experiments. Scale bars indicate 500 μm. Boxplots presented with mean; box: 25th-75th%; whiskers: 2.5th-97.5th %. **** P-value < .0001; Mann-Whitney Test, two-sided.
Extended Data Fig. 7 |
Extended Data Fig. 7 |. Colocalization of immune and fibroblast subsets across time.
(a) Spatial plots showing subclustering results (shown in 3c) across 72 hrs post-MI and 168 hrs post-MI replicates. (b) Colocalized immune subsets in 72 hrs post-MI replicate. (c) Spatially correlated and clustered gene-set scores. (d) Spatially correlated and clustered genes based on spearman rank correlation analysis for all regions (left) and infarct zone (right) of 72 hrs post-MI sample. (e) All gene-set scores projected to clusters. (f) Volcano plot comparing gene-set scores in BZ1 and BZ2 (Wilcoxon Ranked Sum Test, two-sided).
Extended Data Fig. 8 |
Extended Data Fig. 8 |. Spatial transcriptomics on mechanical injury models.
(a) H&E sections at low magnification (lower panel) and high magnification (top panel). Representative of at least 2 separate experiments. (b) Clustering results of spatial transcriptomic data based on integrated dataset as shown in Extended Data Fig. 3. (c) Hif1 scores applied to representative 72 hrs post-MI sample (left) and NP (right) with quantifications plotted per pixel in (d). In comparison to post-MI hearts, needle pass injuries have a significantly lower Hif1 score compared to the positive control (72 hr MI) samples and is unchanged from negative controls in sham samples. (e) Experimental design of fluorescent dye assay to assess regional perfusion. Wheat germ agglutinin (WGA) conjugated to AlexaFluor 488 was injected directly into LV 10 min or 72 hrs post NP injury and hearts were harvested 20 minutes after injection for imaging and quantification (data presented as mean values ± SEM n = 3 biologically independent samples). The representative image in the left panel designates the visualization of the needle pass area designated as the negative control and the reference site designated as neighbors, and the right panel represents a positive control area remote from the site of injury. Quantification of samples harvested 30 minutes and 72 hrs post-NP injury reveal that in both time courses, Neighbors and Positive controls are significantly increased as compared to the Negative Control (Needle pass) sites and are not different from each other (f) Representative H&E-stained sections of NP injuries highlighting area of injury in dash lines and directions of adjacent myocyte bundles in arrows used to quantify gene expression. Representative of 2 separate experiments, each of which had tissue sections aligned with the long axis of the needle insertion. (g) Anisotropy ratios in each sample with non-injured area (right) showing no significant anisotropy in the borderzones of needle pass injuries (n = 2 biologically independent samples). Data presented as mean values ± SEM. *P-value < 0.05, **P-value < 0.01, ***P-value < 0.001, ****P-value < 0.0001; One-way ANOVA with Tukey’s post-hoc analysis.
Fig. 1 |
Fig. 1 |. CM transcripts redefine the ischemic BZ.
a, Scientific question and experimental design. To define the ischemic BZ transcriptionally, we performed snRNA-seq of mouse hearts without injury and with ischemic injury, mapped the resulting transcriptomes to space using spatial transcriptomics and validated our findings using multiplex RNA FISH (Rebus Biosystems). b, Uniform manifold approximation and projection (UMAP) plots of clustered CMs (snRNA-seq) with high-resolution (left) and annotated clustering (right) based on spatial mapping and gene patterns. Representative data shown from Ctrl, 24 h post-MI and 72 h post-MI samples (n = 3 mice). c, UMAP plots of CMs split by condition. d, Quantification of CM composition by time after injury. e, Heatmap displaying DEGs as determined by clustering with the color bars above indicating cell cluster based on the annotation method (Wilcoxon signed-rank test, Bonferroni-adjusted P < 0.01). GO and motif enrichment terms are displayed to the right of each respective group. f, Representative spatial transcriptomic data of mouse heart cross-section after ischemic injury (Visium; 10X Genomics). g, Gene-set scores in space derived from snRNA-seq data with examples of expressed genes shown below. h, Trajectory analysis of representative genes from snRNA-seq data with direction of pseudotime indicated in b. i, Gene-set scores in space at the BZ from the box indicated in g. j, Gene-set scores as a function of space from the RZ toward the IZ as indicated by the arrow in i (data presented as mean values ± s.e.m.; n = 966 cells examined over one sample). k, Quantification of neighboring pixels, split by mapping classification (mean; box: 25th–75th percentile; whiskers: 2.5th–97.5th percentile; n = 966 cells examined over 1 sample). **P < 0.01, ****P < 0.0001; two-sided Mann–Whitney U-test. NS, not significant; min., minimum; max., maximum.
Fig. 2 |
Fig. 2 |. BZ2 CMs form a thin boundary between surviving and ischemic myocardium.
a,b, Multiplex FISH images of serial section from Fig. 1f (inset shown). a, Green, RZ marker, Tnnt2; blue, BZ1 markers, Nppa and Ankrd1. b, Green, RZ marker, Tnnt2; magenta, BZ2 markers, Xirp2 and Flnc. c, Phalloidin-stained serial section. d, H&E images of serial section. e, CM classification based on WGA staining and multiplex FISH data for quantification in f,g (see Extended Data Fig. 4 for more details). f, Quantification of nearest distance to the IZ based on phalloidin-stained serial section. g, Quantification of contacting CM neighbors. f,g, Mean; box: 25th–75th percentile; whiskers: 2.5th–97.5th percentile; n = 438,625 and 1,008 cells examined over one sample for RZ, BZ1 and BZ2, respectively. h, Quantification of contiguous thickness. Multiplex FISH data are representative of two separate experiments. ****P < .0001, two-sided Mann–Whitney U-test.
Fig. 3 |
Fig. 3 |. Cardiac immune niches after ischemic injury.
a, Top, feature plot of Ptprc (Cd45) of integrated sc/snRNA-seq data (see Extended Data Fig. 1 for more detail). Bottom, subset and reclustered monocytes, macrophages and neutrophils. b, Heatmap of average, scaled expression of the cluster-defining DEGs in a. c, Clustering results of IZ spatial transcripts derived from integrated spatial dataset including sham (n = 2), 72 h (day 3) post-MI (n = 3) and 168 h (day 7) post-MI (n = 3) samples. Clusters are color-coded in space (left) and in UMAP plots (right) as part of the full dataset (top) and subset (bottom). d, Heatmap of cluster-defining DEGs (left) and gene-set scores (right). e,f, Spatial plots of cluster (e) with contributing genes scores (f) demonstrating colocalization of immune subpopulations. g, BZ1 and BZ2 scores applied to IZs (left) and select IFN-stimulated genes in CMs (right). h, Representative spatial plots (top) of clusters in 72 and 168 h post-MI samples with bar plots (bottom) quantifying the representation of each IZ across time/sample as the percentage of total IZ pixels (IZ2, P = 002578; IZ3, P = 035219; data presented as mean values ± s.d.; n = 3 biologically independent samples). Rep, replicating. g, *P < 0.05, **P < 0.01, ****P < 0.0001; two-sided Mann–Whitney U-test. h, Unpaired Student’s t-test.
Fig. 4 |
Fig. 4 |. Activated fibroblasts localize with BZ2 CMs.
a, Top, feature plots of fibroblast (Col1a3) and EC (Pecam1) markers. Bottom, UMAP plots of fibroblast and EC subsets with marker genes overlayed. b, Heatmaps of cluster-defining DEGs from a. c, Heatmap of sn/scRNA-seq-derived gene-set scores (scaled for visualization) applied to previously defined BZs and IZs. d, Spatial feature plots with genes scores shown above and representative genes shown below. e, Multiplex FISH images of BZ (blue, Tnnt2; gray, Xirp2; red, Col1a1; yellow, Postn). f, Segmented and classified multiplex FISH data displaying CM and fibroblast subsets. g, Quantification of PostnHI/LO fibroblasts surrounding CM subsets (P = 0.0366, PostnHI; mean; box: 25th–75th percentile; whiskers: 2.5th–97.5th percentile; n = 438, 625 and 1,008 cells examined over one sample for RZ, BZ1 and BZ2, respectively). h, Violin plots of activated fibroblast markers applied to barcode-based spatial transcriptomic data. Multiplex FISH data are representative of two separate experiments. *P < 0.05, ****P < 0.0001. g, Unpaired Student’s t-test. h, Two-sided Mann–Whitney U-test.
Fig. 5 |
Fig. 5 |. The transcriptional BZ emerges rapidly after ischemia.
a, UMAP plots of integrated CMs split by time after ischemic injury. b, Cluster composition (percentage of total CMs per sample) as a function of time post-injury (data presented as mean values ± s.e.m.; n = 3 biologically independent samples for 0, 1, 72 and 168 h post-MI; n = 1 and 6 biologically independent samples for 4 and 24 h post-MI, respectively). c, Spatial feature plots of RZ, BZ1 and BZ2 scores and clustering results cross-sections from mouse heart 1 h (left), 4 h (center) and 168 h (right) post-MI. Clustering results are based on an integrated spatial dataset. d, Violin plots of CM subset scores as shown in c (median and 25th–75th percentile demarcated with dashed lines). Bottom, cluster ownership as the percentage of total pixel capture. e, Volcano plots displaying upregulated genes between the indicated times across respective CM subsets (Bonferroni-adjusted P values). f, Fibroblast (Postn), monocyte (Ly6c2), macrophage (Cd68) and neutrophil (S100a8) markers at 4 and 72 h post-MI. d, ****P < 0.0001, two-sided Mann–Whitney U-test.
Fig. 6 |
Fig. 6 |. Morphological features of the emerging BZ.
a, H&E-stained serial section of the 4 h post-MI sample shown in Fig. 5c (inset). b, FISH image showing Tnnt2 (blue) and the BZ2 marker gene, Flnc (red). c, Phalloidin (red), WGA (green) and DAPI (blue) staining of the consecutive serial section shown in b. d, TUNEL staining of consecutive serial section shown in c. Multiplex FISH data and images are representative of two separate experiments.
Fig. 7 |
Fig. 7 |. Ischemic injury is not necessary and mechanical trauma is sufficient to elicit BZ biology.
a, To induce nonischemic, mechanical trauma in the heart, we subjected hearts to NP (see Methods for full details), collected tissue 72 h after injury and excised the injured section of the left ventricle for spatial transcriptomics (n = 4; 4,097 pixels). b, The site of NP injury was identified in the H&E-stained sections by immune infiltrate and disrupted myocyte bundles. Representative image of four separate experiments. c, UMAP plots of each NP replicate in the same integrated space as the permanent ligation samples. d, Bar plots comparing the cluster composition of NP (n = 4) to sham (n = 2) and 72 h post-MI (n = 3) samples. e, Violin plots of RZ, BZ1 and BZ2 scores comparing sham to NP injury (all samples combined; median and 25th–75th percentile demarcated with dashed lines). f, Spatial plots showing BZ1 and BZ2 signatures (top, clustering; bottom, gene-set scores) surrounding the site of injury. g, Mice were subjected to either ISO treatment (n = 1) or TAC (n = 1) and collected for spatial transcriptomics after 72 h. h, UMAP plots of ISO and TAC samples in integrated space with i cluster composition quantified below (percentage of total pixels per sample, n = 1). j, Scratch assay was performed on confluent cultures of NRVMs seeded on 6-well plates; RNA was isolated from cultured cells 24 h after the scratch assay was performed. The BZ genes Ankrd1 (P = 0.0196), Flnc (P = 0.0394) and Xirp2 (P = 0.0212) were significantly increased in scratched NRVMs compared to unscratched Ctrl plates (n = 6, Ctrl; n = 8, scratch); Nppa did not reach statistical significance (P = 0.0774). d,i,j, Data are presented as mean values ± s.e.m. *P < 0.05, ****P < 0.0001. d,j, Unpaired Student’s t-test. e, Mann–Whitney U-test.

References

    1. Factor SM, Sonnenblick EH & Kirk ES The histologic border zone of acute myocardial infarction—islands or peninsulas? Am. J. Pathol. 92, 111–124 (1978). - PMC - PubMed
    1. Janse MJ et al. The “border zone” in myocardial ischemia. An electrophysiological, metabolic, and histochemical correlation in the pig heart. Circ. Res. 44, 576–588 (1979). - PubMed
    1. van Duijvenboden K et al. Conserved NPPB+ border zone switches from MEF2- to AP-1-driven gene program. Circulation 140, 864–879 (2019). - PubMed
    1. Vivien CJ, Hudson JE & Porrello ER Evolution, comparative biology and ontogeny of vertebrate heart regeneration. NPJ Regen. Med. 1, 16012 (2016). - PMC - PubMed
    1. Smith RM, Black AJ, Velamakanni SS, Akkin T & Tolkacheva EG Visualizing the complex 3D geometry of the perfusion border zone in isolated rabbit heart. Appl. Opt. 51, 2713–2721 (2012). - PubMed