. 2024 Jul 31;11(7):231555.
doi: 10.1098/rsos.231555. eCollection 2024 Jul.

Bubble ascent and rupture in mud volcanoes

Affiliations

Bubble ascent and rupture in mud volcanoes

Maxwell L Rudolph et al. R Soc Open Sci. .

Abstract

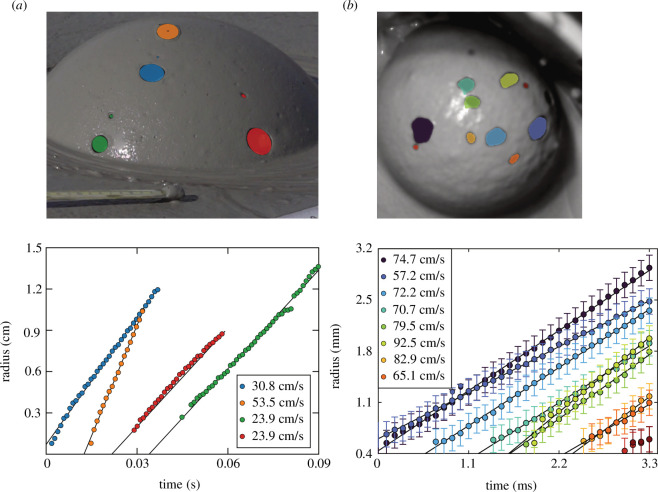
Large gas bubbles can reach the surface of pools of mud and lava where they burst, often through the formation and expansion of circular holes. Bursting bubbles release volatiles and generate spatter, and hence play a key role in volcanic degassing and volcanic edifice construction. Here, we study the ascent and rupture of bubbles using a combination of field observations at Pâclele Mici (Romania), laboratory experiments with mud from the Imperial Valley (California, USA), numerical simulations and theoretical models. Numerical simulations predict that bubbles ascend through the mud as elliptical caps that develop a dimple at the apex as they impinge on the free surface. We documented the rupture of bubbles in nature and under laboratory conditions using high-speed video. The bursting of mud bubbles starts with the nucleation of multiple holes, which form at a near-constant rate and in quick succession. The quasi-circular holes rapidly grow and coalesce, and the sheet evolves towards a filamentous structure that finally falls back into the mud pool, sometimes breaking up into droplets. The rate of expansion of holes in the sheet can be explained by a generalization of the Taylor-Culick theory, which is shown to hold independent of the fluid rheology.

Keywords: bubble; fragmentation; mud volcano; rheology; rupture.


Conflict of interest statement

We declare we have no competing interests.

Figures

Lava and mud bubbles with holes, in igneous and mud volcanoes, respectively
Figure 1.
Lava and mud bubbles with holes, in igneous and mud volcanoes, respectively. (a) Kīlauea, Hawaii 1988 (United States Geological Survey (USGS), Public Domain Images), (b) Imperial Valley, California (Deb Bergfeld/USGS, Public Domain). (c) Formation and rupture of a mud bubble at Pâclele Mici, Buzău, Romania. (d) The sequence of images shows a bubble bursting in a laboratory experiment (experiment E6) using mud from the Imperial Valley, California, USA.
Geological maps of the studied areas
Figure 2.
Geological maps of the studied areas. (a) Imperial Valley, California, USA, based on USGS [13] data. (b) Berca–Beciu–Arbănași mud volcano area (Romania), using data from Ciocârdel [14]. The mapped deposits' age and lithology are Maeotian (from 8.4 to 6 Ma, marl and sandy marl), Pontian (from 6 to 4.7 Ma, marl and sand), Dacian (from 4.7 to 4 Ma, marl and sand), Romanian (from 4 to 2.58 Ma, mostly sand) and Quaternary (from 2.58 Ma to present, sand and gravel). On both maps, the coordinate system is in geographic latitude/longitude. (c) Geographic location of both sites.
Rheological measurements for Pâclele Mici mud (a) and Salton Sea mud
Figure 3.
Rheological measurements for Pâclele Mici mud (a) and Salton Sea mud (b). The curves show the Carreau–Yasuda rheological model [32], with parameters given in the legends.
Results from the numerical simulations
Figure 4.
Results from the numerical simulations. Temporal evolution of bubble shape as it approaches the free surface, modelled using the Carreau–Yasuda rheological model [32]. The top and bottom rows depict three-dimensional and cross-sectional views, respectively. In the cross-sectional view, the black curve indicates the free surface and the bubble is shown in blue. The number at the top of each panel is the numerical time in seconds with t=0 the instant when the bubble starts to rise with a hemispherical morphology from a location 7R beneath the undisturbed free surface. Here, R denotes the equivalent spherical radius of the bubble (= 20 cm). The rest of the parameters are given in electronic supplementary material, table S6.
Figure 5.
Figure 5.
Number of holes versus time for laboratory experiments. The colours correspond to laboratory experiments carried out with different water contents. Water content increases from E1 (38.5%) to E2 (39.5%) to E6 (39.7%).
Speed of hole expansion extracted from video frames for field videos at Pâclele Mici (a) and laboratory measurements from experiment E1 with Imperial Valley mud
Figure 6.
Speed of hole expansion extracted from video frames for field videos at Pâclele Mici (a) and laboratory measurements from experiment E1 with Imperial Valley mud (b). (a) Top: ellipsoidal fits of approximate starting and final positions of the holes. Bottom: measurements of the maximum radius as a function of time alongside a fit. (b) Top: coloured regions indicate nucleated holes. Bottom: hole radius as a function of time. The legends in both panels indicate the terminal speed extracted from the data; the shaded regions in the images are coloured in accordance with the corresponding colours used for the radii on the bottom part of each panel. In the bottom left panel, the uncertainty in radius (1 pixel) is smaller than the symbols used. The error bars in the lower right panel indicate an uncertainty of 1 pixel. Note that the image in the top panel in (a) is edited digitally to show the holes as they are superimposed on the bubble at t=0 ; in subsequent times, sagging of the bubble structure and multiple additional holes develop. The expansion speed converges to a constant value that differs within the same bubbles and between bubbles.
(a) Rendering of an axisymmetric sheet of thickness retracting with speed, showing its cross-section (blue shaded region), which is described by the profile above the axis of symmetry for ; is the outward unit normal to the free surface of the sheet
Figure 7.
(a) Rendering of an axisymmetric sheet of thickness H retracting with speed uc , showing its cross section (blue shaded region), which is described by the profile z=h(r,t) above the axis of symmetry for r0rR ; n^ is the outward unit normal to the free surface of the sheet. Inset: schematic illustration of the volume over which the integration is carried out. (b) Partition of the cross-section for estimating the length of the profile ABC: AB is a circular arc of approximate length (πdH)/2 ; BC is a straight segment of approximate length Rr0d (c) Within time δt , the tip of the rim moves by a distance δr=ucδt ; the mass of the fluid accumulated in the rim during that time is δm2πr0ρHδr .

References

    1. Debrégeas G, de Gennes PG, Brochard-Wyart F. 1998. “The life and death of viscous "bare" bubbles”. Science 279 , 1704–1707. (10.1126/science.279.5357.1704) - DOI - PubMed
    1. Edwards MJ, Kennedy BM, Jolly AD, Scheu B, Jousset P. 2017. Evolution of a small hydrothermal eruption episode through a mud pool of varying depth and rheology, White Island, NZ. Bull. Volcanol. 79 , 16. (10.1007/s00445-017-1100-5) - DOI
    1. Eggers J, Villermaux E. 2008. Physics of liquid jets. Rep. Prog. Phys. 71 , 036601. (10.1088/0034-4885/71/3/036601) - DOI
    1. Villermaux E. 2020. Fragmentation versus cohesion. J. Fluid Mech. 898 , 1. (10.1017/jfm.2020.366) - DOI
    1. Dombrowski N, Fraser RP. 1954. A photographic investigation into the disintegration of liquid sheets. Phil. Trans. R. Soc. Lond. A. 247 , 101–130. (10.1098/rsta.1954.0014) - DOI