. 2024 Apr:3:474-491.
doi: 10.1038/s44161-024-00445-9. Epub 2024 Mar 15.

Sustained meningeal lymphatic vessel atrophy or expansion does not alter Alzheimer's disease-related amyloid pathology

Affiliations

Sustained meningeal lymphatic vessel atrophy or expansion does not alter Alzheimer's disease-related amyloid pathology

Salli Antila et al. Nat Cardiovasc Res. 2024 Apr.

Abstract

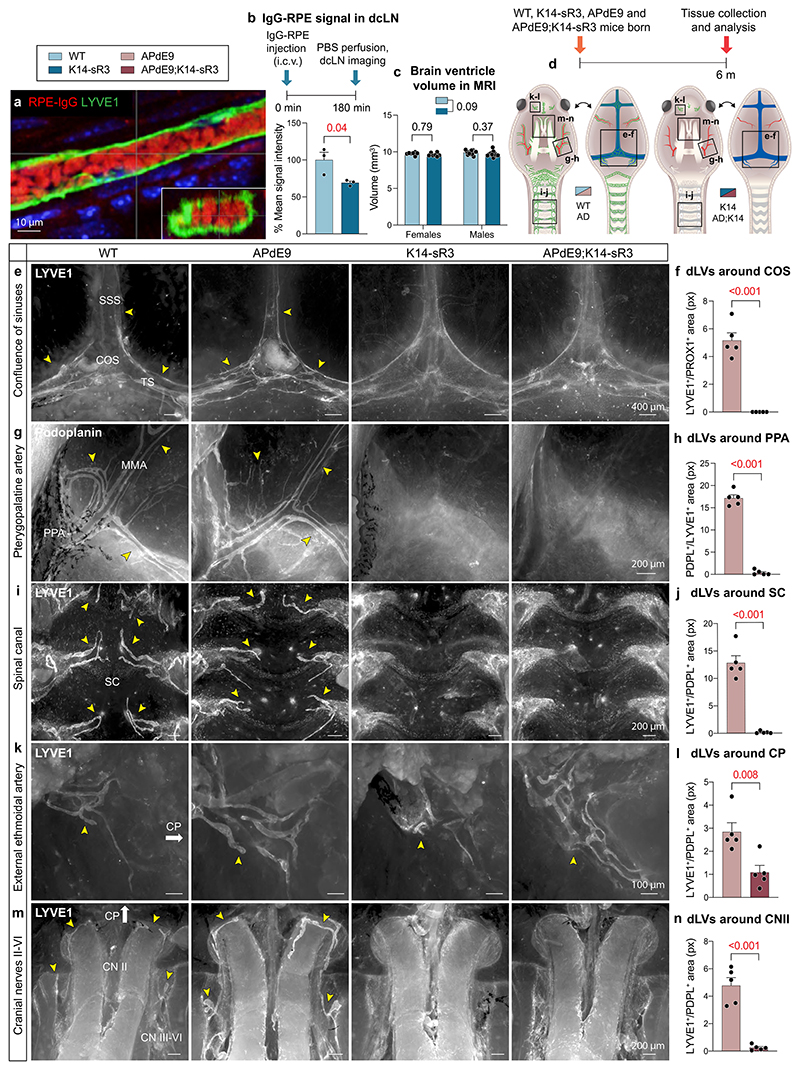
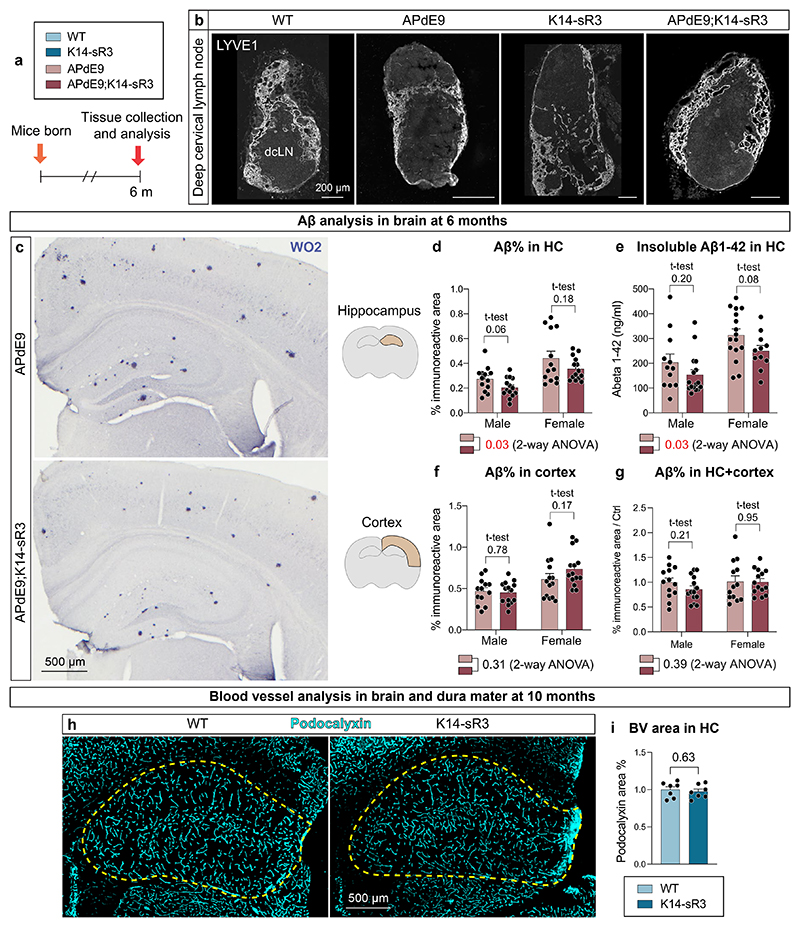
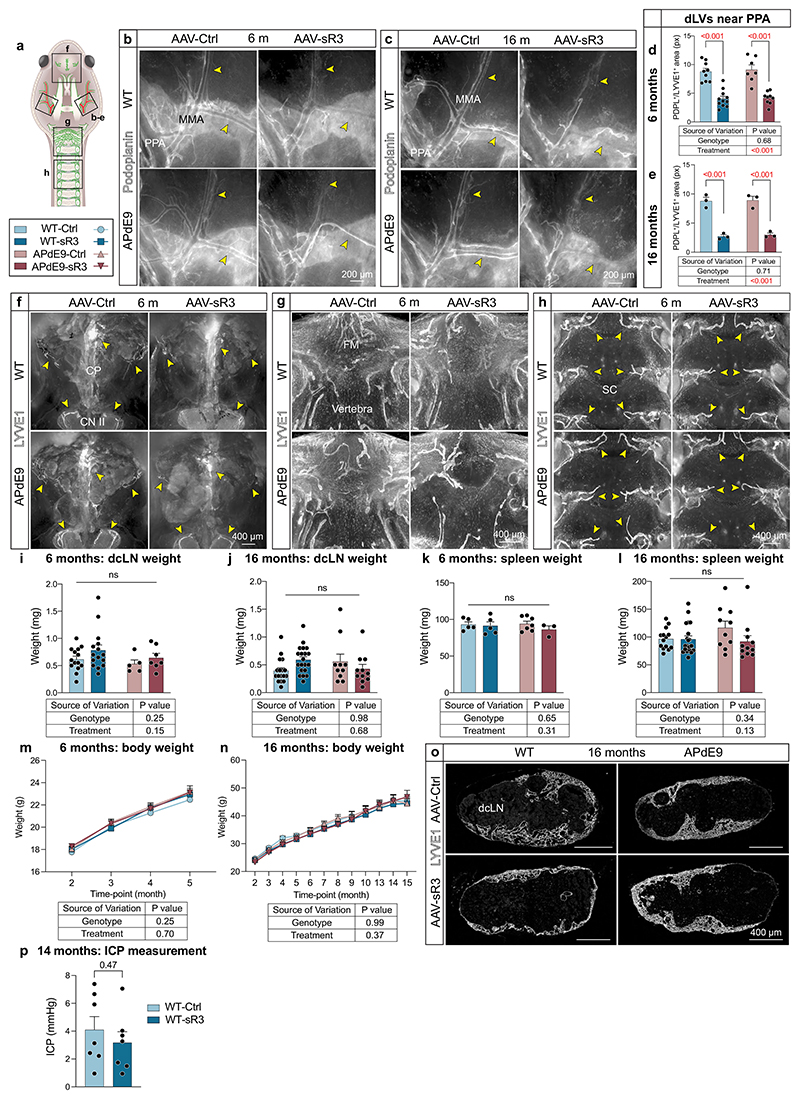
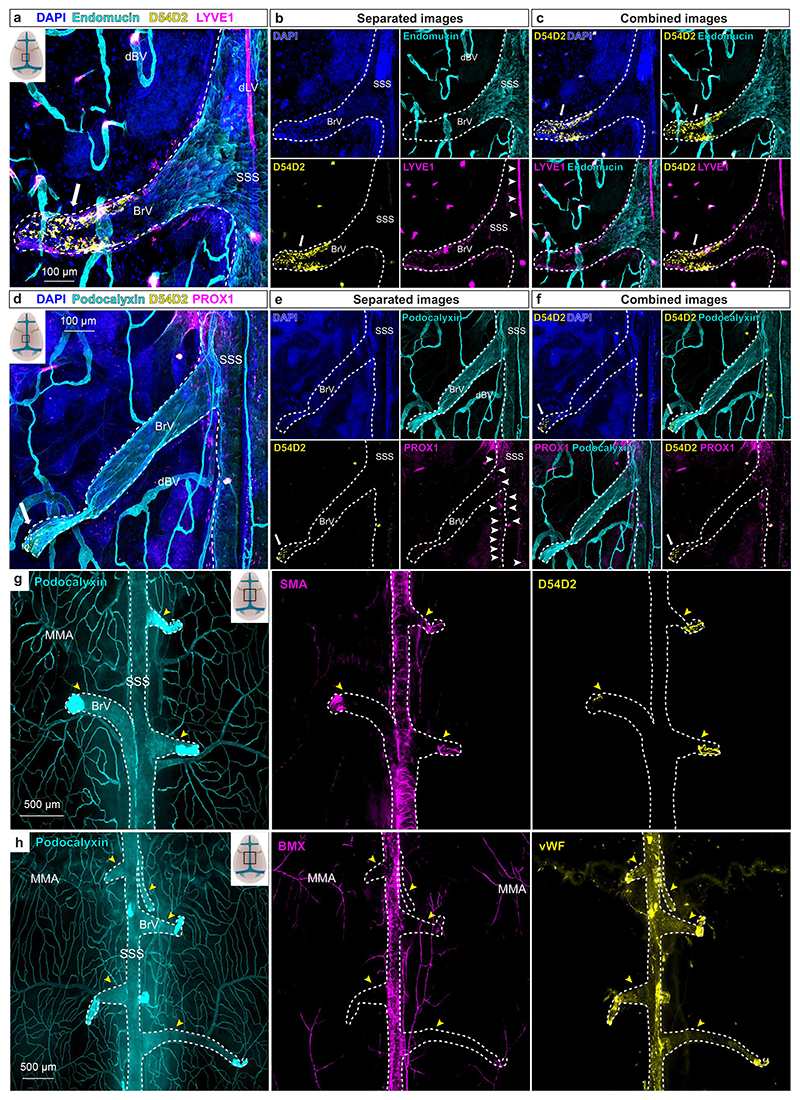
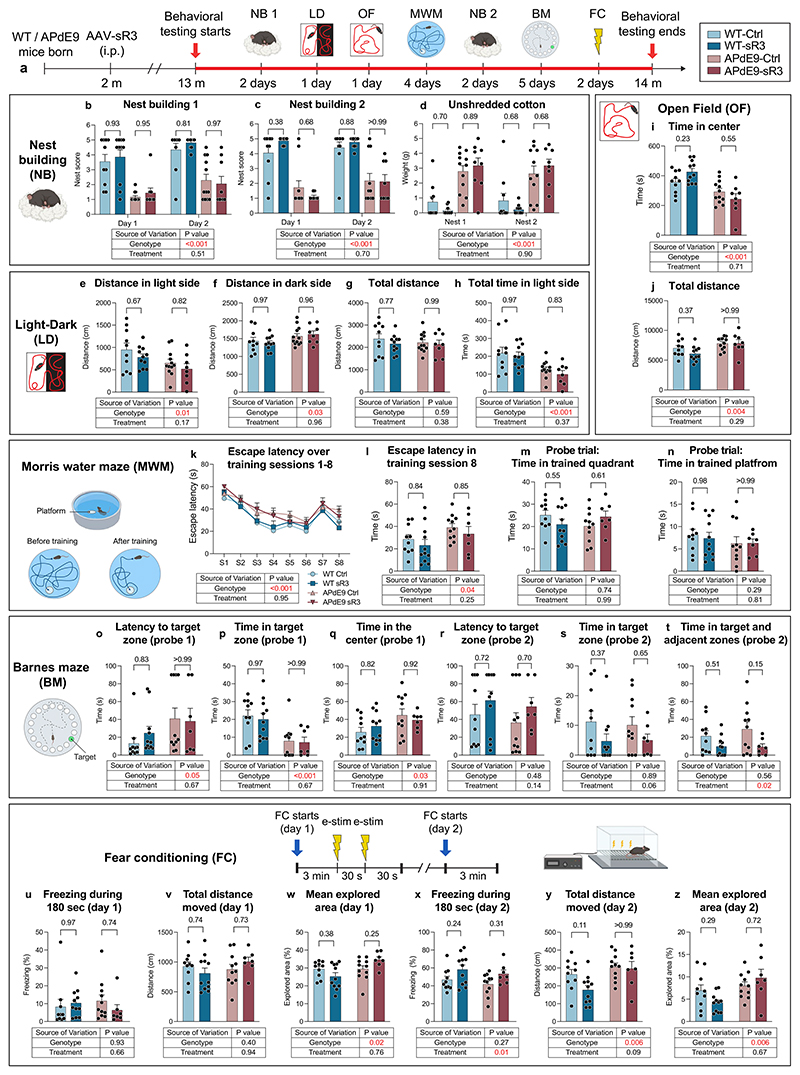
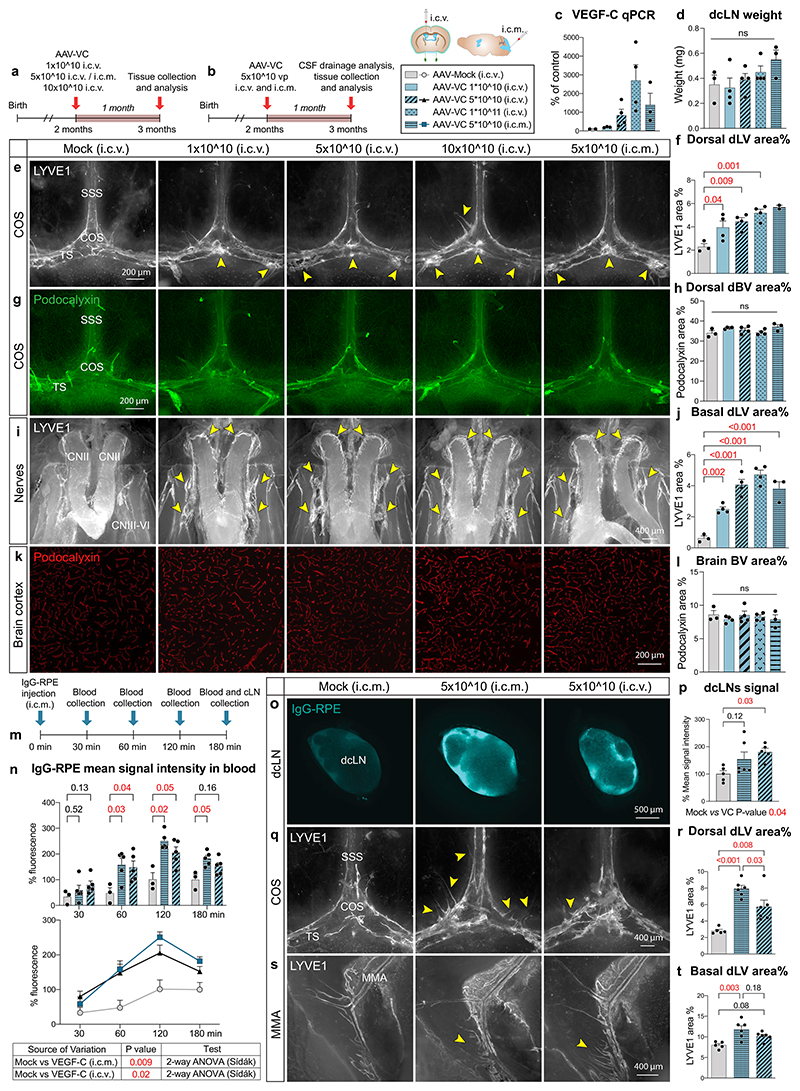
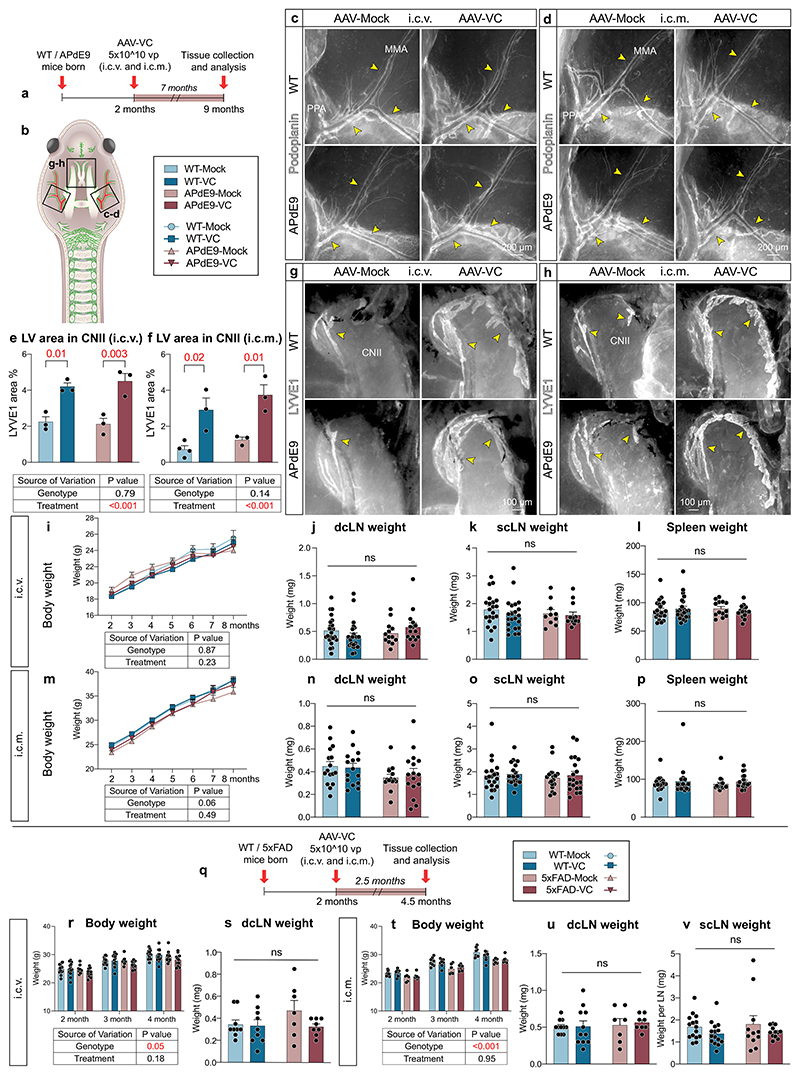
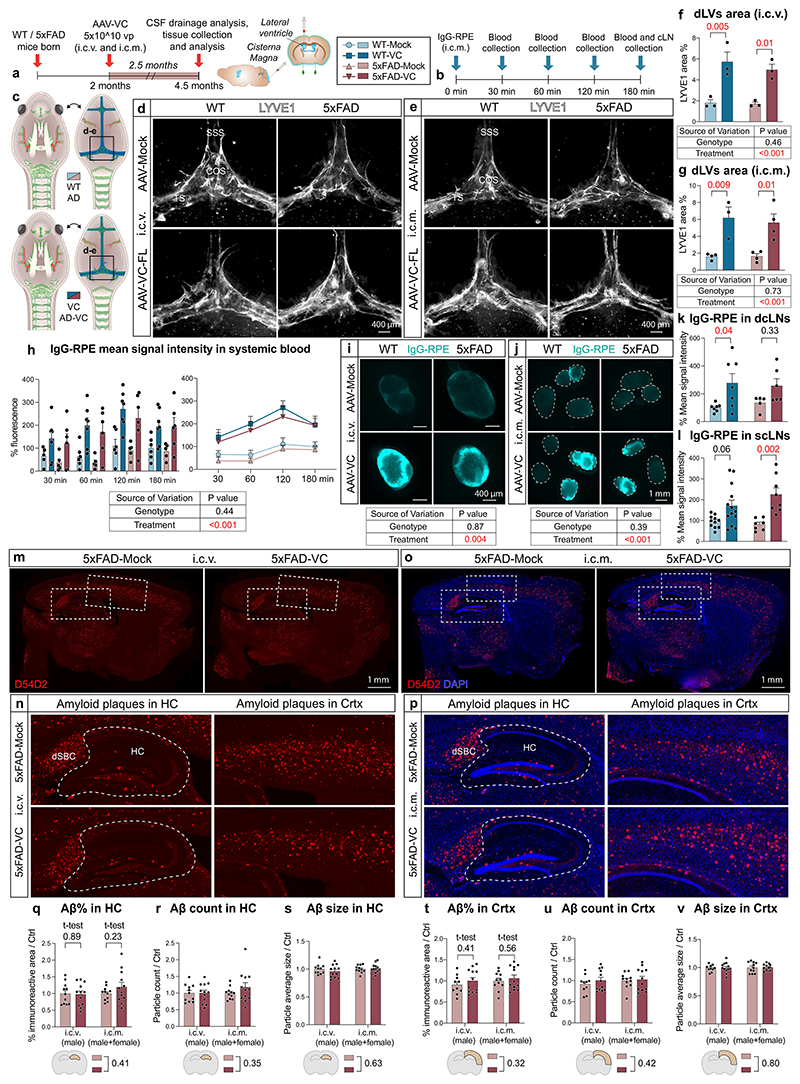
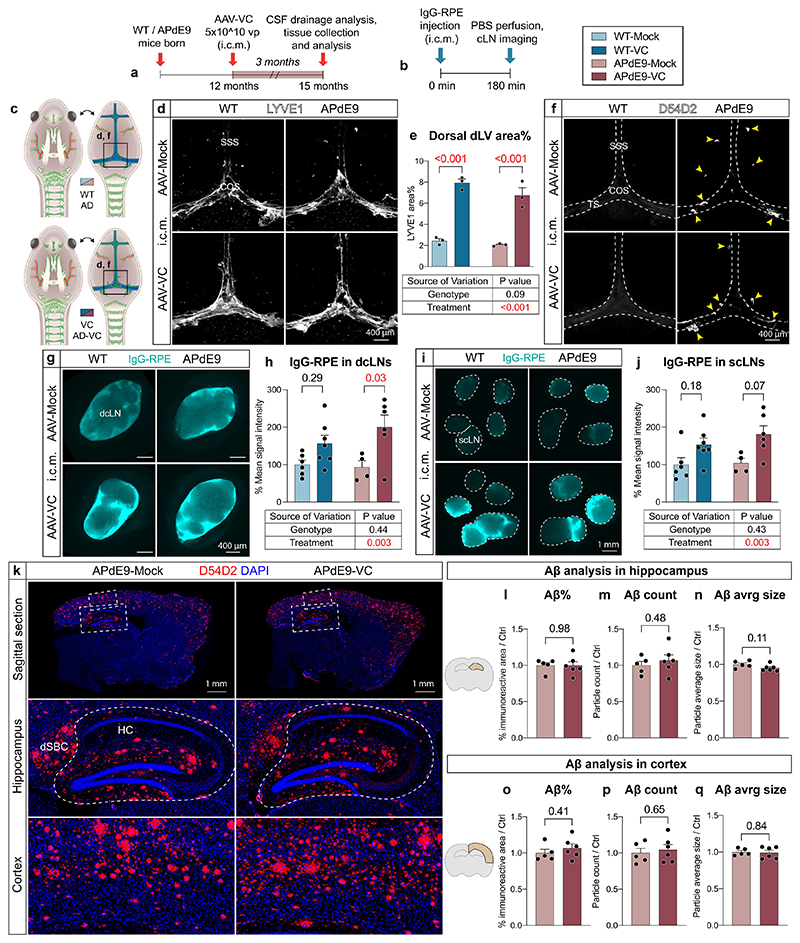
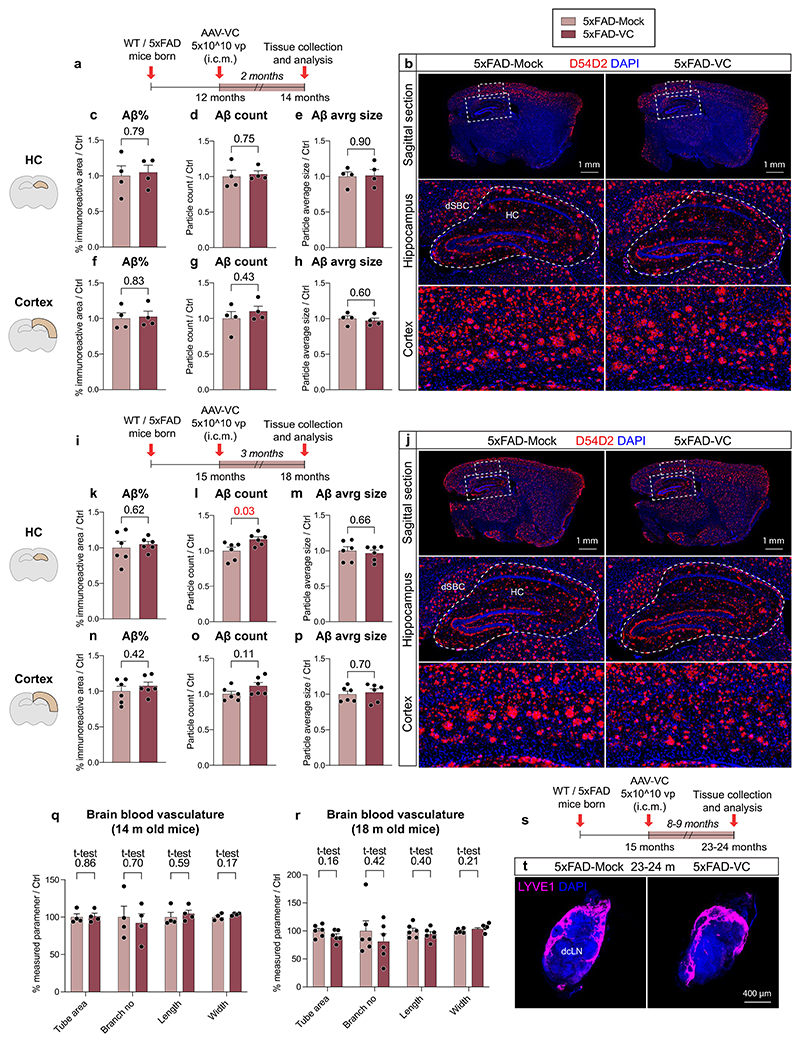
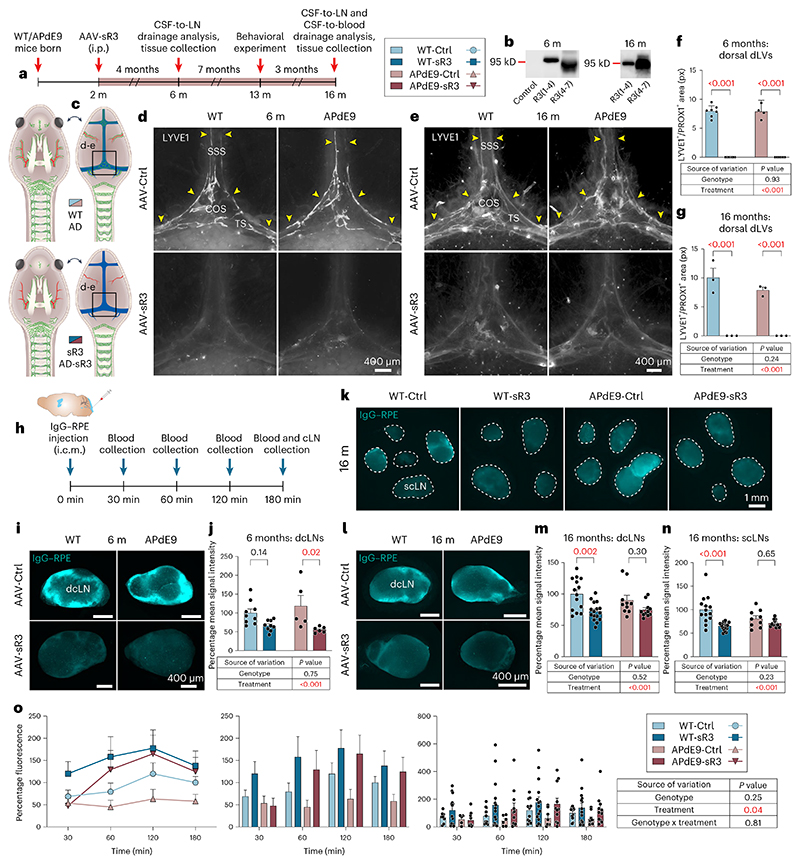
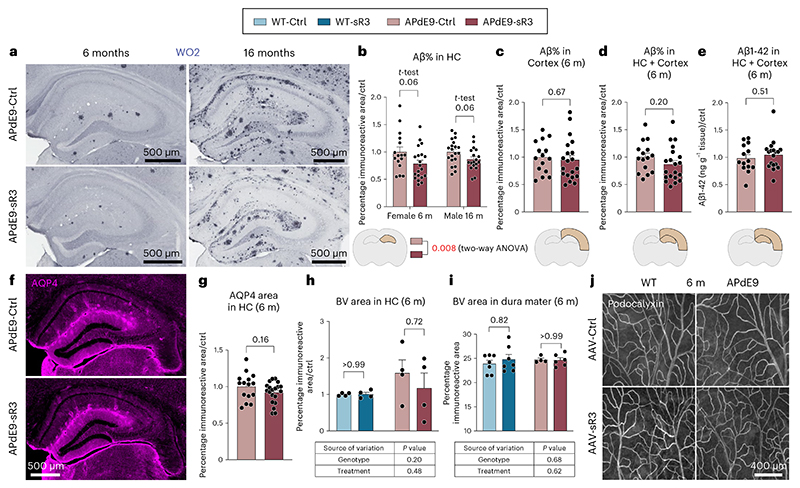
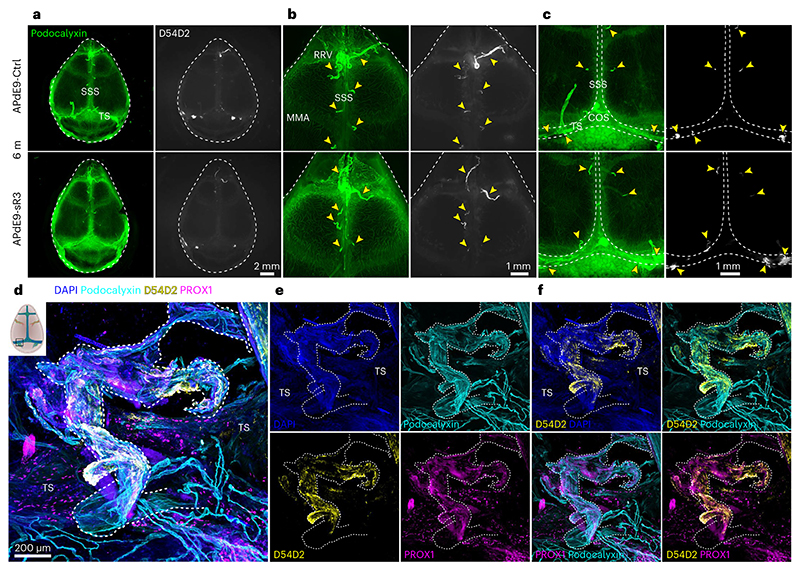
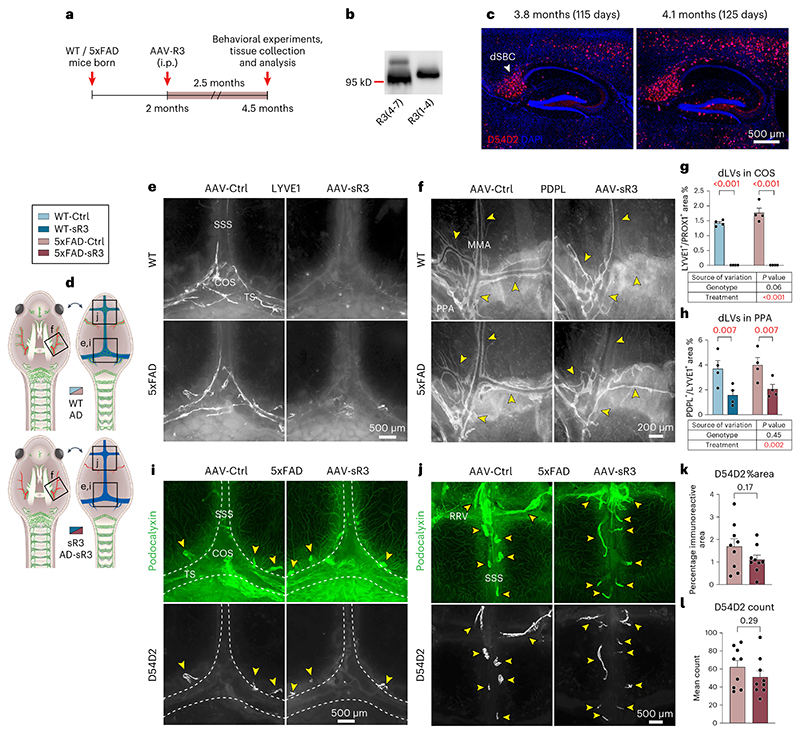
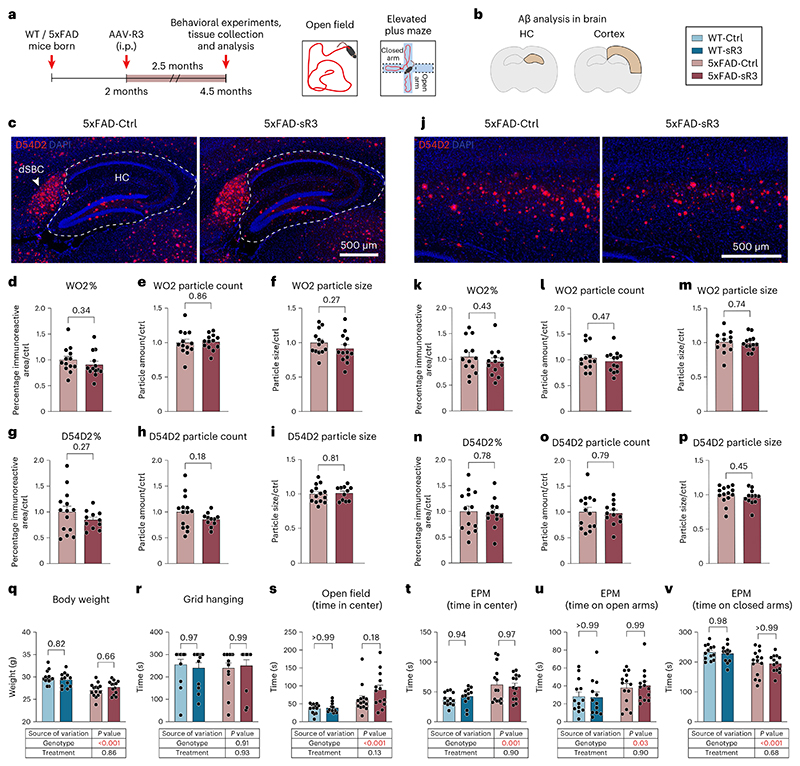
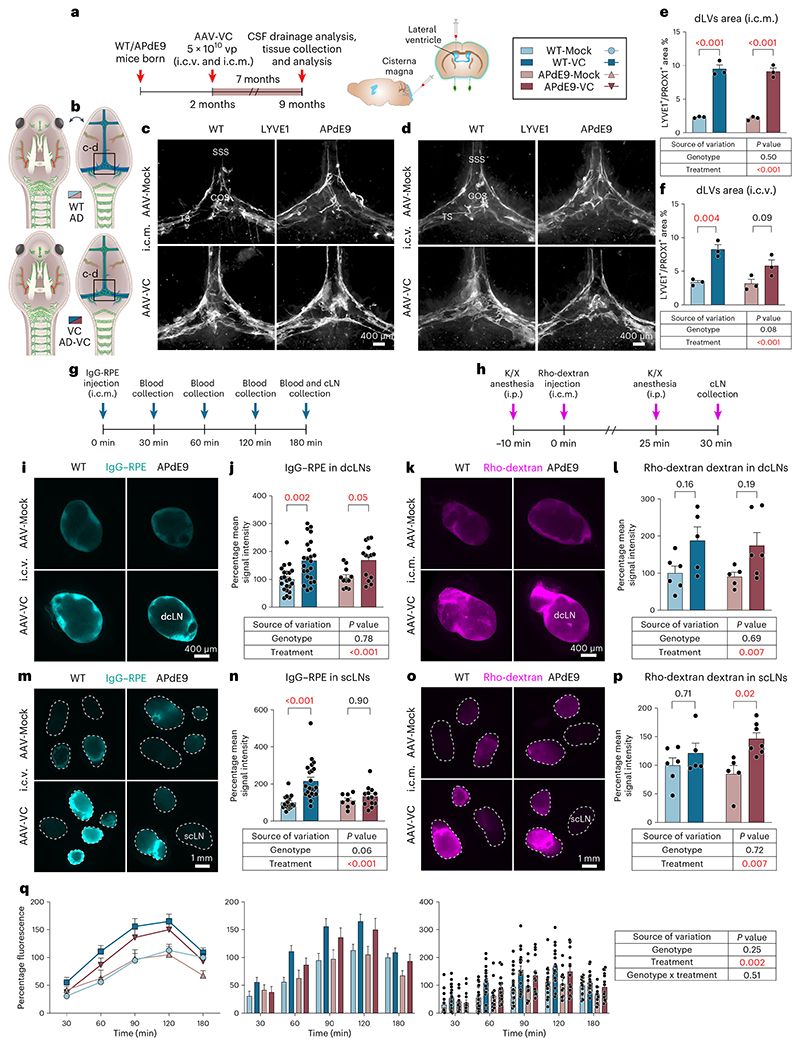
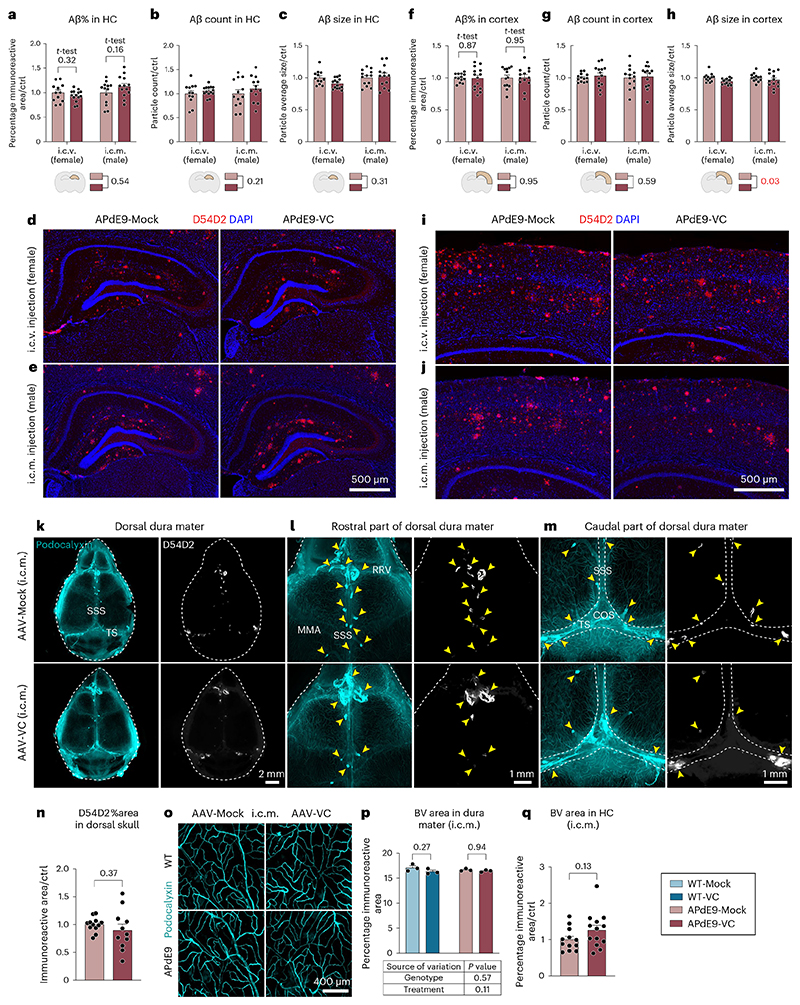
Discovery of meningeal lymphatic vessels (LVs) in the dura mater, also known as dural LVs (dLVs) that depend on vascular endothelial growth factor C expression, has raised interest in their possible involvement in Alzheimer's disease (AD). Here we find that in the APdE9 and 5xFAD mouse models of AD, dural amyloid-β (Aβ) is confined to blood vessels and dLV morphology or function is not altered. The induction of sustained dLV atrophy or hyperplasia in the AD mice by blocking or overexpressing vascular endothelial growth factor C, impaired or improved, respectively, macromolecular cerebrospinal fluid (CSF) drainage to cervical lymph nodes. Yet, sustained manipulation of dLVs did not significantly alter the overall brain Aβ plaque load. Moreover, dLV atrophy did not alter the behavioral phenotypes of the AD mice, but it improved CSF-to-blood drainage. Our results indicate that sustained dLV manipulation does not affect Aβ deposition in the brain and that compensatory mechanisms promote CSF clearance.


Conflict of interest statement

Competing interests The authors declare no competing interests.

Figures

Extended Data Fig. 1
Extended Data Fig. 1. APdE9 mice lacking dLVs show impaired CSF outflow into cLNs but no change in brain ventricle volume.
a–n, Comparison of littermate WT, APdE9, K14 and APdE9;K14 mice. Both female and male mice were used in experiments. CN, cranial nerve; COS, confluence of sinuses; CP, cribriform plate; dcLN, deep cervical lymph node; MMA, middle meningeal artery; PPA, pterygopalatine artery; SC, spinal canal; SSS, superior sagittal sinus; TS, transverse sinus. a, Example of ex vivo imaging of IgG-RPE (red) inside dorsal dLV (green) near COS in a WT mouse after intracranial tracer delivery. b, Analysis of IgG-RPE signal in dcLNs 180 minutes after i.c.v. injection (n = 3,3). IgG-RPE tracer signal values are normalized to average of WT group. LN values represent an average of both sides (left and right) amaximum one LN per side per mouse was used in quantification. c, Quantification of ventricle volumes imaged with MRI in 8-month-old mice (n = 7,7 for females and n = 13,13 for males) d, Experimental schedule for panels (e-n) and simplified schematic illustration of dLVs (green) attached to the basal and dorsal cranium and spinal canal after removal of the brain and spinal cord. Areas visualized in panels (e-n) are indicated with boxes. e-n, Comparison of dLVs (white) around (e, f) COS, (g, h) PPA, (i, j) SC, (k, l) external ethmoidal artery next to cribriform plate, and (m, n) CN II-VI region in 6-month-old mice (n = 5,5). Yellow arrowheads point to different dLV branches. White arrows point to direction of cribriform plate. Pineal gland is excised from the middle of COS in (e) to visualize all dLVs. Data shown are representative of at least two independent experiments using littermate mice. Datapoints shown in graphs represent individual mice. P values were calculated using (b, f, h, j, l, n) unpaired two-tailed t-test and (c) two-way ANOVA with Tukey’s post hoc test for multiple comparison. Data are presented as mean values ± s.e.m. Scale bars: 10 μm (a), 100 μm (k), 200 μm (g, i, m), and 400 μm (e).
Extended Data Fig. 2
Extended Data Fig. 2. APdE9 mice lacking dLVs show no increase in overall brain Aβ load.
a-i, Comparison of littermate WT, APdE9, K14-sR3 and APdE9;K14-sR3 mice. Both female and male mice were used in experiments. BV, blood vessel; HC, hippocampus. a, Experimental schedule for panels (b-g). b, Representative images of LYVE1 (white) immunostained dcLN cryosections. c,d,f,g, Comparison of WO2 (blue) immunoreactive area in (c,d) hippocampus (n = 13,14,13,14), (c,f) cortex above the hippocampus (n = 13,14,14,14), and (g) hippocampus plus cortex (n = 13,14,13,14) of male and female cohorts of APdE9 vs APdE9-K14 mice. e, ELISA analysis of insoluble Aβ1-42 (ng/mL) in hippocampus (n = 12,16,16,11) of male and female cohorts of APdE9 vs APdE9;K14-sR3 mice. h-i, Comparison of podocalyxin (cyan) staining of 10-month-old WT vs K14-sR3 female mice in hippocampus (n = 7,7). Data shown are representative of at least two independent experiments using littermate mice. Datapoints shown in graphs represent individual mice. Aβ values represent an average of 5 brain sections (210 mm apart) per mouse. Aβ values in panel (g) represent an average of hippocampus and cortex values that were normalized to average of APdE9-Ctrl group of every experimental set. Podocalyxin values represent an average of 2 brain sections (200 μm apart) per mouse, normalized to the average of WT group of every experimental set. P values were calculated using (d-g, i) unpaired two-tailed t-test and (d-g) two-way ANOVA with Tukey’s post hoc test for multiple comparison. Data are presented as mean values ± s.e.m. Scale bars: 200 μm (b), and 500 μm (c, h).
Extended Data Fig. 3
Extended Data Fig. 3. AAV-sR3 induced dLV regression in APdE9 mice does not affect LN, spleen, or body weight, or ICP.
a-p, Comparison of littermate AAV-Ctrl and AAV-sR3 treated WT and APdE9 mice at 6 (female) and 16 (male) months of age. a, Simplified schematic illustration of dLVs (green) attached to the basal cranium and spinal canal after removal of the brain and spinal cord. b–e, Comparison of dLVs (white) in PPA region at (b, d) 6 months (n = 9,11,7,9), and (c, e) 16 months (n = 3,3,3,3) of age. f-h, Comparison of dLVs (white) in (f) CP, (g) foramen magnum (FM), and (h) SC region. i–n, Comparison of (i-j) dcLN weight at 6 (n = 14,15,5,7) and 16 (n = 17,20,10,11) months of age (k-l) spleen weight at 6 (n = 5,5,7,3) and 16 (n = 14,20,10,11) months of age, and (m-n) body weight at 6 (n = 19,19,13,11) and 16 (n = 14,20,10,11) months of age. LN weight represents an average of both sides (left and right) and maximum one dcLN per side per mouse was used in quantification. (o) Representative images of LYVE1 (white) staining in dcLNs. p, Comparison of intracranial pressure (ICP) in 14-month-old WT-Ctrl vs WT-sR3 (female mice; n = 7,7) groups 12 months after AAV injection. Yellow arrowheads point to different dLV branches. Data shown are representative of at least two independent experiments using littermate mice. Datapoints in graphs represent individual mice. P values were calculated with (p) unpaired two-tailed t-test, (d, e, i-l) two-way ANOVA, (m) three-way repeated measures ANOVA, and (n) three-way repeated measures mixed-effects model with Tukey’s post hoc test for multiple comparison in (d, e, i–n). Data are presented as mean values ± s.e.m. Scale bars: 200 μm (b, e), and 400 μm (f-h, o).
Extended Data Fig. 4
Extended Data Fig. 4. Aβ staining in dura mater is associated mainly with bridging veins.
a-h, Whole-mount stainings of dorsal dura mater. BrV, bridging vein; dBV, dural blood vessel; dLV, dural lymphatic vessel. SSS and BrVs connecting to it are outlined in all panels by the white dashed line. a-f, Representative confocal images of DAPI (blue), endomucin (cyan), D54D2 (yellow), and LYVE1 (magenta) staining (a-c) and DAPI (blue), podocalyxin (cyan), D54D2 (yellow), and PROX1 (magenta) staining (d-f) in old APdE9 mouse (22-month-old non-treated female). White arrows indicate Aβ staining associated with BrV. White arrowheads indicate dLVs. g-h, Representative stereomicroscope images of podocalyxin (cyan), SMA (magenta), and D54D2 (yellow) staining in adult APdE9 mouse (9,5-month-old male) (g) and podocalyxin (cyan), BMX (magenta, stained with RFP), and vWF (yellow) staining in adult BmxCreERT2Rosa26LSL-TdTomato mouse (13-month-old male) (h). BrVs connecting to SSS are marked with yellow arrowheads. Data shown are representative of minimum n = 3 for every staining. Scale bars: 100 μm (a-f), and 500 μm (g, h).
Extended Data Fig. 5
Extended Data Fig. 5. AAV-sR3 induced dLV regression causes only modest changes in the behavioral phenotype of WT and APdE9 mice.
a-z, Comparison of behavioral results in littermate male AAV-Ctrl treated WT (n = 10), APdE9 (n = 11) and AAV-sR3 treated WT (n = 12) and APdE9 (n = 9) mice at 13-14 months of age. NB, nest building; LD, Light–dark; OF, Open field; MWM, Morris water maze; BM, Barnes maze; FC, Fear conditioning. a, Experimental schedule of all behavioral tests. b-d, NB results showing (b) nest scores at timepoint 1 (c) nest scores at timepoint 2, and (d) amount of unshredded cotton at the end of both time points. e-h, LD results showing total (e) distance traveled in light side (f) distance traveled in dark side (g) distance traveled, and (h) time spent on light side. i-j, OF results showing total (i) time spent at the center of open field arena and (j) distance moved in open field arena. k-n, MWM results showing (k) escape latency in eight training sessions (S1-S8; total four days with two training sessions per day). (l) escape latency in last training session (S8, reverse training), (m) total time spent in trained quadrant in probe trial, and (n) total time spent in trained platform in probe trial. o-t, BM experimental results showing (o, r) latency to target zone in probe trials 1-2, (p, s) time spent in target zone in probe trials 1-2, (q) time spent at the center of arena in probe trial 1, and (t) time spent in target and adjacent zones of the arena in probe trial 2. u-z, FC results at day 1 and 2 showing (u, x) freezing % during 180 seconds, (v, y) total distance moved, and (w, z) mean explored area %. Data shown are representative of a single experiment using littermate mice. Datapoints in graphs represent individual mice. The NB, MWM, BM and FC illustrations were created with BioRender.com. P values were calculated using (e-j, l-z) two-way ANOVA, (b-d) two-way repeated measures ANOVA, and (b-d, k) three-way repeated measures ANOVA all with Tukey’s post hoc test for multiple comparison. Data are presented as mean values ± s.e.m.
Extended Data Fig. 6
Extended Data Fig. 6. AAV-VC induced dLV expansion improves CSF outflow into cLNs and blood circulation in WT mice.
a, Experimental schedule for panels c-l with male AAV-Mock (i.c.v.), AAV-VC 1*1010 vp (i.c.v.), AAV-VC 5*1010 vp (i.c.v.), AAV-VC 1*1011 vp (i.c.v.), and AAV-VC 5*1010 vp (i.c.m.) groups. b, Experimental schedule for panels (m-t) with female AAV-Mock (i.c.v.), AAV-VC 5*1010 vp (i.c.v.), and AAV-VC 5*1010 vp (i.c.m.) groups. c, Quantification of VEGF-C mRNA levels in brain cortex (n = 2,3,4,4,3). d, Quantification of dcLN weight (n = 3,4,4,4,3). e-j, Comparison of dura mater (e, f) LYVE1 area (white) in dorsal skull around COS (n = 3,4,4,4,2), (g, h) podocalyxin area (green) in dorsal skull (n = 3,4,4,4,32; two areas per mouse around large dural sinuses), (i, j) LYVE1 area (white) in basal skull around CNII-VI (n = 3,4,4,4,3). Yellow arrowheads in e, g point towards areas with most prominent lymphangiogenesis. k-l, Podocalyxin immunoreactive area (red) in brain cortex (n = 3,4,4,4,3). m-n, Kinetic analysis of IgG-RPE tracer appearance in systemic blood at 30, 60, 120 and 180 min after i.c.m injection (n = 3,5,5), visualized in two different ways. o-p, Comparison of IgG-RPE tracer signal in dcLNs at 180 min after i.c.m injection (n = 5,6,5). q-t, Comparison of LYVE1 (white) staining (n = 5,6,6) in (q, r) COS and (s, t) MMA region. Yellow arrowheads point towards new lymphatic sprouts. Panels (c-l) and (m-t) represent single independent experiments using littermate mice. Datapoints shown in graphs represent individual mice. LN values in (d, p) represent an average of both sides (left and right); maximum one LN per side per mouse was used in quantification. LN and blood IgG-RPE tracer signal values are normalized to the average of WT-Mock group of every experimental set at the 3 h timepoint. The pineal gland was excised in (e, g, q) to visualize blood and lymphatic vasculature. P values were calculated using one-way ANOVA with (d, f, h, j, l, p) Dunnett’s post hoc or (r, t) Tukey’s post hoc or (n) two-way repeated measures ANOVA with Dunnett’s and Sidak’s post hoc tests for multiple comparison. Data are presented as mean values ± s.e.m. Scale bars: 200 μm (e, g, k), 400 μm (i, q, s) and 500 μm (o).
Extended Data Fig. 7
Extended Data Fig. 7. AAV-VC induced dLV expansion in APdE9 and 5xFAD mice does not affect LN, spleen, or body weight.
a, Experimental schedule for panels b–p; comparison of littermate AAV-Mock and AAV-VC-treated i.c.m. (male) and i.c.v. (female) injected WT and APdE9 mice at 9 months of age. b, Simplified schematic illustration of dLVs (green) attached to the basal cranium and spinal canal after removal of the brain and spinal cord. c-h, Comparison of dLVs (white) in (c-d) PPA and (e-h) CNII region of i.c.v. (n = 3,3,3,3) and i.c.m. (n = 4,3,3,3) injected APdE9 and WT mice. i-l, Comparison of (i) body (n = 23,23,13,15), (j) dcLN (n = 23,23,13,15), (k) scLN (n = 21,22,10,13), and (l) spleen weight (n = 23,23,13,15) in i.c.v. injected APdE9 and WT mice. m-p, Comparison of (m) body (n = 20,19,18,20), (n) dcLN (n = 16,15,14,16), (o) scLN (n = 20,18,18,20), and (p) spleen weight (n = 20,19,18,20) in i.c.m. injected APdE9 and WT mice. q, Experimental schedule for panels r-v; comparison of littermate AAV-Mock and AAV-VC-treated i.c.m. (male and female) and i.c.v. (male) injected WT and 5xFAD mice at 4.5 months of age. r-s, Comparison of (r) body (n = 13,13,11,12) and (s) dcLN (n = 9,9,7,8) weight in i.c.v. injected 5xFAD and WT mice. t-v, Comparison of (t) body (n = 8,8,6,7), (u) dcLN (n = 11,11,7,8), and (v) scLN (n = 15,15,11,12) in i.c.m. injected 5xFAD and WT mice. Data shown are representative of at least two independent experiments using littermate mice. Datapoints in graphs represent individual mice. dcLN weights (j, n, r, u) represent an average of both sides (left and right, max one LN per side per mouse) and scLN weights (k, o, v) represent an average of all LNs on the left side of the body. P values were calculated with (e, f, j-l, n-p, s, u, v) two-way ANOVA, (r, t) three-way repeated measures ANOVA, and (i, m) three-way repeated measures mixed-effects model with Tukey’s post hoc test for multiple comparison. Data are presented as mean values ± s.e.m. Scale bars: 100 μm (g, h) and 200 μm (c, d).
Extended Data Fig. 8
Extended Data Fig. 8. AAV-VC induced dLV expansion in 5xFAD mice improves CSF outflow into cLNs and blood circulation but does not affect Aβ load in the brain.
a-v, Comparison of littermate AAV-Mock and AAV-VC-treated i.c.m. (male and female) and i.c.v. (male) injected WT and 5xFAD mice at 4.5 months of age. a, Schedule indicating AAV administration and experimental analysis time points. b, Schedule of CSF drainage analysis. c, Simplified schematic illustration of dural LVs (green). d-g, Comparison of LYVE1 (white) area percentage in dorsal dura mater after (d, f) AAV i.c.v (n = 3,3,3,3) or (e, g) AAV i.c.m administration (n = 4,3,4,4). The pineal gland was excised in (d, e) to visualize all dLVs. h, Kinetic analysis of IgG-RPE tracer in systemic blood at 30, 60, 120 and 180 min after IgG-RPE administration (n = 6,7,5,6) in the i.c.v injected mice visualized by two different ways. i-l, IgG-RPE tracer signal in (i, k) dcLN (n = 7,7,5,6) and (j, l) scLNs (n = 11,13,7,8) 180 minutes after IgG-RPE administration. m-p, Comparison of D54D2 (red) staining in hippocampus and cortex after (m, n) i.c.v administration and (o, p) i.c.m administration. The outlining indicates the quantified HC area without dorsal subiculum (dSBC). q-v, D54D2 immunostained area%, particle count and average particle size of the AAV-injected AD mice in (q-s) hippocampus (i.c.v. n = 11,12; i.c.m. n = 11,12 from which male n = 6,7; female n = 5,5) and (t-v) cortex (i.c.v. n = 10,12; i.c.m. n = 11,12 from which male n = 6,7; female n = 5,5). Data shown are representative of at least two independent experiments using littermate mice. The datapoints shown in graphs represent individual mice. Maximum one LN per side per mouse was used in quantification and dcLN values represent an average of both sides. The IgG-RPE tracer signal in LNs and blood was normalized to the average in the WT-Ctrl group of every experimental set at the 3 h timepoint. Aβ values represent an average of 6 brain sections (400 μm apart) normalized to average of 5xFAD-Ctrl group in every experimental set. P values were calculated with (q, t) unpaired two-tailed t-test, (f, g, k, l, q-v) two-way ANOVA and (h) three-way repeated measures Mixed-effects model with Tukey’s post hoc test for multiple comparisons. Data are presented as mean values ± s.e.m. Scale bars: 400 μm (d, e, i) and 1 mm (j, m, o).
Extended Data Fig. 9
Extended Data Fig. 9. AAV-VC induced dLV expansion in old APdE9 mice improves CSF outflow into cLNs and blood circulation but does not affect Aβ load in the brain.
a-q, Comparison of data from littermate male WT, APdE9 and AAV-VC-treated (i.c.m.) WT and APdE9 mice at 15 months of age. a, Schedule indicating AAV administration and experimental analysis time points. b, Schedule of the CSF drainage analysis. c, Simplified schematic illustration of dLVs (green) attached to the basal cranium and spinal canal after removal of the brain and spinal cord. d-f, Comparison of (d-e) LYVE1 (white) and (f) D54D2 (white) area in dorsal dura mater (n = 3,3,3,3). The pineal gland was excised from (d, f) to visualize all dLVs. g-j, Comparison of IgG-RPE tracer signal in (g-h) dcLN (n = 7,7,4,6) and (i-j) scLNs (n = 7,7,4,6) 180 minutes after i.c.m injection. k-q, Comparison of D54D2 staining in (k, l–n) hippocampus and (k, o-q) cortex of i.c.m injected APdE9 mice (n = 5,6). An example of the quantified HC area without dorsal subiculum is outlined in the images. Data shown are representative of a single experiment using littermate mice. The datapoints shown in the graphs represent individual mice. LN values in (h, j) represent an average of both sides (left and right) and maximum one LN per side per mouse was used in quantification. LN IgG-RPE tracer signal values were normalized to the average of WT-Ctrl group of every experimental set at the 3 h timepoint. Aβ values represent an average of 6 brain sections (400 μm apart) per mouse and are normalized to the average of APdE9-Ctrl group of every experimental set. P values were calculated with (l-q) unpaired two-tailed t-test and (e, h, j) two-way ANOVA with Tukey’s post hoc test for multiple comparison. Data are presented as mean values ± s.e.m. Scale bars: 400 μm (d, f, g) and 1 mm (i, k).
Extended Data Fig. 10
Extended Data Fig. 10. AAV-VC induced dLV expansion in old 5xFAD mice does not affect Aβ load in the brain.
a–t, Comparison of data from littermate AAV-Mock and AAV-VC treated (i.c.m.) 5xFAD mice at 14 (both sexes), 18 (males) and 23-24 (females) months of age. a, Experimental schedule for (b-h, q). a-h, Comparison of D54D2 (red) staining in (b–e) hippocampus and (b, f-h) cortex of 14-month-old 5xFAD mice after 2-month AAV treatment (n = 4,4). i, Experimental schedule for (j-p, r). j-p, Comparison of D54D2 (red) staining in (j-m) hippocampus and (j, n-p) cortex of 18-month-old 5xFAD mice after 3-month AAV treatment (n = 6,6). q-r, Quantification of podocalyxin immunoreactive tube area%, branch number, skeleton length, and tube width in cortex of (q) 14-month-old 5xFAD mice after 2-month AAV treatment (n = 4,4) and (r) 18-month-old 5xFAD mice after 3-month AAV treatment (n = 6,6). Quantification was done with AutoTube software (Montoya-Zegarra et al). s, Experimental schedule for (t). t, Representative image of LYVE1 whole-mount staining in dcLNs of 23-24-month-old 5xFAD mice after 8-9-month AAV treatment (n = 3,3). Data shown are representative of single experiments using littermate mice. The datapoints shown in graphs represent individual mice. Examples of quantified HC areas without dorsal subiculum are outlined in the images (b, j). Aβ and podocalyxin values represent an average of 6 brain sections (400 μm apart) per mouse and are normalized to average of 5xFAD-Ctrl group of every experimental set. P values were calculated with (c-h, k-r) unpaired two-tailed t-test. Data are presented as mean values ± s.e.m. Scale bars: 400 μm (t) and 1 mm (b, j).
Fig. 1
Fig. 1. AAV-sR3 induced dLV regression in WT and APdE9 mice impairs CSF outflow into cLNs but improves CSF outflow into blood circulation.
Comparison of littermate AAV-Ctrl and AAV-sR3 treated WT and APdE9 mice at 6 (female) and 16 (male) months of age. COS, confluence of sinuses; dcLN, deep cervical lymph node; scLN, superficial cervical lymph node; SSS, superior sagittal sinus; TS, transverse sinus. a, Schedule indicating AAV administration and experimental analysis time points. b, Western blot showing mVEGFR3-Ig protein in serum after AAV injection. Control sample is from a mouse with no detectable protein expression (unsuccessful injection), which was omitted from the analysis. c, Simplified schematic illustration of dLVs (green) attached to the basal and dorsal cranium and spinal canal. dg, Comparison of LYVE1+/PROX1+ dLVs in the dorsal skull at 6 months (n = 7, 7, 4 and 6) (d,f) and 16 months (n = 3, 3, 3 and 3) (e,g) of age. LYVE1 staining in white (d,e). Yellow arrowheads point to dLV branches visible only in mice injected with AAV-Ctrl. Pineal gland was excised from the middle of COS in (d,e) to visualize all dLVs. h, The schedule of CSF drainage analysis. in, Comparison of IgG–RPE tracer signal in dcLNs (n = 9, 9, 5 and 6) of 6-month-old mice (i,j) and in scLNs (n = 14, 16, 9 and 11) and dcLNs (n = 14,16,10,11) (k,n) of 16-month-old mice 180 min after i.c.m. injection. LN values in (j, m, n) represent an average of both sides; maximum one LN per side per mouse was used for quantification. o, Kinetic analysis of IgG–RPE tracer appearance in systemic blood (saphenous vein) at 30, 60, 120 and 180 min after i.c.m. injection into 16-month-old mice (n = 11, 15, 9 and 11) visualized in three different ways. Data shown are representative of at least two independent experiments using littermate mice. The data points represent individual mice. LN and blood IgG–RPE tracer signal values are normalized to the average of the WT-Ctrl group of every experiment set at the 3-h time point. P values were calculated using two-way ANOVA (f,g,j,m,n) and three-way repeated measures mixed-effects model with Tukey’s post hoc test for multiple comparisons (o). Data are presented as mean ± s.e.m. Scale bars, 400 μm (d,e,i,l) and 1 mm (k).
Fig. 2
Fig. 2. AAV-sR3 induced dLV regression in APdE9 mice does not increase the overall brain Aβ load.
Comparison of littermate AAV-Ctrl- and AAV-sR3-treated WT and APdE9 mice at 6 (female) and 16 (male) months of age. BV, blood vessel; HC, hippocampus. a,b, Comparison of WO2 (blue) staining of hippocampus in coronal brain sections in 6-month-old (n = 16 and 20) and 16-month-old (n = 20 and 18) mice. c,d, Quantification of Aβ% in cortex (c) and HC plus cortex (d) in 6-month-old (n = 15 and 20) mice. e, ELISA quantification of insoluble Aβ1-42 (ng g−1) in the brains in 6-month-old (n = 14 and 18) mice. Each data point represents an average of HC and cortex values. f,g, Comparison of aquaporin-4 (AQP4, magenta) staining of HC in 6-month-old mice (n = 15 and 20). hj, Comparison of podocalyxin (white color in j) staining in HC (n = 4, 4, 4 and 4) (h) and dorsal dura mater (n = 7,7,4,6) (i,j) in 6-month-old mice. Data shown are representative of at least two independent experiments using littermate mice. Data points shown in graphs represent individual mice. Aβ values represent an average of five brain sections (210 mm apart) per mouse. W02, Aβ1-42, AQP4 and brain podocalyxin values were normalized to average of the APdE9-Ctrl group of every experimental set. P values were calculated with unpaired two-tailed t-test (be,g) and two-way ANOVA (b,h,i) with Tukey’s post hoc test for multiple comparison. Data are presented as mean values ± s.e.m. Scale bars, 400 μm (j) and 500 μm (a,f).
Fig. 3
Fig. 3. Aβ deposits in dura mater are associated with bridging veins, but not with dLVs.
ac, Representative images of podocalyxin (green) and D54D2 (white) staining in skull-associated dorsal dura in 6-month-old female APdE9 littermate mice treated with AAV-Ctrl- or AAV-sR3. Dorsal dura mater (a). Rostral part (b). Caudal part (c). MMA, middle meningeal artery; RRV, rostral rhinal vein. Yellow arrowheads point to areas where D54D2+ amyloid deposits associate with podocalyxin+ bridging veins that connect to large dural sinuses. Pineal gland was excised in a,c to visualize all blood vessels. df, Representative image of 4,6-diamidino-2-phenylindole (DAPI) (blue), podocalyxin (cyan), D54D2 (yellow) and PROX1 (magenta) staining in a 22-month-old non-treated female APdE9 mouse. Image with all stainings combined (d). Separated images (e). Images with two stainings combined (f). The dotted line marks the podocalyxin+ bridging vein that connects to the TS and is associated with most D54D2+ Aβ deposits in the TS region. Data shown are representative of at least two independent experiments using littermate mice. Scale bars, 1 mm (b,c), 2 mm (a) and 200 μm (d).
Fig. 4
Fig. 4. Dural Aβ load in 5xFAD mice is not affected by AAV-sR3 induced dLV regression.
Comparison of littermate AAV-Ctrl- and AAV-sR3-treated WT and 5xFAD male mice at 4.5 months of age. a, Schedule indicating AAV administration and experimental analysis time points. b, Western blot showing mVEGFR3-Ig protein in serum after AAV injection. c, Representative D54D2 staining (red) in the HC of littermate mice with 10-d age difference. dSBC, dorsal subiculum. d, Simplified schematic illustration of dLVs (green) attached to the basal and dorsal cranium and spinal canal. e-h, Comparison of LYVE1 (white) staining in COS (n = 4,4,4,4) (e,g) and podoplanin (white) staining in PPA region (n = 4, 4, 4 and 4; average of left and right side) (f,h). Yellow arrowheads point to basal dLV branches that show robust regression after sR3 treatment. ij, Comparison of D54D2 (white) and podocalyxin (green) staining in caudal (i) and rostral (j) dorsal dura mater. Yellow arrowheads point to areas where D54D2+ Aβ deposits colocalize with podocalyxin+ bridging veins that connect to large dural sinuses. k-l, Quantification of D54D2 %area and count (n = 9,9) in the caudal region of dorsal dura mater visualized in i. Data shown are representative of at least two independent experiments using littermate mice. Data points shown in graphs represent individual mice. Pineal gland was excised (e,i) to visualize all blood and lymphatic vessels. P values were calculated using two-way ANOVA with Tukey’s post hoc test for multiple comparison (g,h) and unpaired two-tailed t-test (k,l). Data are presented as mean ± s.e.m. Scale bars, 200 μm (f) and 500 μm (e,i,j).
Fig. 5
Fig. 5. AAV-sR3 induced dLV regression does not affect brain Aβ load in 5xFAD mice.
Comparison of littermate AAV-Ctrl- and AAV-sR3-treated WT and 5xFAD male mice at 4.5 months of age. a, Schedule indicating AAV administration and experimental analysis time points. b, Schematic illustration indicating brain quantification areas in panels (cp). c,j, Representative images of D54D2 Aβ staining (red) in HC (c) and cortex (j) region. Example of a quantified HC area without dSBC is outlined with the white dashed line. dp, Quantification of Aβ staining in HC (WO2; n = 13 and 13 and D54D2; n = 14 and 11) (di) and cortex (WO2; n = 13 and 13 and D54D2; n = 14 and 12) (kp) region. qv, Comparison of body weight (q), grid hanging (r), open field (s) and elevated plus maze (EPM) (tv) results (n = 13, 12, 14 and 13). Data shown are representative of at least two independent experiments using littermate mice. Data points shown in graphs represent individual mice. Brain Aβ values represent an average of six brain sections (400 μm apart) per mouse and are normalized to average of 5xFAD-Ctrl group of every experimental set. P values were calculated using unpaired two-tailed t-test (di,kp) and two-way ANOVA with Tukey’s post hoc test (qv) for multiple comparisons. Data are presented as mean ± s.e.m. Scale bars, 500 μm (c,j).
Fig. 6
Fig. 6. AAV-VEGF-C induced dLV expansion in APdE9 mice improves CSF outflow into cLNs and into blood circulation.
Comparison of littermate AAV-Mock and AAV-VC-treated i.c.m. (male) and i.c.v. (female) injected WT and APdE9 mice at 9 months of age. Rho, rhodamin; vp, viral particle; VC, vascular endothelial growth factor C (VEGF-C). a, Schedule indicating AAV administration and experimental analysis time points. b, Simplified schematic illustration of dLVs (green) attached to the basal and dorsal cranium and spinal canal after removal of the brain and spinal cord. cf, Comparison of LYVE1 (white) staining in dorsal skull of i.c.m. (n = 4, 3, 3 and 3) (c,e) and i.c.v. (n = 3, 3, 3 and 3) (d,f) injected mice. Pineal gland was excised in (c,d) to visualize all dLVs. gh, Experimental schedules for IgG–RPE and Rho-dextran drainage analysis into blood (g) and lymphatic system (g,h). il, Comparison of tracer signal in dcLNs at 180 min (n = 22, 23, 11 and 14) (i,j) and 30 min (n = 6, 5, 5 and 6) (k,l) after i.c.m. injection. mp, Comparison of tracer signal in scLNs at 180 min (n = 20,22,8,13) (m,n) and 30 min (n = 6, 5, 5 and 7) (o,p) after i.c.m injection. q, Kinetic analysis of IgG–RPE tracer in systemic blood (saphenous vein) at 30, 60, 90, 120 and 180 min after i.c.m. injection (n = 21, 19, 12 and 15), visualized in three different ways. Data shown are representative of at least two independent experiments using littermate mice. Data points shown in graphs represent individual mice. Maximum one LN per side per mouse was used in quantification. IgG-RPE LN values represent an average of both sides. LN and blood tracer signal values were normalized to the average of WT-Ctrl group of every experimental set at 3 h (IgG–RPE) and 30 min (Rho-dextran) time point. P values were calculated using two-way ANOVA (e,f,j,l,n,p) and three-way repeated measures mixed-effects model with Tukey’s post hoc test for multiple comparison (q). Data are presented as mean ± s.e.m. Scale bars, 400 μm (cd,i,k) and 1 mm (m,o).
Fig. 7
Fig. 7. AAV-VC induced dLV expansion does not affect Aβ deposits in brain or dura mater in APdE9 mice.
Comparison of littermate AAV-Mock and AAV-VC-treated i.c.m. (male) and i.c.v. (female) injected WT and APdE9 mice at 9 months of age. aj, Combined analysis of D54D2 staining (red), including Aβ %, Aβ particle count and Aβ particle average size quantification of i.c.v.- and i.c.m.-injected mice in (ae) HC (n = 12, 14, 13 and 13) and (fj) cortex (n = 13, 14, 13 and 13). km, Representative images of podocalyxin (cyan) and D54D2 (white) staining in dorsal skull areas. Yellow arrowheads point to areas where D54D2+ Aβ deposits colocalize with podocalyxin+ veins connecting to large dural sinuses. Pineal gland was excised in (k,m) to visualize all blood vessels. n, Quantification of D54D2 area % of dorsal dura mater visualized in k (n = 12 and 11 combined from n = 6 and 5 for i.c.v. and n = 6 and 6 for i.c.m.). oq, Comparison of podocalyxin (cyan) staining in dorsal dura mater (n = 3, 3, 3 and 3) (o,p) and in HC (n = 12 and 13) (q). Data shown are representative of at least two independent experiments using littermate mice. Data points shown in graphs represent individual mice. Brain Aβ and podocalyxin values represent an average of five brain sections (210 mm apart) per mouse. Brain Aβ and podocalyxin as well as dura mater Aβ values are normalized to the average of APdE9-Ctrl group in every experimental set. P values were calculated using unpaired two-tailed t-test (a,f,n,q) and two-way ANOVA with Tukey’s post hoc test for multiple comparisons (ac,fh,p). Data are presented as mean ± s.e.m. Scale bars, 400 μm (n), 500 μm (d,e,i,j), 1 mm (l,m) and 2 mm (k).

References

    1. De Strooper B, Karran E. The cellular phase of Alzheimer’s disease. Cell. 2016;164:603–615. - PubMed
    1. Heneka MT, et al. Neuroinflammation in Alzheimer’s disease. Lancet Neurol. 2015;14:388–405. - PMC - PubMed
    1. Jack CR, Jr, et al. Tracking pathophysiological processes in Alzheimer’s disease: an updated hypothetical model of dynamic biomarkers. Lancet Neurol. 2013;12:207–216. - PMC - PubMed
    1. Hardy J, Selkoe DJ. The amyloid hypothesis of Alzheimer’s disease: progress and problems on the road to therapeutics. Science. 2002;297:353–356. - PubMed
    1. Zlokovic BV. Neurovascular pathways to neurodegeneration in Alzheimer’s disease and other disorders. Nat Rev Neurosci. 2011;12:723–738. - PMC - PubMed

LinkOut - more resources