

Characterization of white matter hyperintensities in Down syndrome
- PMID: 39087352
- PMCID: PMC11497714
- DOI: 10.1002/alz.14146
Characterization of white matter hyperintensities in Down syndrome
Abstract
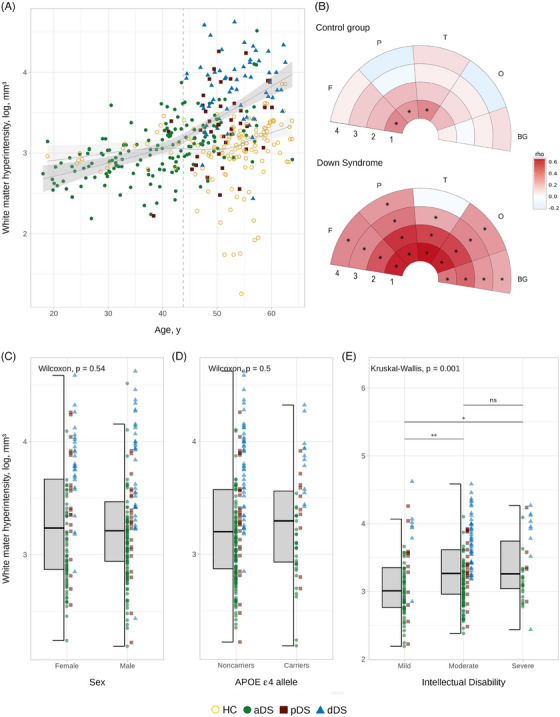
Introduction: In Down syndrome (DS), white matter hyperintensities (WMHs) are highly prevalent, yet their topography and association with sociodemographic data and Alzheimer's disease (AD) biomarkers remain largely unexplored.
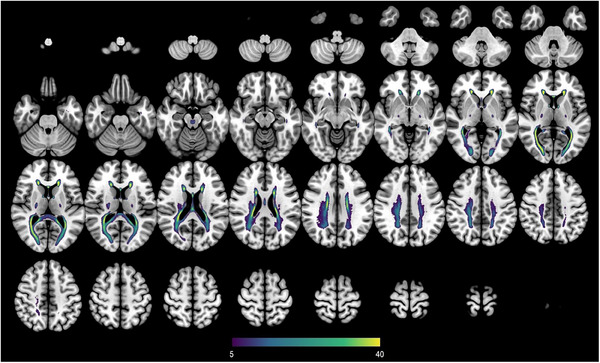
Methods: In 261 DS adults and 131 euploid controls, fluid-attenuated inversion recovery magnetic resonance imaging scans were segmented and WMHs were extracted in concentric white matter layers and lobar regions. We tested associations with AD clinical stages, sociodemographic data, cerebrospinal fluid (CSF) AD biomarkers, and gray matter (GM) volume.
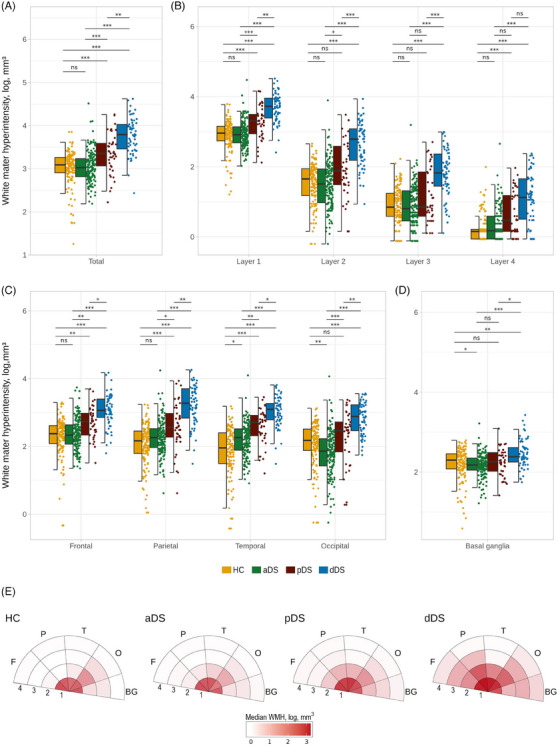
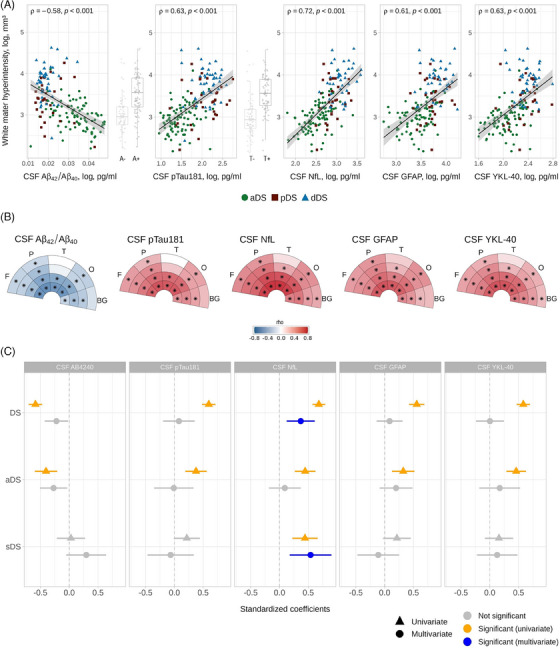
Results: In DS, total WMHs arose at age 43 and showed stronger associations with age than in controls. WMH volume increased along the AD continuum, particularly in periventricular regions, and frontal, parietal, and occipital lobes. Associations were found with CSF biomarkers and temporo-parietal GM volumes.
Discussion: WMHs increase 10 years before AD symptom onset in DS and are closely linked with AD biomarkers and neurodegeneration. This suggests a direct connection to AD pathophysiology, independent of vascular risks.
Highlights: White matter hyperintensities (WMHs) increased 10 years before Alzheimer's disease symptom onset in Down syndrome (DS). WMHs were strongly associated in DS with the neurofilament light chain biomarker. WMHs were more associated in DS with gray matter volume in parieto-temporal areas.
Keywords: Alzheimer's disease; Down syndrome; magnetic resonance imaging; neuroimaging; small vessel disease; white matter hyperintensities.
© 2024 The Author(s). Alzheimer's & Dementia published by Wiley Periodicals LLC on behalf of Alzheimer's Association.
Conflict of interest statement
MRA has provided paid consultancy for Veranex, and is a partner and director of production at Masima—Soluções em Imagens Médicas LTDA. MFI is now a paid employee of Altoida Inc. and may hold stock options in the company. The work in this manuscript only relates to the reported affiliation. DA reported receiving personal fees for advisory board services and/or speaker honoraria from Fujirebio‐Europe, Roche, Nutricia, Krka Farmacéutica, Lilly, Zambon S.A.U., Grifols, and Esteve, outside the submitted work. AL has served as a consultant or on advisory boards for Fujirebio‐Europe, Roche, Biogen, Grifols, Novartis, Eisai, Lilly, and Nutricia, outside the submitted work. JF reported serving on the advisory boards, adjudication committees, or speaker honoraria from Roche, NovoNordisk, Esteve, Biogen, Laboratorios Carnot, Adamed, LMI, Novartis, Lundbeck, Roche, AC Immune, Alzheon, Zambon, Lilly, Spanish Neurological Society, T21 Research Society, Lumind foundation, Jérôme‐Lejeune Foundation, Alzheimer's Association, National Institutes of Health USA, and Instituto de Salud Carlos III. DA, AL, and JF report holding a patent for markers of synaptopathy in neurodegenerative disease (licensed to ADx, EPI8382175.0). No other competing interests were reported. Author disclosures are available in the supporting information.
Figures
References
MeSH terms
Substances
Grants and funding
- GA 965422/Horizon 2020, "MES-CoBraD"
- CD20/00133/Instituto de Salud Carlos III and co-funded by the European Union through the Sara Borrell Postdoctoral Fellowship
- Jérôme Lejeune Foundation
- IIBSP-DOW-2020-151/Fundación Tatiana Pérez de Guzmán el Bueno
- RF1 AG061566/AG/NIA NIH HHS/United States
- RF1 AG056850/AG/NIA NIH HHS/United States
- R21AG056974/National Institutes of Health (NIH)
- H2020-SC1-BHC-2018-2020/Horizon 2020, "MES-CoBraD"
- AARG-22-923680/ALZ/Alzheimer's Association/United States
- Societat Catalana de Neurologia (Premi Beca Fundació SCN 2020)
- AARFD-21-852492/Alzheimer's Association Research Fellowship to Promote Diversity
- AG056850/National Institutes of Health (NIH)
- R21 AG056974/AG/NIA NIH HHS/United States
- GBHI_ALZ-18-543740/Alzheimer's Association and Global Brain Health Institute
- 3RF1AG056850-01S1/National Institutes of Health (NIH)
- PI20/01473/Instituto de Salud Carlos III and co-funded by the European Union
- 1R01AG056850-01A1/National Institutes of Health (NIH)
- PI22/00307/Instituto de Salud Carlos III and co-funded by the European Union
- PI18/00435/Instituto de Salud Carlos III and co-funded by the European Union
- CM21/00243/Instituto de Salud Carlos III and co-funded by the European Union through the Río Hortega Fellowship
- JDC2022-048492-I/Juan de la Cierva fellowship
- CP20/00038/Instituto de Salud Carlos III and co-funded by the European Union through the Miguel Servet Fellowship
- PI18/00335/Instituto de Salud Carlos III and co-funded by the European Union
- R01AG061566/National Institutes of Health (NIH)
- PI14/1561/Instituto de Salud Carlos III and co-funded by the European Union
- FI18/00275/Instituto de Salud Carlos III and co-funded by the European Union through the Predoctoral grant
- UNI/551/2021/Margarita Salas junior postdoctoral fellowship
- CM22/00219/Instituto de Salud Carlos III and co-funded by the European Union through the Río Hortega Fellowship
- PI20/01330/Instituto de Salud Carlos III and co-funded by the European Union
LinkOut - more resources
Full Text Sources
Medical
