. 2024 Jun 6;134(15):e165368.
doi: 10.1172/JCI165368.

GPR126 is a specifier of blood-brain barrier formation in the mouse central nervous system

Affiliations

GPR126 is a specifier of blood-brain barrier formation in the mouse central nervous system

Nikolaos Kakogiannos et al. J Clin Invest. .

Abstract

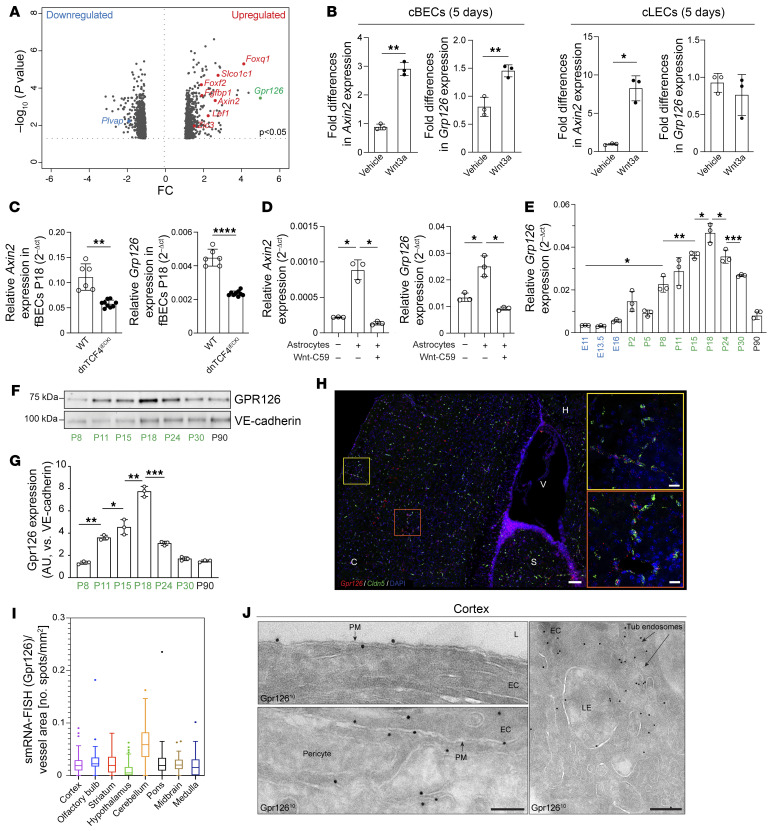
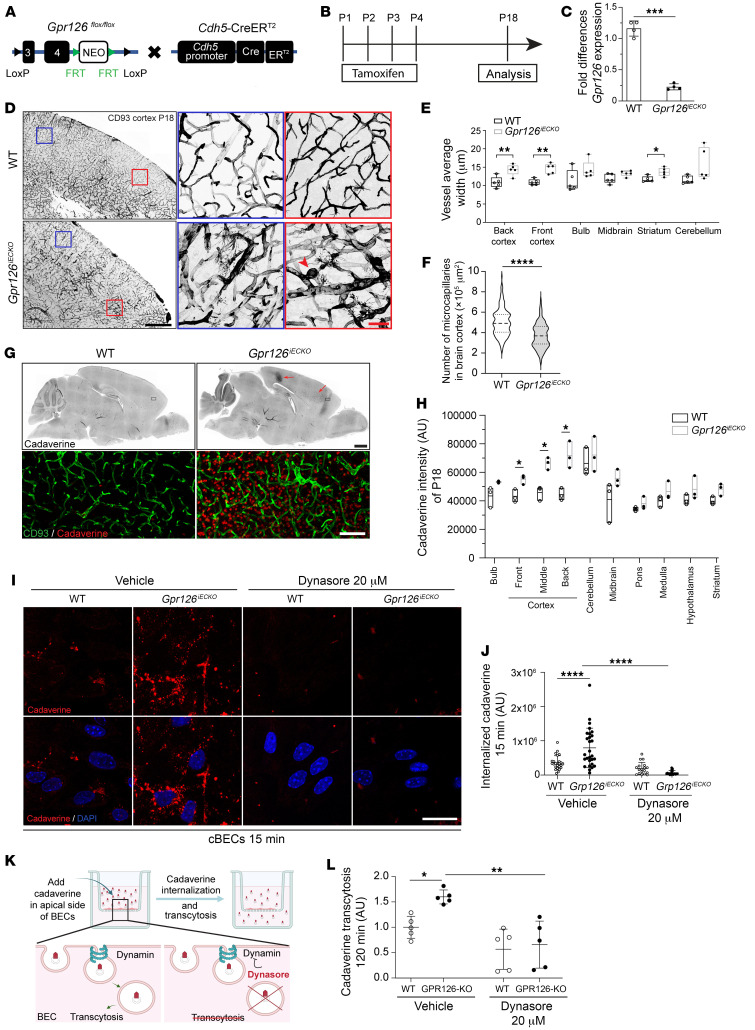
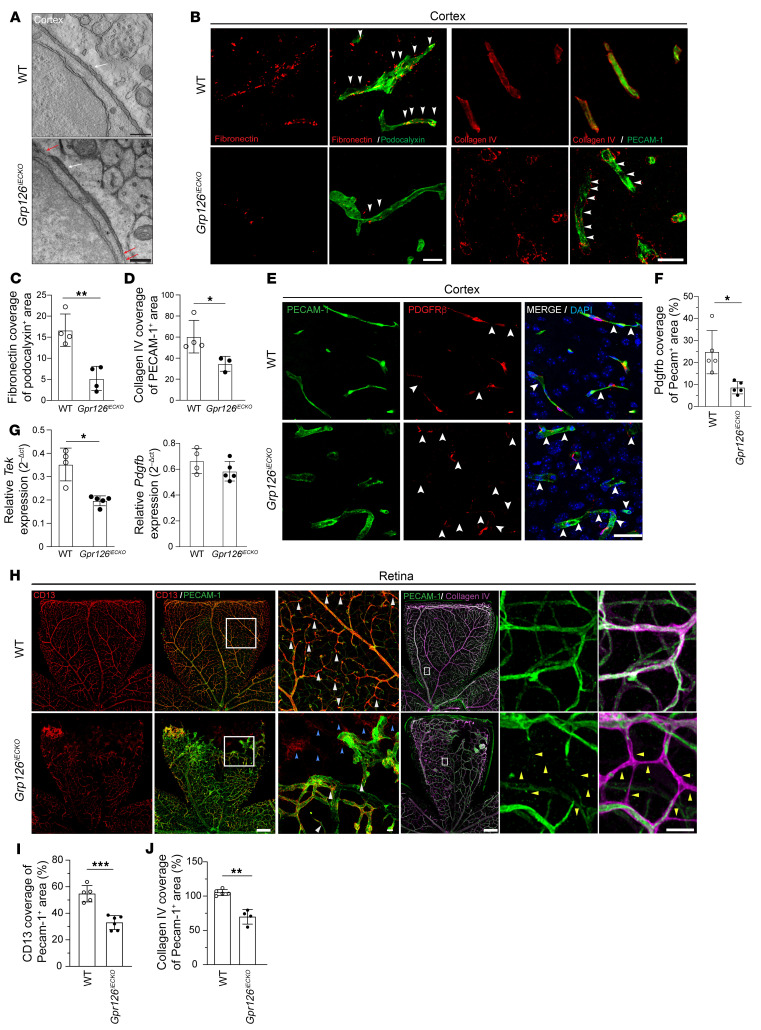
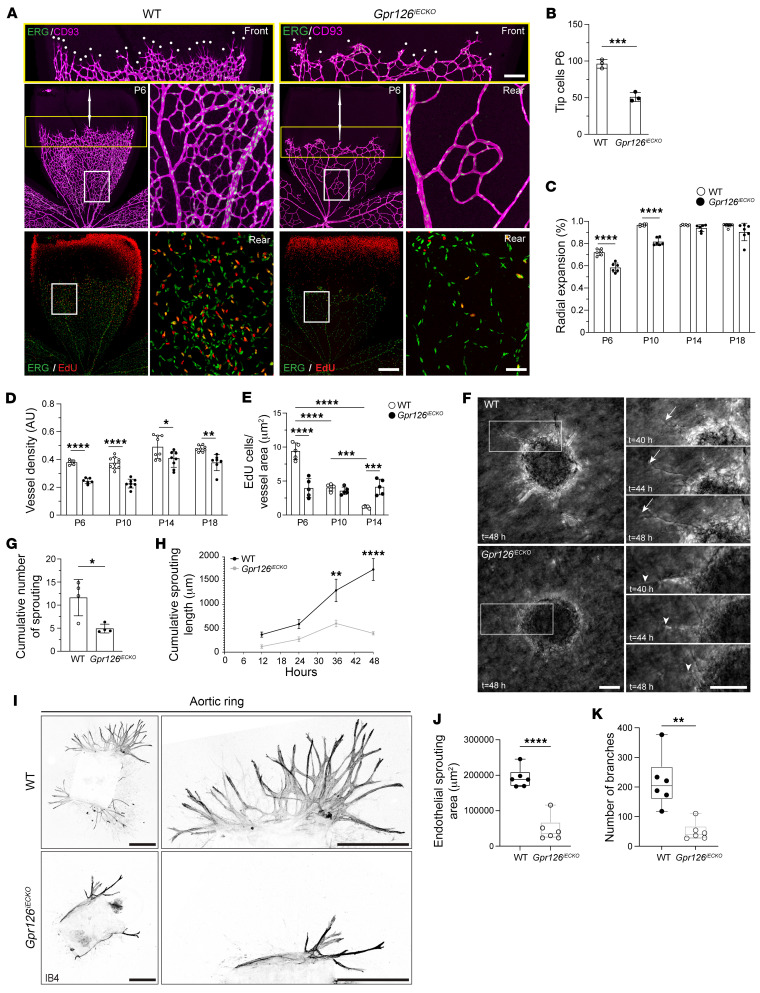
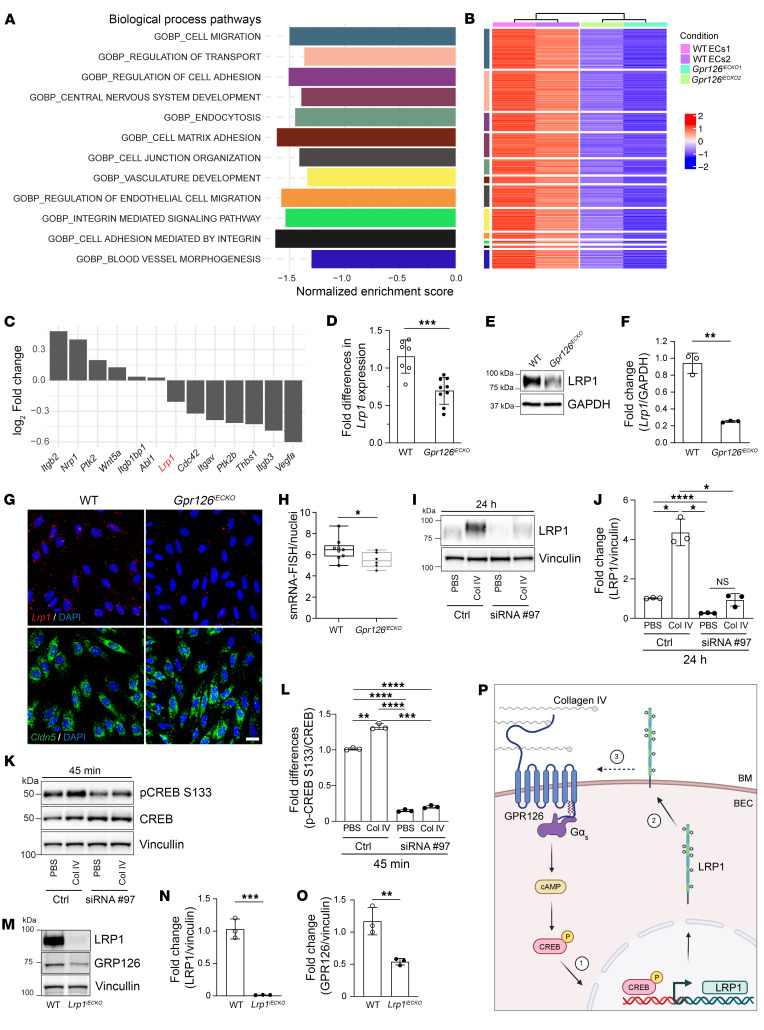
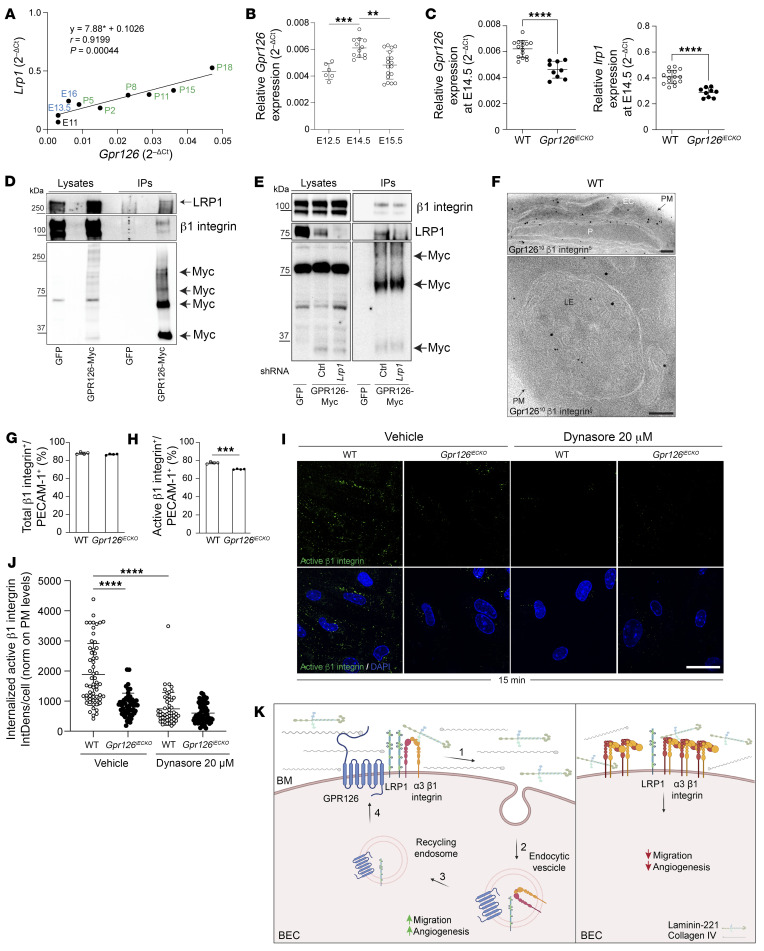
The blood-brain barrier (BBB) acquires unique properties to regulate neuronal function during development. The formation of the BBB, which occurs in tandem with angiogenesis, is directed by the Wnt/β-catenin signaling pathway. Yet the exact molecular interplay remains elusive. Our study reveals the G protein-coupled receptor GPR126 as a critical target of canonical Wnt signaling, essential for the development of the BBB's distinctive vascular characteristics and its functional integrity. Endothelial cell-specific deletion of the Gpr126 gene in mice induced aberrant vascular morphogenesis, resulting in disrupted BBB organization. Simultaneously, heightened transcytosis in vitro compromised barrier integrity, resulting in enhanced vascular permeability. Mechanistically, GPR126 enhanced endothelial cell migration, pivotal for angiogenesis, acting through an interaction between LRP1 and β1 integrin, thereby balancing the levels of β1 integrin activation and recycling. Overall, we identified GPR126 as a specifier of an organotypic vascular structure, which sustained angiogenesis and guaranteed the acquisition of the BBB properties during development.

Keywords: Angiogenesis; Cardiovascular disease; Endothelial cells; G protein–coupled receptors; Vascular biology.


Figures

Figure 1
Figure 1. GPR126 is a target of Wnt/β-catenin signaling and is expressed in brain vasculature during BBB development.
(A) Volcano plot showing transcriptional changes in cBECs exposed to Wnt3a-conditioned medium versus control for 5 days. Genes with significant alterations (P < 0.05) are depicted (Fisher’s least significant difference test). Red dots, upregulated gene targets of Wnt/β-catenin; blue dots, downregulated genes. Gpr126 is highlighted in green. (B) Real-time qPCR of Axin2 and Gpr126 expression in cBECs and cLECs from adult WT mice treated with recombinant Wnt3a or control. (C) Real-time qPCR of Axin2 and Gpr126 in fBECs from mice at P18 (n = 6 WT, n = 9 dnTCF4iECKI mice). (D) Real-time qPCR of Axin2 and Gpr126 in iBECs with or without primary neonatal astrocytes and treated with vehicle or Wnt-C59 (n = 3). (E) Real-time qPCR of Gpr126 expression in fBECs from WT mice during embryonic (E11–E16) and postnatal (P2–P30) stages and in the adult (P90) (n = 8 embryos, n = 5 postnatal, n = 3 adults). (F and G) Immunoblotting for GPR126 in fBECs from different postnatal stages and adulthood (P8–P30 and P90), quantified by GPR126/VE-cadherin ratios (n = 3 WT mice). (H and I) FISH confocal imaging for Gpr126 (red) and Cldn5 (green) mRNA in mouse cortex at P18, quantified by Gpr126 single-molecule RNA (smRNA) per vessel area (number of spots/μm2). Each symbol represents a field (3–4 fields per region, n = 4 WT mice). C, cortex; S, striatum; V, ventricle; H, hippocampus. (J) Electron microscopy of GPR126 immunogold-labeled (10 nm) cryosection of brain capillaries from WT mouse cortex at P18. Top: Luminal plasma membrane (PM). Bottom: Abluminal EC and pericyte plasma membrane (PM). Right: Late endosome (LE). L, lumen. Scale bars: 200 nm. Data are shown as means ± SD. (B and DG) Each symbol represents an experiment; Brown-Forsythe and Welch’s ANOVA, Dunnett’s T3 multiple-comparison tests. (B and C) Unpaired t tests with Welch’s correction. *P < 0.05; **P < 0.01; ***P < 0.001; ****P < 0.0001.
Figure 2
Figure 2. GPR126 is required for proper brain vasculature formation and function.
(A) Mice with Gpr126 exons 3 and 4 floxed with loxP sequences, containing a neomycin (NEO) cassette flanked by FRT sites (Gpr126fl/fl), were crossed with mice expressing CreERT2 under the Cdh5 promoter (Cdh5-CreERT2). (B) Tamoxifen-inducible Cre recombination (P1–P4) analyzed at P18. (C) Real-time qPCR of Gpr126 expression in BECs from tamoxifen-treated mice at P18 (n = 4 WT, n = 4 Gpr126iECKO). (D) Confocal images of CD93 in brain sections from WT and Gpr126iECKO mice at P18. Scale bar: 500 μm. Red and blue boxes: Magnified cortex regions. Red arrowhead, Gpr126iECKO mouse cortex vasculature tuft malformation. Scale bar: 50 μm. (E) Mean vessel width quantified in brain regions of mice shown in D (n = 5 WT, n = 5 Gpr126iECKO mice). (F) Microcapillary quantification per area in cortex of mice shown in D (n = 5 WT, n = 5 Gpr126iECKO). (G) Confocal images of cadaverine leakage in brain sections from WT and Gpr126iECKO mice at P18. Red arrows, leakage areas in the cortex. Scale bar: 1 mm. Bottom: Magnified cortex sections stained for CD93 (green) and cadaverine (red). Scale bar: 100 μm. (H) Cadaverine leakage fluorescence intensity (AU) in brain regions of mice shown in G (n = 3 WT, n = 3 Gpr126iECKO). (I) Confocal images of WT and Gpr126iECKO cBECs treated with Dynasore or vehicle. Red, cadaverine. Scale bar: 30 μm. (J) Internalized cadaverine fluorescence intensity (AU) in WT and Gpr126iECKO cBECs, as shown in I (n = 9 WT, n = 6 Gpr126iECKO). (K) Schematic illustration of Transwell assay evaluating cadaverine transcytosis across iBECs monolayer. (L) Cadaverine transcytosis quantification in WT and Gpr126iECKO iBECs, treated with Dynasore or vehicle (n = 5 WT, n = 5 Gpr126iECKO). Data are shown as means ± SD. (C, E, F, and H) Unpaired t tests with Welch’s correction; (E) bulb data, Mann-Whitney tests. (J and L) One-way ANOVA with Šidák’s multiple-comparison test, single pooled variance. *P < 0.05; **P < 0.01; ***P < 0.001; ****P < 0.0001.
Figure 3
Figure 3. GPR126 orchestrates BM protein deposition and ensures vascular pericyte coverage.
(A) Tomography slices of brain capillary longitudinal sections from WT and Gpr126iECKO mice at P18. White arrows, regular BM thickness; red arrows, interrupted or thin BM. See Supplemental Figure 5A for full image. Scale bars: 350 nm. (B) Confocal images of brain cortex cryosections from WT and Gpr126iECKO mice at P18. Vessels stained with podocalyxin or PECAM-1 (green), and BM with fibronectin or collagen IV (red). Arrowheads, protein colocalization and discontinuous collagen IV staining. See Supplemental Figure 5B for full image. Scale bars: 100 μm. (C and D) Quantification of fibronectin and collagen IV coverage in podocalyxin-positive and PECAM-1–positive areas, shown in B (n = 4 WT, n = 3–4 Gpr126iECKO mice). (E) Confocal images of brain cortex cryosections from WT and Gpr126iECKO mice at P18 show PECAM-1 (green, ECs) and PDGFR-β (red, pericytes). Arrowheads, discontinuous or absent PDGFR-β staining. Scale bar: 200 μm. (F) Quantification of PDGFR-β coverage in PECAM-1–positive areas, shown in E (n = 5 WT, n = 5 Gpr126iECKO mice). (G) Real-time qPCR of tek and Pdgfrb expression in fBECs (n = 4 WT, n = 5 Gpr126iECKO mice). (H) Confocal images of PECAM-1 (green, ECs), CD13 (red, pericytes), and collagen IV (magenta, BM) in WT and Gpr126iECKO retinas at P18. See Supplemental Figure 6A for the same field with different staining. Scale bars: 500 μm. Magnified insets show pericyte bodies, CD13 staining, and collagen IV structures without PECAM-1. Scale bars: 50 μm. (I) Quantification of CD13 coverage in PECAM-1–positive areas from images in H (n = 5 WT, n = 6 Gpr126iECKO retinas). (J) Quantification of collagen IV coverage in PECAM-1–positive areas, shown in H (n = 5 WT, n = 4 Gpr126iECKO mice). Data are shown as means ± SD, unpaired t tests with Welch’s correction. *P <0.05; **P <0.01; ***P <0.001.
Figure 4
Figure 4. GPR126 is required for angiogenesis in the retina and in the brain.
(A) Confocal images of CD93 (magenta, ECs), ERG (green, EC nuclei), and EdU (red, proliferation) in WT and Gpr126iECKO mouse retinas at P6 show retinal vessels at the petal, front, and rear regions. White dots highlight tip cells. Scale bars: petal, 500 μm; rear, 100 μm; front, 250 μm. (B) Tip cell quantification in the yellow rectangle in A (n = 3 WT, n = 3 Gpr126iECKO retinas). (C) Retinal vasculature radial expansion at P6, P10, P14, and P18 in WT and Gpr126iECKO mice (n = 6–8 WT, n = 6–7 Gpr126iECKO retinas). (D) Postnatal retinal vessel density (P6, P10, P14, P18) in WT and Gpr126iECKO mice (n = 5–10 WT, n = 6–9 Gpr126iECKO retinas). (E) EdU-positive ECs/μm2 of vessel area postnatally (P6, P10, P14, P14) in WT and Gpr126iECKO retinas (n = 5 WT, n = 5 Gpr126iECKO retinas). (F) Phase-contrast images of sprouting spheroids from fBECs of WT and Gpr126iECKO mice at P18 after stimulation with VEGF (80 ng/mL) and FGFb (50 ng/mL). Right: Magnified images at t = 40, 44, and 48 hours (for time-lapse, see Supplemental Video 1). Arrows, sprouting ECs; arrowheads, retracting ECs. Scale bars: 40 μm. (G) Cumulative sprouts per spheroid of WT (n = 16) and Gpr126iECKO (n = 16) fBECs. Each symbol represents an experiment (n = 4 WT, n = 4 Gpr126iECKO mice). (H) Cumulative sprouting lengths per spheroid of WT (n = 12) and Gpr126iECKO (n = 12) fBECs after 12, 24, 36, and 48 hours (n = 6 WT, n = 6 Gpr126iECKO mice). (I) Aortic rings from WT and Gpr126iECKO mice show vascular sprouts (magnified) via IB4 immunostaining. Scale bars: 500 μm. (J and K) Endothelial sprouting area (J) and branch numbers (K) as depicted in I (n = 6 WT, n = 6 Gpr126iECKO mice). Data are shown as means ± SD. (BD, G, J, and K) Unpaired t tests with Welch’s correction; (E and H) 2-way ANOVA. *P < 0.05; **P < 0.01; ***P < 0.001; ****P < 0.0001.
Figure 5
Figure 5. GPR126 modulates LRP1 expression levels.
(AC) RNA sequencing of fBECs from WT and Gpr126iECKO mice at P18. (A) Normalized enrichment scores from GSEA for differentially expressed genes in Gpr126iECKO (P ≤ 0.01, adjusted P ≤ 0.05, at least 30 altered genes). (B) Heatmap displaying z scores of leading-edge genes from GSEA for selected GO terms (n = 4 WT, n = 4 Gpr126iECKO mice per replicate). (C) Log2 fold change of selected genes differentially expressed in Gpr126iECKO. (D) Real-time qPCR of Lrp1 in fBECs (n = 7 WT, n = 9 Gpr126iECKO). (E and F) Immunoblotting for LRP1 in fBECs from WT and Gpr126iECKO mice at P18 (E) normalized over GAPDH (F) (n = 3 WT, n = 3 Gpr126iECKO). (G) FISH confocal images for Lrp1 (red) and Cldn5 (green) mRNA in cBECs from WT and Gpr126iECKO mice at P18. Scale bar: 20 μm. (H) Single-molecule RNA (smRNA) of Lrp1 per nucleus in G. Each symbol represents a field of 40 cells (n = 9 WT, n = 6 Gpr126iECKO). (I and J) Immunoblotting for LRP1 (I) normalized over vinculin (J) in cBECs transfected with control or Gpr126 siRNA and treated with collagen IV or PBS (I) (n = 6 WT mice). (K and L) Immunoblotting for total CREB and phospho-CREB S133 (K) normalized over vinculin (L) in cBECs treated as in I (n = 12 WT mice). (MO) Immunoblotting for LRP1 and GPR126 in cBECs from adult WT and Lrp1iECKO (M), normalized over vinculin (N and O) (n = 3 WT, n = 3 Lrp1iECKO). (P) GPR126 regulates LRP1 expression and vice versa. 1. Collagen IV–GPR126 interactions induce cAMP, phospho-CREB, and LRP1. 2. LRP1 localizes at the plasma membrane. 3. This supports GPR126 expression and signaling. Dashed arrow, undefined LRP1-mediated induction of GPR126. Data are shown as means ± SD. (F, J, K, N, and O) Each symbol represents an experiment. (D, F, H, N, and O) Unpaired t tests with Welch’s correction; (J and L) Brown-Forsythe and Welch’s ANOVA, Dunnett’s T3 multiple-comparison tests. *P < 0.05; **P < 0.01; ***P < 0.001; ****P < 0.0001.
Figure 6
Figure 6. GPR126 synergizes with LRP1 and β1 integrin to steer EC migration during angiogenesis.
(A) Pearson’s correlation analysis (r) of Lrp1 and Gpr126 mRNA in fBECs from WT mice at embryonic (E11–E16) and postnatal (P2–P18) stages. (B) Real-time qPCR of Gpr126 in fBECs at E12.5, E14.5, and E15.5 (n = 6 E12.5, n = 12 E14.5, n = 18 E15.5; Brown-Forsythe and Welch’s ANOVA, Dunnett’s T3 multiple-comparison tests). (C) Real-time qPCR of Gpr126 and Lrp1 in fBECs at E14.5 (n = 15 WT, n = 9 Gpr126iECKO). (D and E) Immunoblotting for LRP1, β1 integrin, and Myc in iBECs transfected with GFP or GPR126-Myc (D) and infected with control shRNA (Ctrl) and shRNA against Lrp1 (E). Lysates were immunoprecipitated (IP) with anti-rabbit-Myc agarose (D) or with anti-mouse-Myc agarose (E). GFP-transfected iBECs were used as IP controls. Data represent 3 independent experiments. (F) Immunogold for GPR126 (10 nm) and β1 integrin (5 nm) in cortical capillaries from WT mouse at P18. PM, plasma membrane; P, pericyte; LE, late endosome. Scale bars: 100 nm. (G and H) Percentage of total β1 integrin–positive (G) and active β1 integrin–positive (H) fBECs (gated as PECAM-1+ cells) isolated from WT and Gpr126iECKO mice at P18 and analyzed by flow cytometry (n = 3 WT, n = 3 Gpr126iECKO). (I and J) Internalized active β1 integrin (I) and single-cell fluorescence intensity (J) measured in Dynasore- or vehicle-treated cBECs from WT and Gpr126iECKO (n = 9 WT, n = 6 Gpr126iECKO; 1-way ANOVA, Šidák’s multiple-comparison test, assuming a single pooled variance). IntDens, integrated density. Scale bar: 30 μm. (K) GPR126 complex dynamic. Left: GPR126 binds LRP1 and α3β1 upon collagen IV induction (step 1). LRP1-mediated endocytosis promotes EC migration and angiogenesis (step 2). Recycling endosomes (step 3) restore LRP1 and GPR126 to the PM (step 4). Right: Absence of GPR126 decreases BM deposition and LRP1 expression. α3β1 Integrin is not internalized, reducing migration and angiogenesis. Data are shown as means ± SD. (C, G, and H) Unpaired t tests with Welch’s correction. **P < 0.01; ***P < 0.001; ****P < 0.0001.

References

    1. Abbott NJ, et al. Astrocyte-endothelial interactions at the blood-brain barrier. Nat Rev Neurosci. 2006;7(1):41–53. doi: 10.1038/nrn1824. - DOI - PubMed
    1. Zlokovic BV. Neurovascular pathways to neurodegeneration in Alzheimer’s disease and other disorders. Nat Rev Neurosci. 2011;12(12):723–738. doi: 10.1038/nrn3114. - DOI - PMC - PubMed
    1. Berndt P, et al. Tight junction proteins at the blood-brain barrier: far more than claudin-5. Cell Mol Life Sci. 2019;76(10):1987–2002. doi: 10.1007/s00018-019-03030-7. - DOI - PMC - PubMed
    1. Greene C, Campbell M. Tight junction modulation of the blood brain barrier: CNS delivery of small molecules. Tissue Barriers. 2016;4(1):e1138017. doi: 10.1080/21688370.2015.1138017. - DOI - PMC - PubMed
    1. Stamatovic SM, et al. Junctional proteins of the blood-brain barrier: new insights into function and dysfunction. Tissue Barriers. 2016;4(1):e1154641. doi: 10.1080/21688370.2016.1154641. - DOI - PMC - PubMed

MeSH terms

Substances