. 2024 Aug 1;148(1):14.
doi: 10.1007/s00401-024-02762-6.

The parkin V380L variant is a genetic modifier of Machado-Joseph disease with impact on mitophagy

Collaborators, Affiliations

The parkin V380L variant is a genetic modifier of Machado-Joseph disease with impact on mitophagy

Jonasz J Weber et al. Acta Neuropathol. .

Abstract

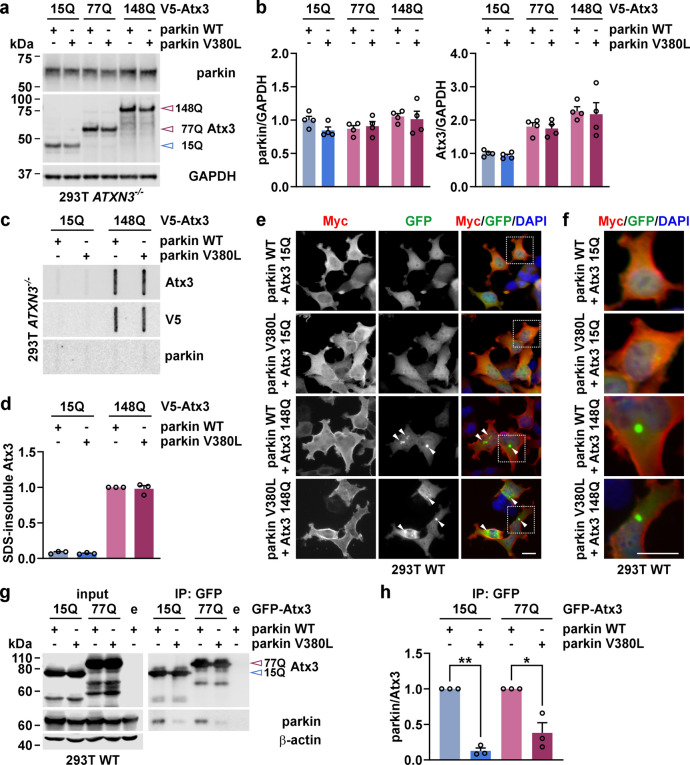
Machado-Joseph disease (MJD) is an autosomal dominant neurodegenerative spinocerebellar ataxia caused by a polyglutamine-coding CAG repeat expansion in the ATXN3 gene. While the CAG length correlates negatively with the age at onset, it accounts for approximately 50% of its variability only. Despite larger efforts in identifying contributing genetic factors, candidate genes with a robust and plausible impact on the molecular pathogenesis of MJD are scarce. Therefore, we analysed missense single nucleotide polymorphism variants in the PRKN gene encoding the Parkinson's disease-associated E3 ubiquitin ligase parkin, which is a well-described interaction partner of the MJD protein ataxin-3, a deubiquitinase. By performing a correlation analysis in the to-date largest MJD cohort of more than 900 individuals, we identified the V380L variant as a relevant factor, decreasing the age at onset by 3 years in homozygous carriers. Functional analysis in an MJD cell model demonstrated that parkin V380L did not modulate soluble or aggregate levels of ataxin-3 but reduced the interaction of the two proteins. Moreover, the presence of parkin V380L interfered with the execution of mitophagy-the autophagic removal of surplus or damaged mitochondria-thereby compromising cell viability. In summary, we identified the V380L variant in parkin as a genetic modifier of MJD, with negative repercussions on its molecular pathogenesis and disease age at onset.

Keywords: PRKN; Aggregation; Polyglutamine disease; SCA3; SNP; Spinocerebellar ataxia type 3.


Conflict of interest statement

The authors have no relevant financial or non-financial interests to disclose.

Figures

Fig. 1
Fig. 1
Characterization of the SNP rs1801582 in exon 10 of the PRKN gene in MJD patients and the influence of the different genotypes on the AAO. a The PRKN gene contains 12 exons and 11 introns. Among others, three SNPs within its coding region lead to amino acid changes in the encoded parkin protein: the G/A polymorphism rs1801474 in exon 4 leads to a serine to asparagine (S167N) change in the really-interesting-new-gene domain 0 (RING0) domain, rs1801582 (G/C) in exon 10 causes a valine to leucine (V380L) change in a region between the in-between-ring (IBR)-domain and the repressor element of parkin (REP); and rs1801334 (G/A) in exon 11 leads to an aspartic acid to asparagine (D394N) change in the repressor element. Ubl, ubiquitin-like domain. b Determination of genotype frequencies in a small pilot cohort of European MJD patients (sample numbers marked with an *) confirmed the expectedly low minor allele frequency for both rs1801474 in PRKN exon 4 and rs1801334 in PRKN exon 11. Analysis of the entire MJD cohort of 808 evaluable patient samples revealed robust frequencies for all genotypes of rs1801582 in PRKN exon 10. c Violin plots illustrate distribution of CAG repeat numbers per PRKN SNP rs1801582 genotype in 808 analysed MJD patients. No significant difference in the distributions was detected (P = 0.212). Dashed white lines indicate the median, and dotted white lines the 25% and 75% percentile, respectively. d Violin plots show the distribution of age at onset (AAO) per PRKN SNP rs1801582 genotype in 808 analysed MJD patients. A significant genotype effect (P = 0.035) was detected, with the AAO being significantly lower in the genotype C/C compared to G/G (*P = 0.040). After applying a family factor to account for related samples, a two-tailed Kruskal–Wallis test was performed, followed by a Steel–Dwass all pairs analysis for pair-wise comparison. Dashed white lines indicate the median, and dotted white lines the 25% and 75% percentile, respectively. e Multivariate linear regression analysis. The expected inverse correlation between CAG repeats and AAO was confirmed (P < 0.0001). f In an additive model of multivariate linear regression, the AAO for genotype C/C was approximately 3 years earlier than for the other two genotypes. However, the effect of the polymorphism alone did not reach statistical significance (P = 0.240). g In an interactive model of multivariate linear regression, a higher CAG repeat length in combination with the C/C genotype had a stronger impact on the AAO in patients, with the interaction between the polymorphism and the CAG repeat length being statistically significant (P = 0.043)
Fig. 2
Fig. 2
Parkin V380L does not influence soluble or insoluble ataxin-3 levels but reduces ataxin-3 binding. a Western blotting of 293T ATXN3−/− cells co-expressing V5-Atx3 15Q, 77Q, or 148Q and 6xMyc-parkin WT or V380L. Membranes were detected with antibodies against respective proteins, revealing that parkin variants do not affect ataxin-3 protein levels and vice versa. GAPDH served as loading control. b Densitometric quantification of parkin and ataxin-3 levels, normalised to GAPDH. All values were additionally normalised to the mean of the control group Atx3 15Q/parkin WT. n = 4. Bars represent mean + s.e.m. c Filter retardation analysis of 293T ATXN3−/− cells expressing parkin WT or V380L in combination with V5-Atx3 15Q and 148Q. SDS-insoluble protein species were detected using ataxin-3- and V5-tag-specific antibodies. Membranes were additionally stained with an antibody against parkin. Ataxin-3 aggregate levels remain unaltered upon overexpression of parkin variants. d Densitometric quantification of SDS-insoluble ataxin-3. Within each experimental replicate, values were additionally normalized to the Atx3 148Q/parkin WT control. n = 3. Bars represent mean + s.e.m. e Epi-fluorescence microscopy of 293T WT cells, co-transfected with 6xMyc-parkin WT or V380L and GFP-Atx3 15Q or 148Q. Parkin was detected using a Myc tag-specific antibody (red), while ataxin-3 was visualised via its GFP tag (green). DAPI was used as a nuclear counterstain (blue). Parkin variants do not alter the appearance of ataxin-3 aggregates (indicated by white arrowheads) and show no colocalization with them. f Magnifications of areas marked with white dashed boxes in e. g Western blotting of immunoprecipitated GFP-Atx3 15Q or 148Q co-expressed with 6xMyc-tagged parkin WT and V380L in 293T WT cells using a GFP-Trap approach. Immunoprecipitated GFP-Atx3 and co-precipitated parkin were detected using target-specific antibodies. Co-immunoprecipitation analysis shows reduced binding of parkin V380L with both wild-type and polyQ-expanded ataxin-3. β-actin served as loading control. h Densitometric quantification of co-precipitated parkin. Within each experimental replicate, values were normalised to Atx3 15Q/parkin WT or Atx3 70Q/parkin WT. n = 3. Bars represent mean + s.e.m. One sample t-test (comparisons to the respective control group Atx3 15Q/parkin WT or Atx3 70Q/parkin WT); *P ≤ 0.05; **P ≤ 0.01. Blue-rimmed arrowhead indicates ataxin-3 15Q and purple-rimmed arrowhead shows ataxin-3 77Q or 148Q. e = GFP empty vector. Scale bars = 20 µm
Fig. 3
Fig. 3
Parkin V380L perturbs mitophagy-linked degradation of mitochondrial proteins. a Epi-fluorescence microscopy of 293T WT cells, transfected with 6xMyc-parkin WT or V380L and treated with different concentrations of CCCP for 24 h. Mitochondria were visualised by co-expressing DsRed2-Mito (red). Cells overexpressing parkin WT or V380L show a CCCP concentration-dependent fragmentation and loss of mitochondria. DAPI was used as a nuclear counterstain (blue). Magnifications of areas marked with white dashed boxes can be found in Supplementary Fig. S8a. Scale bar = 5 µm. b Confocal microscopy of 293T WT cells co-expressing DsRed2-Mito (red) and 6xMyc-parkin WT or V380L, and treated with 50 µM CCCP for 24 h. DAPI was used as a nuclear counterstain (blue). Scale bar = 5 µm. c Western blotting of 293T WT cells expressing 6xMyc-parkin WT or V380L, or transfected with an empty vector (e), and treated with various CCCP concentrations 24 h prior to harvest. Membranes were probed with antibodies against parkin, mitofusin-2 (MFN2), and voltage-dependent anion channel 1 (VDAC1), and demonstrate that mitophagy induction using CCCP shows a concentration-dependent ubiquitination and lowering of overexpressed parkin and other mitochondrial marker proteins. GAPDH served as loading control. White arrowheads indicate full-length, unmodified protein forms. Grey arrowheads show ubiquitinated (Ub) forms of VDAC1. Brackets mark Ub-parkin. SE, short exposure, LE, long exposure. d Western blotting of 293T WT cells expressing 6xMyc-parkin WT or V380L, or transfected with an empty vector (e), and treated with 12.5 µM CCCP 24 h prior to harvest. Cells were additionally incubated with proteasome inhibitor MG132 or autophagy inhibitor bafilomycin A1 (BafA1). Membranes were probed with antibodies against parkin, PINK1, mitofusin-2 (MFN2), optic atrophy protein 1 (OPA1), dynamin 1-like protein (DNM1L), voltage-dependent anion channel 1 (VDAC1), or translocase of inner mitochondrial membrane 50 (TIM50), demonstrating that parkin V380L aggravates loss of certain mitochondrial marker proteins upon CCCP-induced mitophagy. Successful treatment with MG132 or BafA1 was monitored by detecting K48-polyubiquitin chains (K48-pUb) and LC3B-II. GAPDH served as loading control. White arrowheads indicate full-length (fl)/long (L) forms of PINK1, MFN2 or OPA1 as well as LC3B-I (I). Grey arrowhead points to ubiquitinated (Ub) MFN2. Black arrowheads show cleaved/short (S) forms of PINK1 or OPA1 as well as LC3B-II (II). e Densitometric quantification of protein levels upon CCCP treatment, normalised to GAPDH. Ub-MFN2 was normalised to fl-MFN2. Within each experimental replicate, values were additionally normalized to the parkin WT/+CCCP control. n = 3–6. Bars represent mean + s.e.m. One sample t-test; *P ≤ 0.05; **P ≤ 0.01; ns not significant
Fig. 4
Fig. 4
Parkin V380L-induced disturbances in mitophagy persist upon expression of polyQ-expanded ataxin-3, leading to increased cell death markers. a Western blotting of 293T ATXN3−/− cells co-expressing V5-Atx3 15Q or 148Q and 6xMyc-parkin WT or V380L, treated with 12.5 µM CCCP 24 h prior harvest. Membranes were probed with antibodies against ataxin-3, parkin, MFN2, VDAC1, OPA1, and TIM50. Upon mitophagy induction, increased parkin V380L-linked loss of mitochondrial markers is alleviated by co-expression of wild-type ataxin-3, while the effects persist in presence of the polyQ-expanded protein. GAPDH served as loading control. Blue-rimmed arrowhead indicates ataxin-3 15Q and purple-rimmed arrowhead shows ataxin-3 148Q. Black arrowhead shows short (S) form of OPA1. b Densitometric quantification of protein levels upon CCCP treatment, normalised to GAPDH. Within each experimental replicate, values were additionally normalised to the control Atx3 15Q/parkin WT/+CCCP. n = 4. Bars represent mean + s.e.m. One sample t-test (comparisons to the control group) or one-way ANOVA (comparisons between the other groups); *P ≤ 0.05; **P ≤ 0.01. c Western blot analysis of poly [ADP-ribose] polymerase 1 (PARP1) and ɑ-spectrin cleavage as cell death markers. White arrowheads indicate full-length (fl) PARP1 or fl-ɑ-spectrin. Black arrowheads show the apoptosis-associated p89 cleavage product of PARP1 and ɑ-spectrin breakdown products at 150 kDa (150) and 120 kDa (120). Elevated levels of caspase cleavage-derived PARP1 p89 and 120-kDa-ɑ-spectrin occur in parkin V380L and polyQ-expanded but not wild-type ataxin-3 co-expressing cells upon mitophagy induction. GAPDH served as loading control. SE, short exposure, LE, long exposure. d Densitometric quantification of apoptosis-associated PARP1 p89 and 120-kDa-ɑ-spectrin levels upon CCCP treatment, both normalised to the respective full-length protein. Within each experimental replicate, values were additionally normalised to the control Atx3 15Q/parkin WT/+CCCP. n = 3–4. Bars represent mean + s.e.m. One sample t-test (comparisons to the control group) or one-way ANOVA (comparisons between the other groups); *P ≤ 0.05
Fig. 5
Fig. 5
Parkin V380L further compromises viability of cells expressing polyQ-expanded ataxin-3 upon induction of mitophagy. a FACS-based cell death analysis of 293T WT cells co-expressing V5-Atx3 15Q or 148Q and 6xMyc-parkin WT or V380L, treated with 12.5 µM CCCP for 24 h prior assessment. Dead cells were stained using 7-aminoactinomycin D (7-AAD). Representative density plots and percentages for the population of dead cells for one experimental replicate are shown. Spectrally compensated signals for 7-AAD in the PerCP channel (Comp-PerCP 7-AAD) were plotted against the forward-scatter area (FSC-A). b Mean percentages of alive and dead cells are shown. Bars represent mean values of n = 3 biological replicates. c Fold changes of 7-AAD-positive (7-AAD+) cells were calculated within each experimental replicate by normalising the values to the control Atx3 15Q/parkin WT/+CCCP. Cells co-expressing parkin V380L and polyQ-expanded ataxin-3 show an increase in cell death upon CCCP administration. n = 3. Bars show mean + s.e.m. One sample t-test (comparisons to the control group) or one-way ANOVA (comparisons between the other groups); *P ≤ 0.05. d Resazurin-based viability analysis of 293T ATXN3−/− cells co-expressing V5-Atx3 15Q or 148Q and 6xMyc-parkin WT or V380L, treated with 12.5 µM CCCP for 24 h prior assessment. Within each experimental replicate, values were additionally normalised to the control Atx3 15Q/parkin WT/+CCCP. Cells co-expressing parkin V380L and polyQ-expanded ataxin-3 show a reduced cell viability upon CCCP administration. n = 4. Bars represent mean + s.e.m. One sample t-test (comparisons to the control group) or one-way ANOVA (comparisons between the other groups); *P ≤ 0.05. e Schematic summary and suggested pathological model based on observed effects of parkin V380L in MJD. In healthy cells, interactors parkin and ataxin-3 are involved in the basic maintenance of mitochondria, showing a balance between their E3 ubiquitin ligase and deubiquitinase activities. In MJD, mitochondria become compromised by mutant ataxin-3 (mut Atx3), undergoing mitophagy, which is mediated by parkin recruitment, polyubiquitination (pUb) of substrates such as MFN2 and VDAC1, and trimming by ataxin-3. In case of parkin V380L, reduced interaction with ataxin-3 leads to unbalanced polyubiquitination of mitochondrial substrates and thereby excessive mitophagy with negative consequences on neuronal viability. ER, endoplasmic reticulum; mito, mitochondrion

References

    1. Aguirre JD, Dunkerley KM, Lam R, Rusal M, Shaw GS (2018) Impact of altered phosphorylation on loss of function of juvenile Parkinsonism-associated genetic variants of the E3 ligase parkin. J Biol Chem 293:6337–6348. 10.1074/jbc.RA117.000605 10.1074/jbc.RA117.000605 - DOI - PMC - PubMed
    1. Akçimen F, Martins S, Liao C, Bourassa CV, Catoire H, Nicholson GA et al (2020) Genome-wide association study identifies genetic factors that modify age at onset in Machado–Joseph disease. Aging (Albany NY) 12:4742–4756. 10.18632/aging.102825 10.18632/aging.102825 - DOI - PMC - PubMed
    1. Baker MJ, Lampe PA, Stojanovski D, Korwitz A, Anand R, Tatsuta T et al (2014) Stress-induced OMA1 activation and autocatalytic turnover regulate OPA1-dependent mitochondrial dynamics. EMBO J 33:578–593. 10.1002/embj.201386474 10.1002/embj.201386474 - DOI - PMC - PubMed
    1. Beasley SA, Hristova VA, Shaw GS (2007) Structure of the Parkin in-between-ring domain provides insights for E3-ligase dysfunction in autosomal recessive Parkinson’s disease. Proc Natl Acad Sci USA 104:3095–3100. 10.1073/pnas.0610548104 10.1073/pnas.0610548104 - DOI - PMC - PubMed
    1. Bettencourt C, Raposo M, Kazachkova N, Cymbron T, Santos C, Kay T et al (2011) The APOE ε2 allele increases the risk of earlier age at onset in Machado–Joseph disease. Arch Neurol 68:1580–1583. 10.1001/archneurol.2011.636 10.1001/archneurol.2011.636 - DOI - PubMed

Publication types

LinkOut - more resources