

Sociodemographic Trends and Perinatal Outcomes in Fathers 50 Years and Older
- PMID: 39088214
- PMCID: PMC11294967
- DOI: 10.1001/jamanetworkopen.2024.25269
Sociodemographic Trends and Perinatal Outcomes in Fathers 50 Years and Older
Abstract
Importance: The age of fathers at childbirth is rising, with an increasing number of births attributed to older fathers. While the impact of advanced paternal age has been documented, sociodemographic data about fathers aged 50 years and older remain scarce.
Objectives: To explore sociodemographic and temporal trends among the oldest US fathers (age ≥50 years) and their associations with perinatal outcomes.
Design, setting, and participants: This retrospective cross-sectional study included data from all US births from 2011 to 2022 using the National Vital Statistics System. Data were analyzed from August 2023 and May 2024.
Exposures: Reported paternal age at childbirth.
Main outcomes and measures: Outcomes of interest were sociodemographic factors, temporal trends in older fatherhood, and perinatal outcomes, including preterm birth, low birth weight, gestational diabetes, gestational hypertension, assisted reproductive technology (ART), rates of maternal primiparity, and the infant sex ratio.
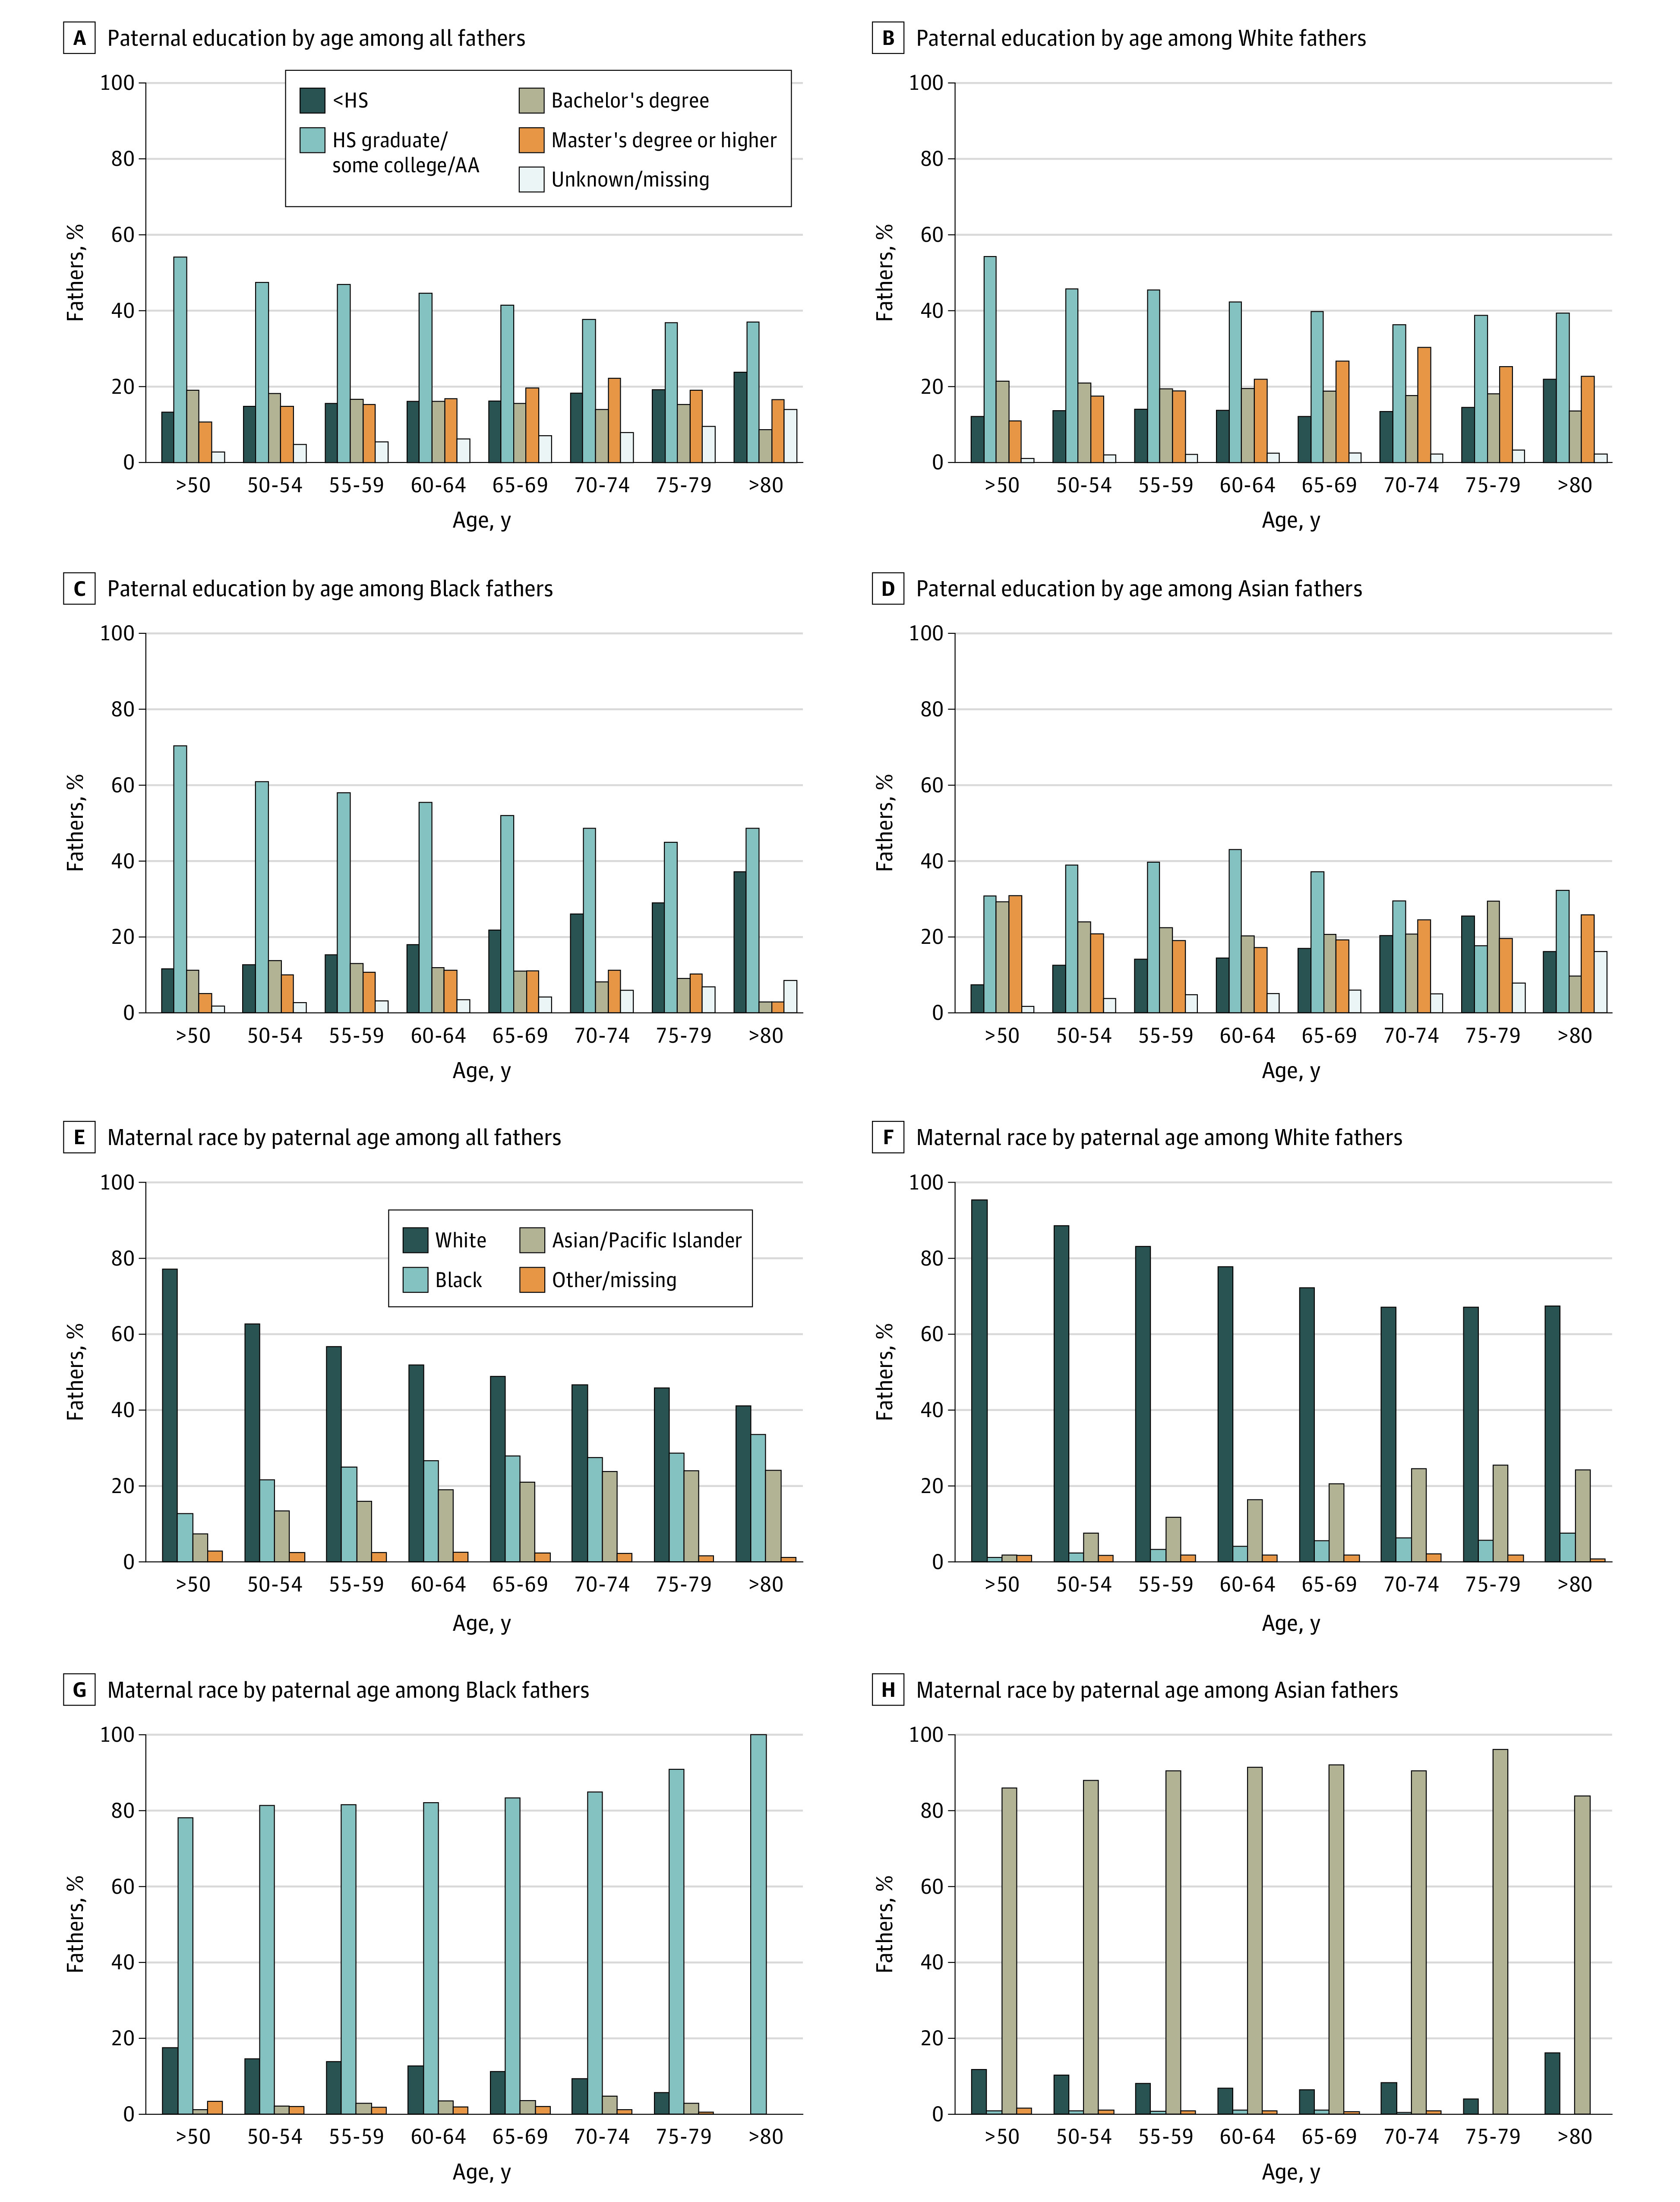
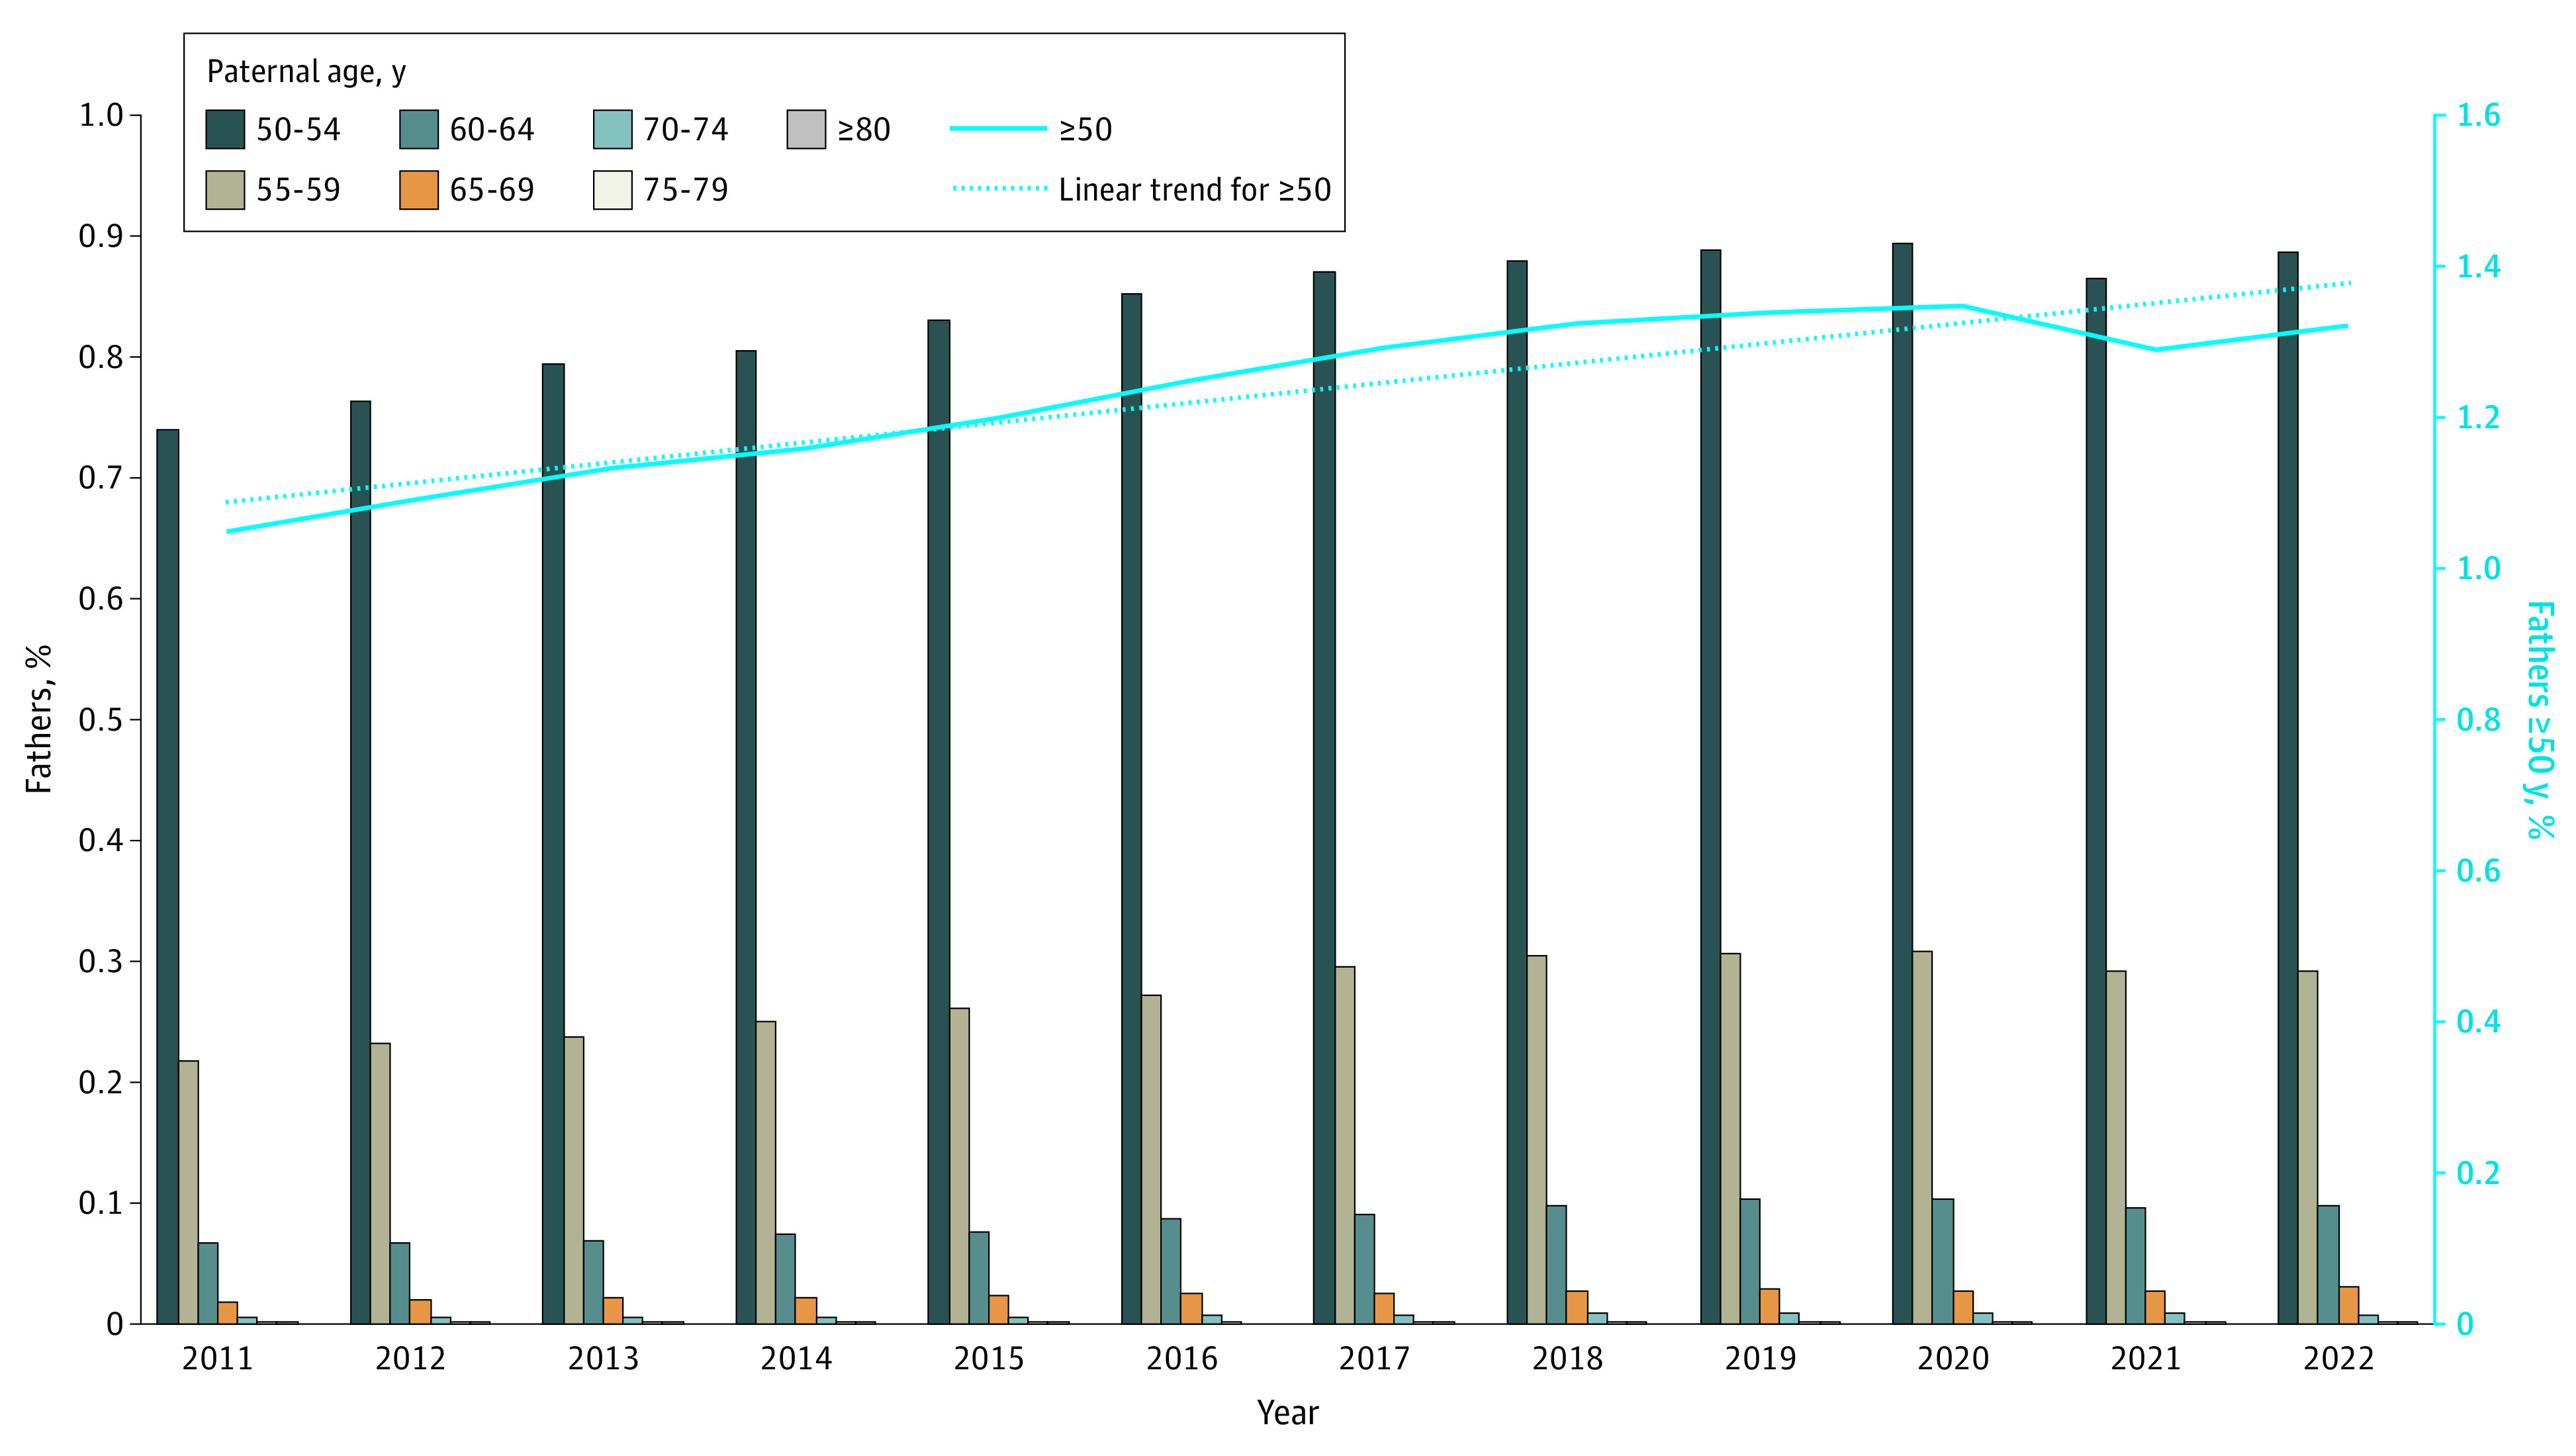
Results: From 2011 to 2022, the US recorded 46 195 453 births, with an overall mean (SD) paternal age of 31.5 (6.8) years and 484 507 (1.1%) involving fathers aged 50 years or older, 47 785 (0.1%) aged 60 years or older, and 3777 (0.008%) aged 70 years or older. Births to fathers aged 50 years or older increased from 1.1% in 2011 to 1.3% in 2022 (P for trend < .001). Fathers aged 50 years or older were more diverse, with variations in educational achievement and race and ethnicity. Marital status and maternal racial and ethnic and educational backgrounds also varied by paternal age and race. Despite controlling for maternal age and other sociodemographic and perinatal factors, every 10-year increase in paternal age was consistently associated with greater use of ART (eg, age 50-59 years: adjusted odds ratio [aOR], 2.23; 95% CI, 2.19-2.27), higher likelihood of first maternal birth (eg, age 50-59 years: aOR, 1.16; 95% CI, 1.15-1.17), and increased risks of preterm birth (eg, age 50-59 years: aOR, 1.16; 95% CI, 1.15-1.18) and low birth weight (eg, age 50-59 years: aOR, 1.14; 95% CI, 1.13-1.15) compared with fathers aged 30 to 39 years. No significant changes in the infant sex ratio were observed, except among fathers aged 70 years or older (aOR, 0.92; 95% CI, 0.86-0.99) and 75 years or older (aOR, 0.84; 95% CI, 0.73-0.97), who showed a decreased likelihood of having male offspring.
Conclusions and relevance: In this cross-sectional study of all US births from 2011 to 2022, the percentage attributed to older fathers, while small, increased. Notable variations in paternal and maternal race and education were identified. Older fatherhood was associated with increased ART use, first-time maternal births, adverse perinatal outcomes, and altered sex ratio. Further research of this population is crucial for improving patient counseling and family planning.
Conflict of interest statement
Figures
Comment in
-
Fathers in the United States Are Getting Older.JAMA Netw Open. 2024 Aug 1;7(8):e2428062. doi: 10.1001/jamanetworkopen.2024.28062. JAMA Netw Open. 2024. PMID: 39088220 No abstract available.
References
-
- Hamilton BE, Martin JA, Osterman MJ. Births: Provisional Data for 2019. Vital Statistics Rapid Release. May 2020. Accessed July 2, 2024. https://www.cdc.gov/nchs/data/vsrr/vsrr-8-508.pdf
MeSH terms
Grants and funding
LinkOut - more resources
Full Text Sources
