. 2024 Aug 1;134(18):e166271.
doi: 10.1172/JCI166271.

Exosomal TNF-α mediates voltage-gated Na+ channel 1.6 overexpression and contributes to brain tumor-induced neuronal hyperexcitability

Affiliations

Exosomal TNF-α mediates voltage-gated Na+ channel 1.6 overexpression and contributes to brain tumor-induced neuronal hyperexcitability

Cesar Adolfo Sanchez Trivino et al. J Clin Invest. .

Abstract

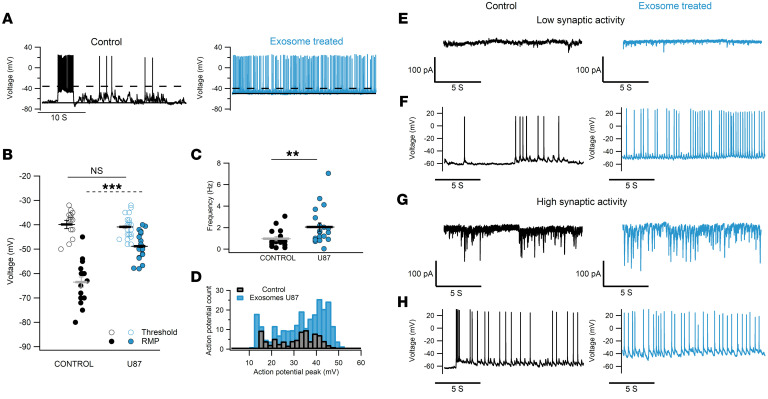
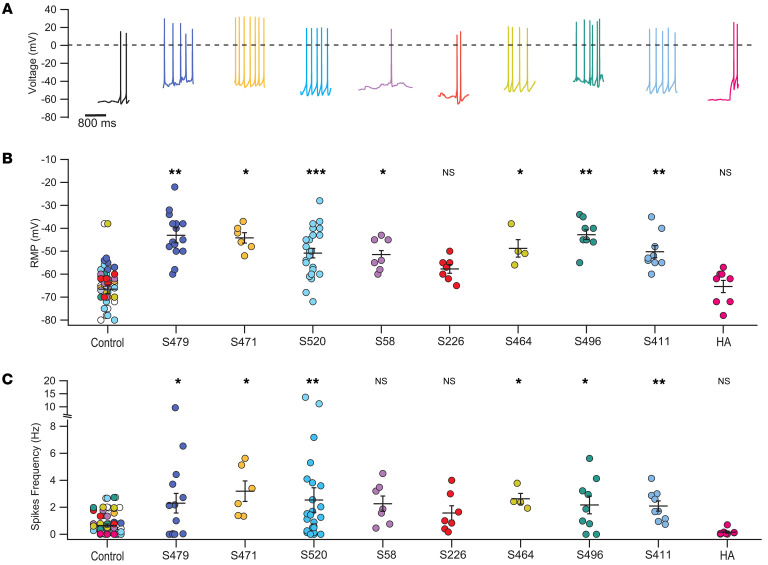
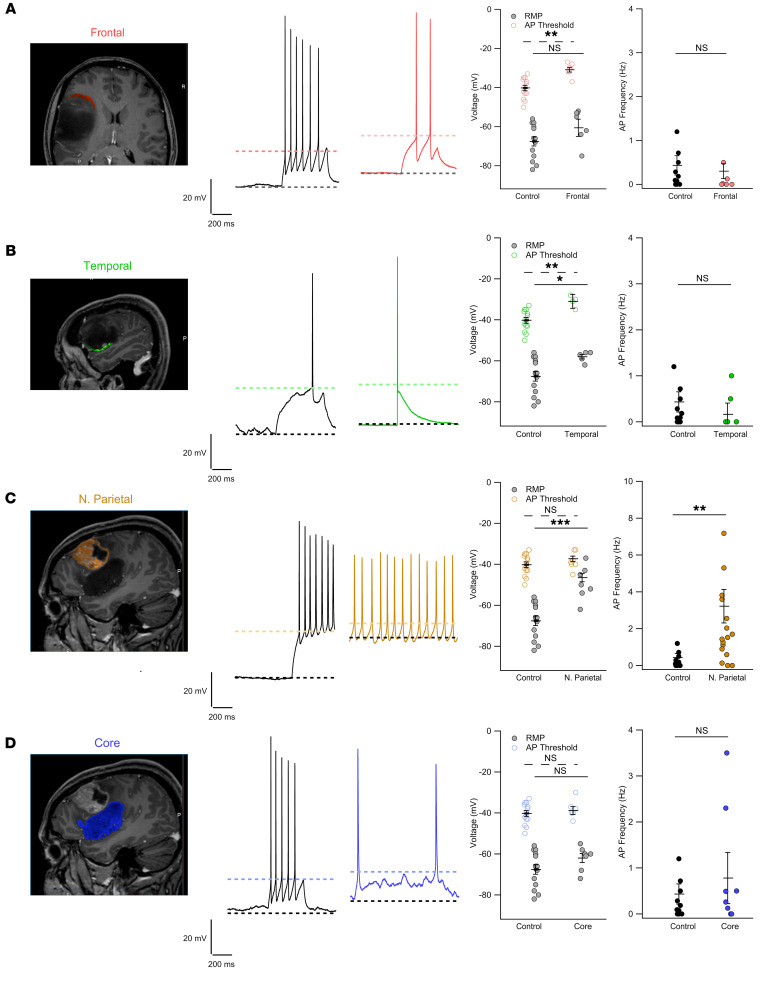
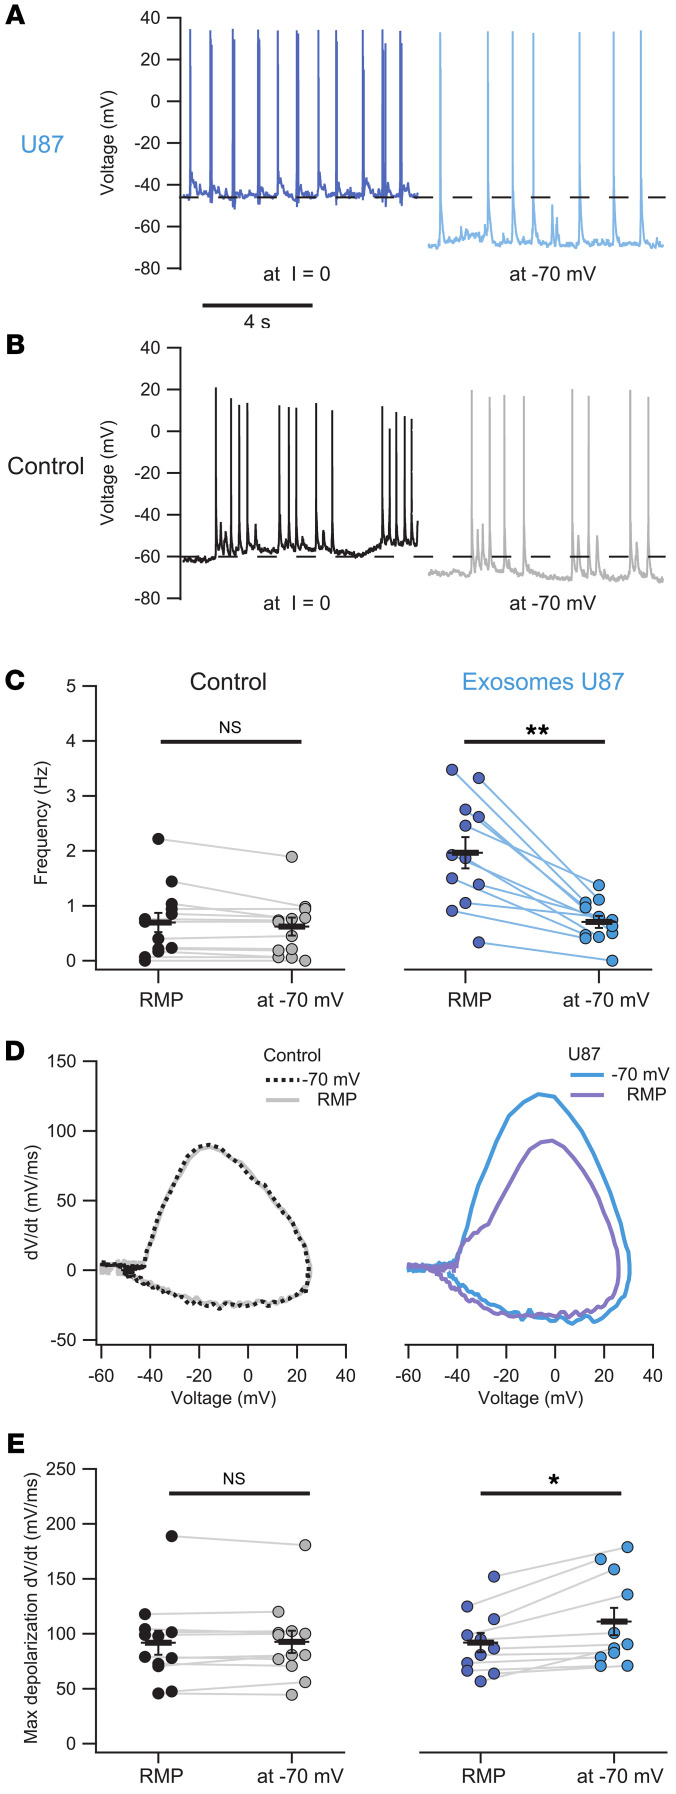
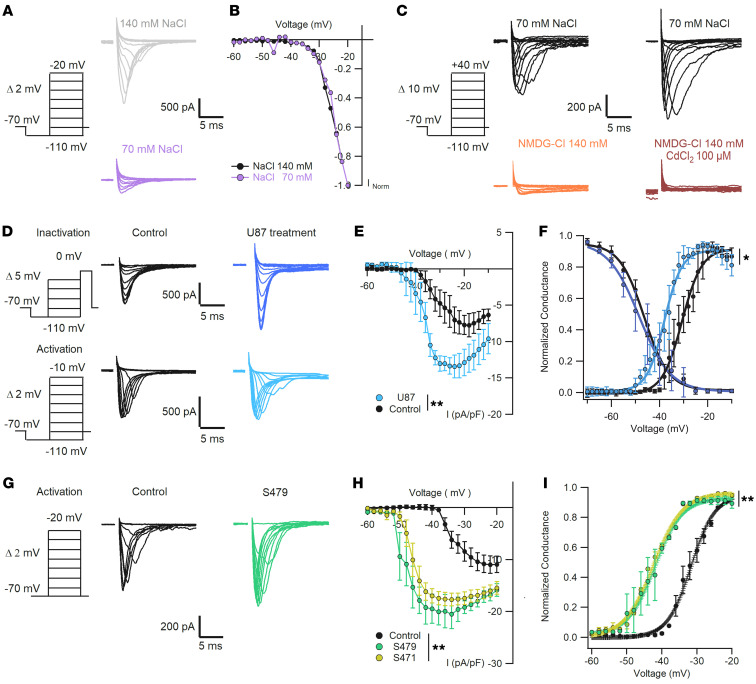
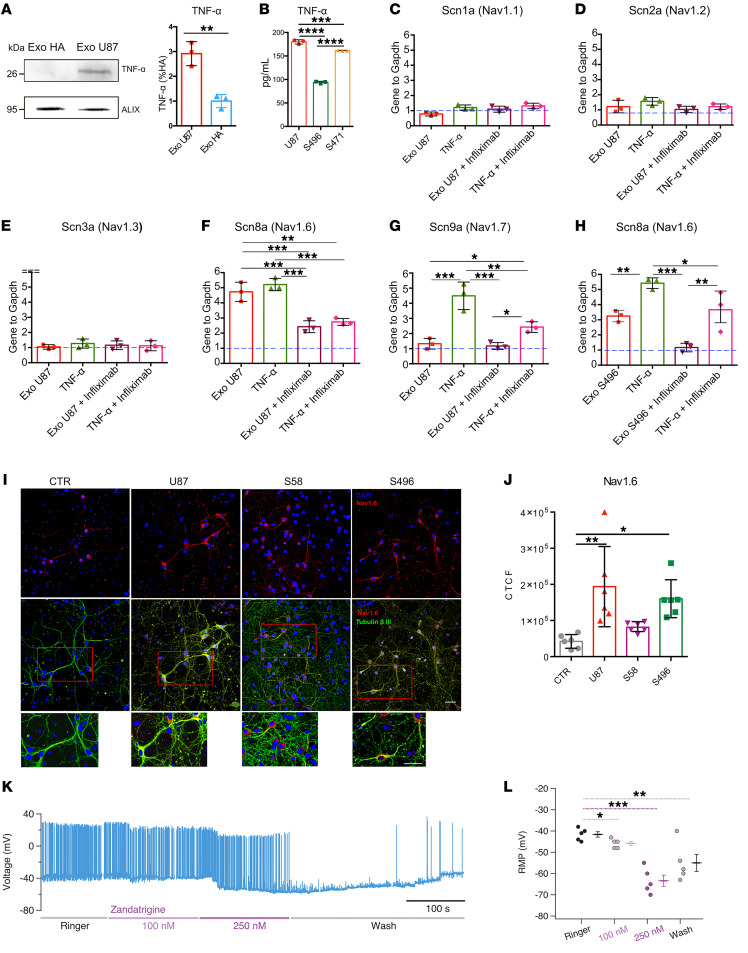
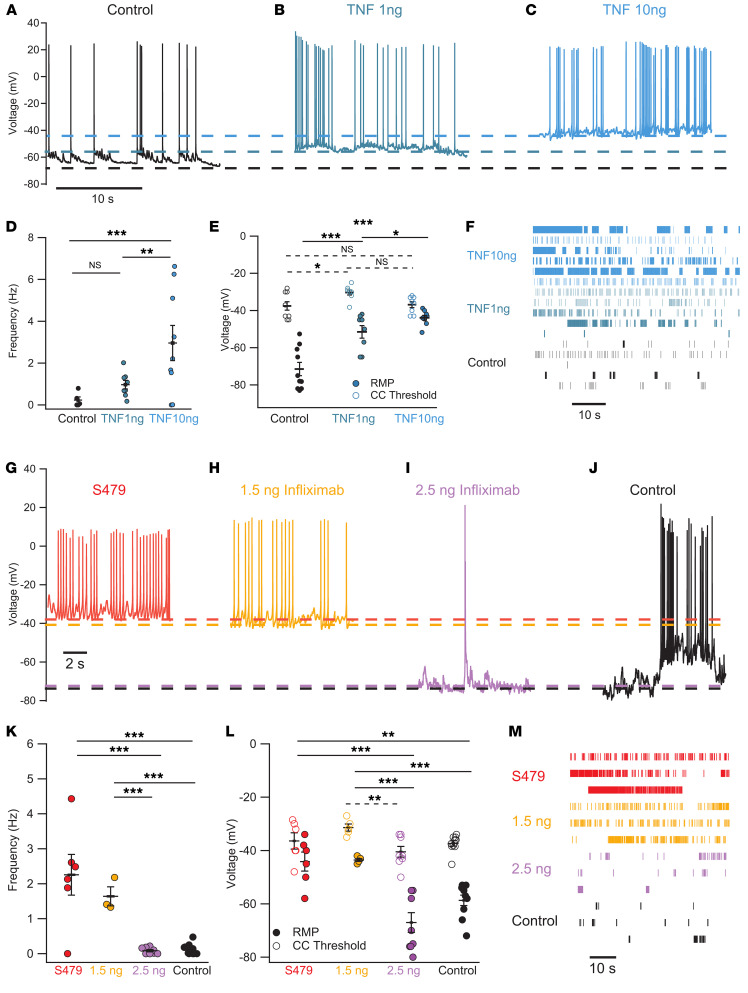
Patients affected by glioma frequently experience epileptic discharges; however, the causes of brain tumor-related epilepsy (BTRE) are still not completely understood. We investigated the mechanisms underlying BTRE by analyzing the effects of exosomes released by U87 glioma cells and by patient-derived glioma cells. Rat hippocampal neurons incubated for 24 hours with these exosomes exhibited increased spontaneous firing, while their resting membrane potential shifted positively by 10-15 mV. Voltage clamp recordings demonstrated that the activation of the Na+ current shifted toward more hyperpolarized voltages by 10-15 mV. To understand the factors inducing hyperexcitability, we focused on exosomal cytokines. Western blot and ELISAs showed that TNF-α was present inside glioma-derived exosomes. Remarkably, incubation with TNF-α fully mimicked the phenotype induced by exosomes, with neurons firing continuously, while their resting membrane potential shifted positively. Real-time PCR revealed that both exosomes and TNF-α induced overexpression of the voltage-gated Na+ channel Nav1.6, a low-threshold Na+ channel responsible for hyperexcitability. When neurons were preincubated with infliximab, a specific TNF-α inhibitor, the hyperexcitability induced by exosomes and TNF-α was drastically reduced. We propose that infliximab, an FDA-approved drug to treat rheumatoid arthritis, could ameliorate the conditions of glioma patients with BTRE.

Keywords: Brain cancer; Epilepsy; Neuroscience; Oncology; Sodium channels.


Figures

Figure 1
Figure 1. U87 exosomes induce increased spontaneous firing that is independent of the synaptic input.
(A) Intracellular recordings in current clamp (I = 0) from a control hippocampal neuron (left, black trace) and a neuron incubated for 24 hours with U87 exosomes (right, blue trace). (B) Comparison of resting membrane potential (RMP; filled circles) and AP threshold (open circles). (C) Spontaneous AP frequency for both conditions. For B and C, n = 16 control, n = 20–22 treated neurons. **P < 0.01, ***P < 0.001, Mann-Whitney U test. (D) AP distribution from 8 randomly selected neurons in control and treated groups. (E) Neurons exhibiting low synaptic inputs: representative examples of voltage clamp recordings at –70 mV under control and treated conditions to obtain recordings of synaptic currents not contaminated by voltage-gated conductances. (F) Corresponding current clamp recordings from the cells in E, showing increased firing induced by U87 exosomes (blue). (G and H) Voltage clamp at –70 mV (G) and current clamp (H) obtained from a control and a U87-treated neuron exhibiting high synaptic inputs.
Figure 2
Figure 2. The increase of spontaneous firing is also induced by patient-derived exosomes.
(A) Representative current clamp recordings from control hippocampal neurons (leftmost black trace) and neurons incubated with patients’ exosomes (colored traces) and with exosomes obtained from healthy human astrocytes (HAs; rightmost pink trace); the dashed black line shows 0 mV. Patients’ identification numbers are indicated. (B) RMP for all the experimental groups. Values for exosomes derived from patients with an epileptic report were –43 ± 2.6 mV for GASC-S479 and –42.8 ± 2.13 for GSC-S496, which were significantly different from the values of their control groups, i.e., –61.7 ± 4.4 mV and –76.8 ± 7.3 mV, respectively. (C) Spontaneous firing frequency of the same experimental groups: 2.3 ± 0.73 Hz for GASC-S479, 2.17 ± 0.65 Hz for GSC-S496; the respective controls were 0.56 ± 0.14 Hz and 1.46 ± 0.54 Hz. Data from control neurons for all the experimental groups are overimposed in the leftmost column. *P < 0.05, **P < 0.01, ***P < 0.001, Mann-Whitney U test, n = 4–25.
Figure 3
Figure 3. The effect of patient exosomes depends on the region they derived from.
Panels show, from left to right: tomography images of patient S520 highlighting the different portions of the tumor; traces from control neurons (black) and from neurons treated with exosomes derived from the different tumor areas (colored traces); and quantification of RMP, AP threshold, and AP frequency. (A) Coronal tomography section showing the tumoral region in close contact with the frontoparietal lobe highlighted in red. RMP: –67.57 ± 3.31 mV (control) and –59.1 ± 3.2 mV (exosomes); AP threshold: –40 ± 1.4 mV (control) and –30.8 ± 1.24 mV (exosomes); spike frequency: 0.43 ± 0.22 mV (control) and 0.09 ± 0.07 Hz (exosomes). (B) Sagittal tomography section showing the temporal border of the tumor highlighted in green. RMP: –58 ± 1.14 mV; AP threshold: –31 ± 1.5 mV; spike frequency: 0.3 ± 0.2 Hz. Control values as in A. (C) Sagittal tomography section showing a tumor nodule localized in the parietal lobe highlighted in yellow. RMP: –46.5 ± 1.95 mV; AP threshold: –37.3 ± 1.26 mV; spike frequency; 3.22 ± 0.9 Hz. Control values as in A. (D) Sagittal tomography section showing the tumor mass localized in the temporal lobe highlighted in blue; exosomes were extracted from the core of this mass. RMP: –62 ± 2.23 mV; AP threshold: –38.2 ± 2 mV; spike frequency: 0.9 ± 0.45 Hz. Control values as in A. Kruskal-Wallis followed by Bonferroni-corrected Dunn’s test for all groups vs. control. *P < 0.05, **P < 0.01, ***P < 0.001; control n = 14 (common to all experimental samples), temporal n = 4–5, frontal n = 7, parietal n = 18, core n = 6–8.
Figure 4
Figure 4. Exosomes increase excitability of hippocampal neurons, accelerating the depolarizing phase of AP initiation.
(A) Representative traces of treated neurons recorded in current clamp (I = 0) display a highly depolarized RMP (dark blue) and the same cell held at –70 mV. (B) Control neurons recorded as in A. (C) Comparison of the spontaneous activity frequency of hippocampal neurons held at RMP (I = 0) versus –70 mV. Control neurons had an average frequency of 0.69 ± 0.18 Hz at RMP, with no significant change observed when hyperpolarized to –70 mV (0.62 ± 0.16 Hz; P > 0.05, Wilcoxon’s paired samples test). In contrast, treated neurons decreased their spontaneous activity when a hyperpolarizing current was injected, reducing the frequency from 1.96 ± 0.28 Hz at RMP to 0.7 ± 0.11 Hz at –70 mV (**P < 0.01, Wilcoxon’s paired samples test). (D and E) Mean AP phase plot shows increased maximum depolarization rate (dV/dt) when U87 exosome–treated neurons were held at –70 mV (111.1 ± 12.4 mV/ms) compared with those at RMP (92 ± 8.7 mV/ms; *P < 0.05, Wilcoxon’s paired samples test). This effect was not observed in control neurons, which exhibited similar rates both at –70 mV (92.7 ± 10.08 mV/ms) and at RMP (91.8 ± 11 mV/ms; P > 0.05, Wilcoxon’s paired samples test). In all panels, n = 12 control, n = 13 treated.
Figure 5
Figure 5. Increased spontaneous firing is associated with a shift of the activation curve of the inward voltage-dependent Na+ current.
(A) Representative traces of voltage-dependent Na+ current activation in the presence of 140 mM (gray) and 70 mM (purple) NaCl. (B) Normalized currents in A show similar voltage activation dependence. Kruskal-Wallis test, P > 0.05, n = 5. (C) Replacement of NaCl by NMDG-Cl shows a residual small inward current (orange) blocked by addition of CdCl2 100 μM (brown); n = 5. (D) Representative traces of voltage-dependent Na+ currents obtained with CdCl 100 μM in the extracellular solution and internal solution with CsCl 135 mM plus NaCl 5 mM. Currents were recorded with the protocols used for activation and inactivation in control (black: n = 7–10) and U87 exosome–treated (blue: n = 12–14) neurons. (E) I-V curve comparing current density as in D, showing increased current in treated neurons (Kruskal-Wallis test, **P < 0.01). (F) Dependence of normalized conductance G/max G as a function of voltage for control and treated neurons, showing an average V1/2 shift of –6.4 mV (values in main text; *P < 0.05, Mann-Whitney U test). (G) Representative traces of Na+ currents activated under control conditions (black, n = 7) and in neurons treated for 24 hours with exosomes from patient S479 (green, n = 7). (H) Average I-V curves of Na+ currents for control and patient exosome–treated neurons, showing higher Na+ current density in cells treated with patients’ exosomes (**P < 0.01, Kruskal-Wallis test). (I) Normalized conductance curve for the conditions in H showing early activation of the Na+ conductance of neurons treated with patients’ exosomes (V1/2 shift of –12 ± 7.2 mV, values in main text; **P < 0.01, Mann-Whitney U test). Voltage clamp protocols to test Na+ current activation and inactivation are shown on the left of each panel.
Figure 6
Figure 6. Exosomal TNF-α induces Nav1.6 overexpression.
(A) Lysates of HA and U87 exosomes were analyzed by SDS-PAGE followed by Western blotting (left) using anti–TNF-α and ALIX antibodies. Quantification of TNF-α (right) was obtained by normalization to the exosome marker ALIX and is reported as percentage with respect to HA (n = 3; **P < 0.01, 2-tailed t test). (B) Quantification of TNF-α in U87 and patients S496 and S471’s exosomes using ELISA (n = 3 cultures). (CG) Real-time PCR quantification of Scn1a, Scn2a, Scn3a, Scn8a, and Scn9a in hippocampal neurons treated with U87 exosomes (Exo U87), TNF-α, U87 exosomes plus infliximab pretreatment, and TNF-α plus infliximab pretreatment. (H) Real-time PCR quantification of Scn8a using patient S496’s exosomes. Blue dashed line represents gene expression under control conditions, set to 1. Each gene is normalized to the housekeeping Gapdh gene. n = 3 cultures. (I) Hippocampal neurons were exposed to control (CTR), U87, patient S58, and patient S496 exosomes; fixed; and stained with anti-Nav1.6 (red channel), anti–βIII-tubulin (green channel), and DAPI to stain nuclei (blue channel). Scale bars: 50 μm. (J) Quantification of the experiment in I reported as corrected total cell fluorescence (CTCF). n = 6 coverslips from 2 dissections. Each point represents the average of 4 fields acquired for each coverslip. All data are shown as mean with SD. *P < 0.05, **P < 0.01, ***P < 0.001, ****P < 0.0001, 1-way ANOVA followed by Dunnett’s post hoc test. (K) Representative current clamp recordings from a treated neuron in the presence of increasing amounts of zandatrigine. Zandatrigine 250 nM blocked the spontaneous AP firing; this effect was partially reversible following blocker removal. (L) Quantification of the zandatrigine effect on RMP. *P < 0.05, **P < 0.01, ***P < 0.001, Kruskal-Wallis followed by Bonferroni-corrected Dunn’s test, n = 5.
Figure 7
Figure 7. TNF-α depolarizes RMP and increases firing frequency similarly to exosomes, an effect that is antagonized by infliximab.
(AC) Representative current clamp traces under control conditions (black) and in a neuron treated for 24 hours with low (blue/green) and high (blue) TNF-α concentration. (D and E) Quantification of spontaneous firing frequency, RMP, and AP threshold for control neurons and those treated with low and high TNF-α concentration. Solid lines for RMP, dashed lines for threshold values. (F) Raster plots of the firing in the 3 experimental conditions. (G and H) Representative current clamp traces of a neuron treated with patient-derived exosomes (red, n = 6) and neurons pretreated with 1.5 ng/mL infliximab (yellow, n = 3–5), both showing high spiking frequency. (I and J) As in G and H but for control neurons (black, n = 10) and neurons pretreated with 2.5 ng/mL infliximab before exosome application (purple, n = 8). Dashed lines indicate AP threshold for the 4 experimental conditions. (K) AP frequency for the groups in GJ. (L) AP threshold (open circles) and RMP (filled circles) for the treatments in GJ. Infliximab 2.5 ng decreased AP frequency and increased the difference between the RMP and AP threshold. (M) Raster plots of the firing in the 4 experimental conditions. Control values: RMP = –58.7 ± 2 mV; threshold = –37.4 ± 1 mV. *P < 0.05, **P < 0.01, ***P < 0.001, Kruskal-Wallis followed by Bonferroni-corrected Dunn’s test.

References

    1. Brogna C, et al. Brain tumors and epilepsy. Expert Rev Neurother. 2008;8(6):941–955. doi: 10.1586/14737175.8.6.941. - DOI - PubMed
    1. Englot DJ, et al. Epilepsy and brain tumors. Handb Clin Neurol. 2016;134:267–285. doi: 10.1016/B978-0-12-802997-8.00016-5. - DOI - PMC - PubMed
    1. Saeedi S, et al. The emerging role of exosomes in mental disorders. Transl Psychiatry. 2019;9(1):122. doi: 10.1038/s41398-019-0459-9. - DOI - PMC - PubMed
    1. Adhikari S, et al. Pathogenesis and management of brain tumor-related epilepsy. In: Debinski W, ed. Gliomas. Exon Publications; 2021:199–210. - PubMed
    1. Ius T, et al. Predictors of postoperative seizure outcome in low grade glioma: from volumetric analysis to molecular stratification. Cancers (Basel) 2020;12(2):397. doi: 10.3390/cancers12020397. - DOI - PMC - PubMed

MeSH terms

Substances

LinkOut - more resources