. 2024 Aug 1;19(8):e0306423.
doi: 10.1371/journal.pone.0306423. eCollection 2024.

Excitatory to inhibitory synaptic ratios are unchanged at presymptomatic stages in multiple models of ALS

Affiliations

Excitatory to inhibitory synaptic ratios are unchanged at presymptomatic stages in multiple models of ALS

Calum Bonthron et al. PLoS One. .

Abstract

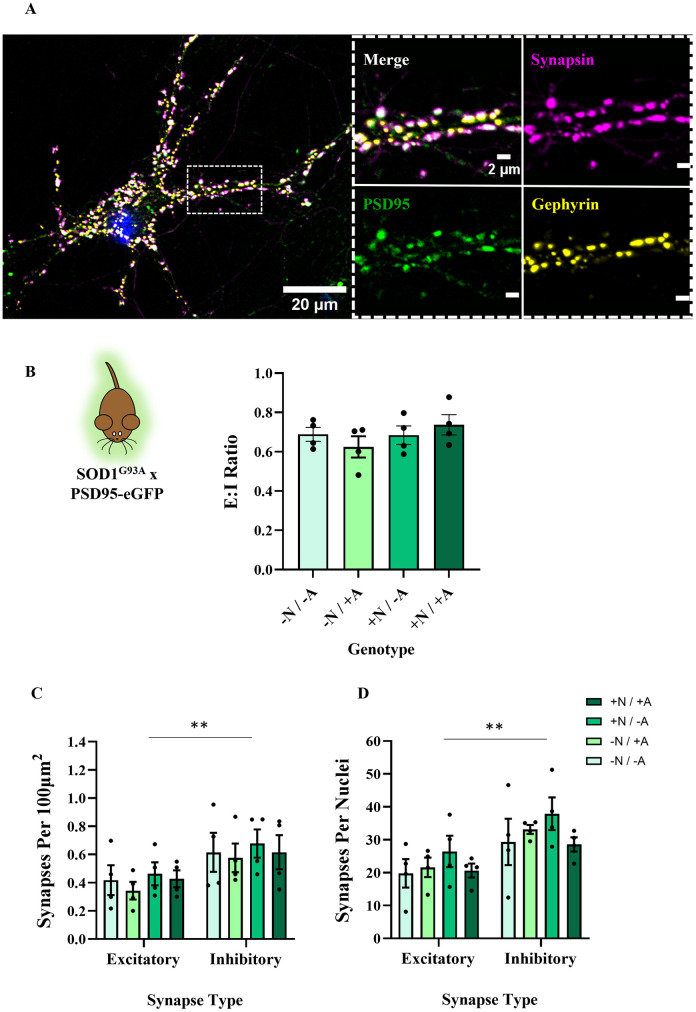
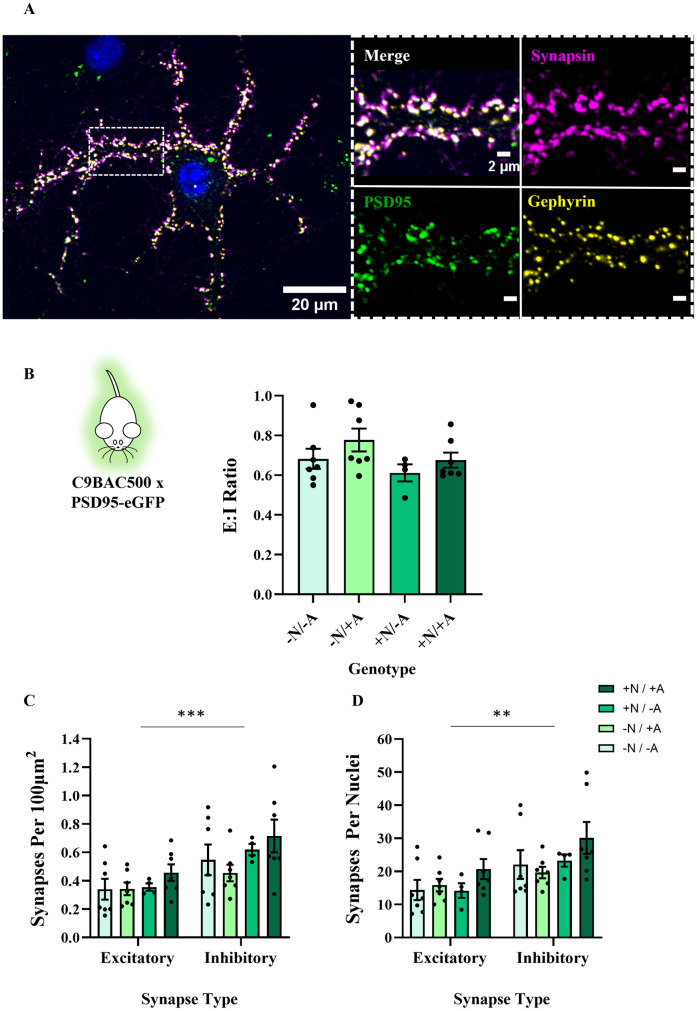
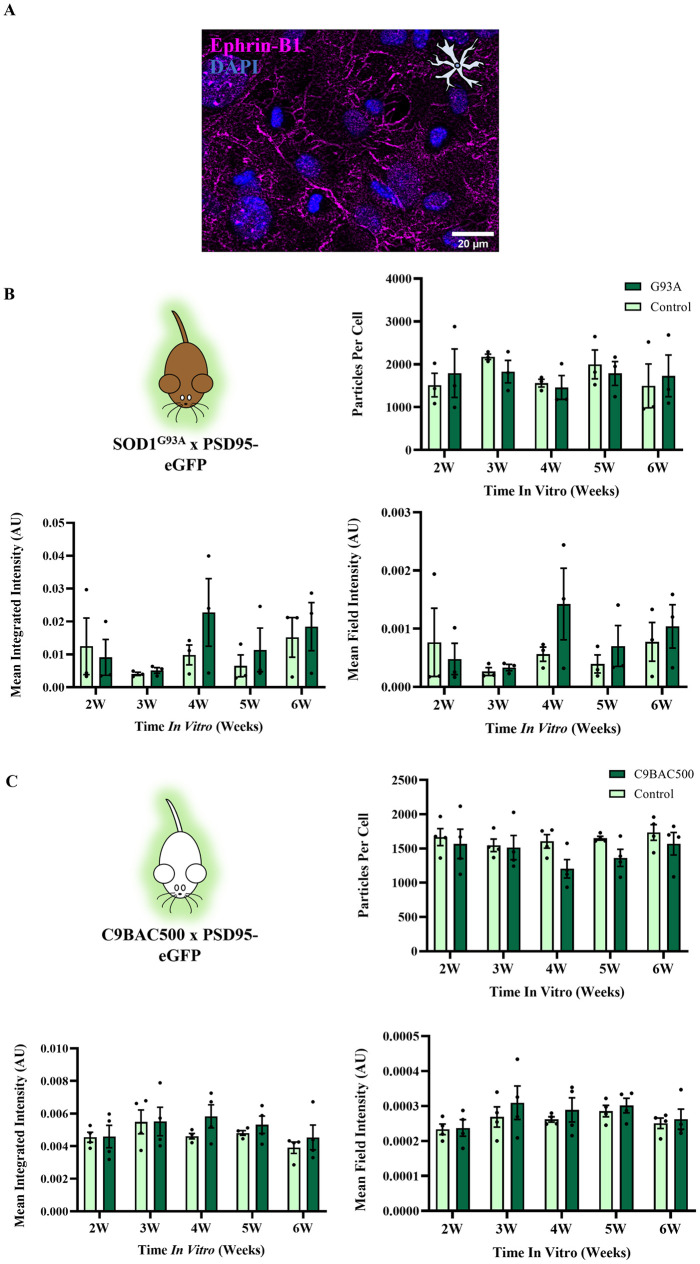
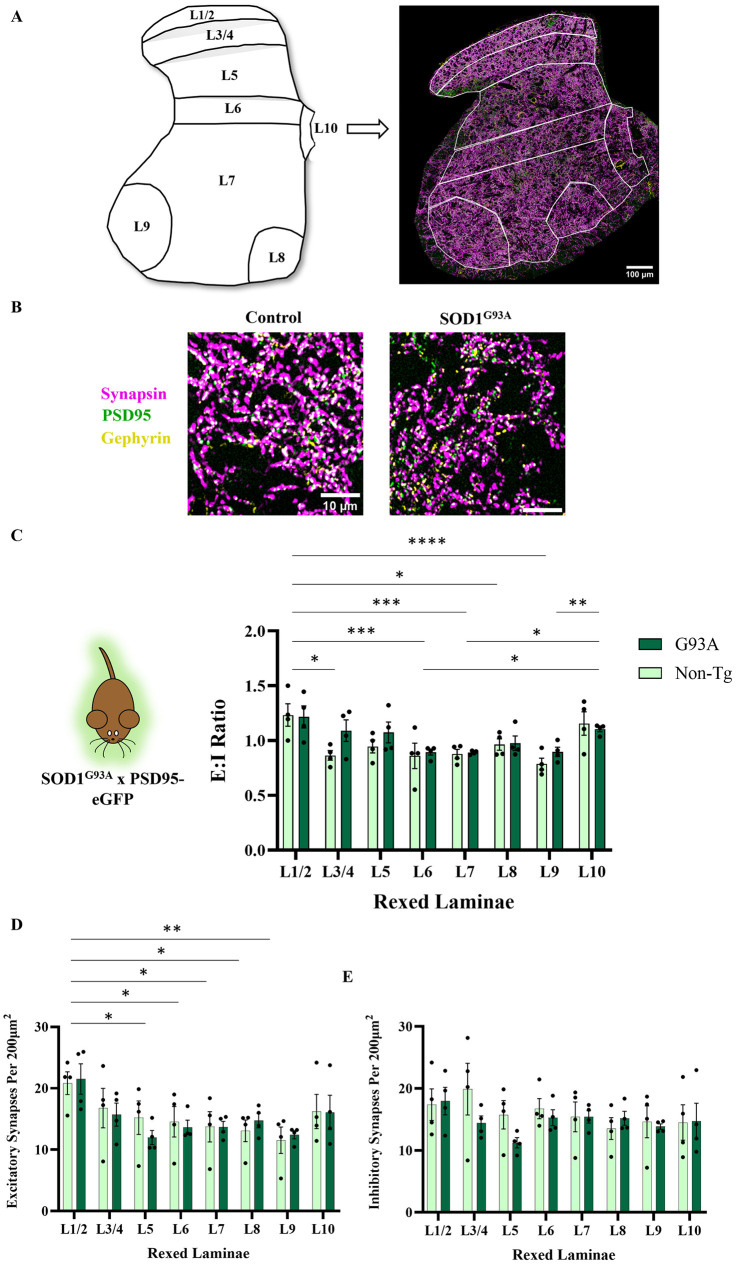
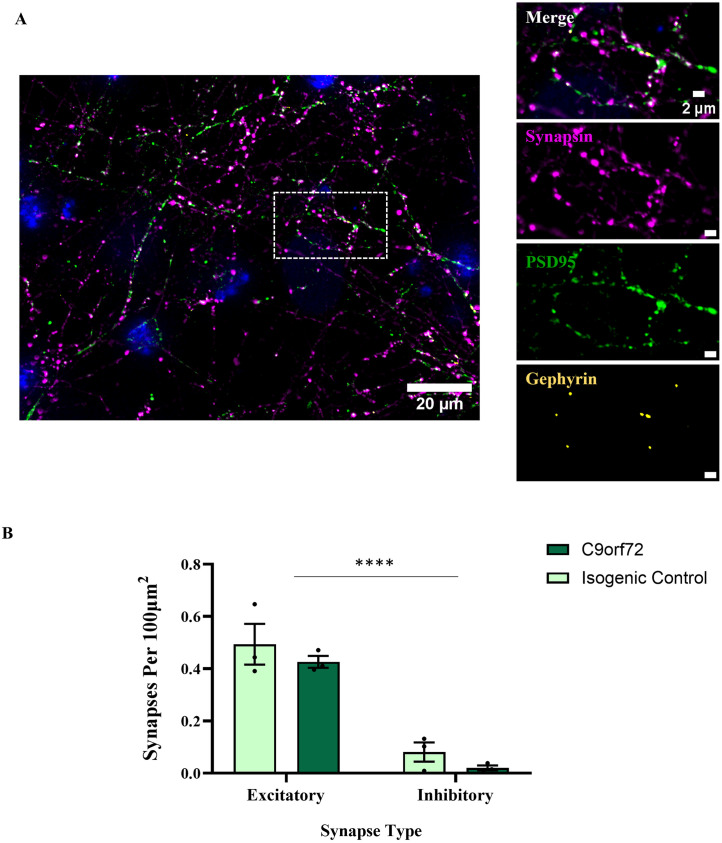
Hyperexcitability of motor neurons and spinal cord motor circuitry has been widely reported in the early stages of Amyotrophic Lateral Sclerosis (ALS). Changes in the relative amount of excitatory to inhibitory inputs onto a neuron (E:I synaptic ratio), possibly through a developmental shift in synapse formation in favour of excitatory transmission, could underlie pathological hyperexcitability. Given that astrocytes play a major role in early synaptogenesis and are implicated in ALS pathogenesis, their potential contribution to disease mechanisms involving synaptic imbalances and subsequent hyperexcitability is also of great interest. In order to assess E:I ratios in ALS, we utilised a novel primary spinal neuron / astrocyte co-culture system, derived from neonatal mice, in which synapses are formed in vitro. Using multiple ALS mouse models we found that no combination of astrocyte or neuron genotype produced alterations in E:I synaptic ratios assessed using pre- and post-synaptic anatomical markers. Similarly, we observed that ephrin-B1, a major contact-dependent astrocytic synaptogenic protein, was not differentially expressed by ALS primary astrocytes. Further to this, analysis of E:I ratios across the entire grey matter of the lumbar spinal cord in young (post-natal day 16-19) ALS mice revealed no differences versus controls. Finally, analysis in co-cultures of human iPSC-derived motor neurons and astrocytes harbouring the pathogenic C9orf72 hexanucleotide repeat expansion showed no evidence of a bias toward excitatory versus inhibitory synapse formation. We therefore conclude, utilising multiple ALS models, that we do not observe significant changes in the relative abundance of excitatory versus inhibitory synapses as would be expected if imbalances in synaptic inputs contribute to early hyperexcitability.


Conflict of interest statement

The authors have declared that no competing interests exist.

Figures

Fig 1
Fig 1. The presence of the SOD1G93A mutation in astrocytes or neurons has no impact on E:I ratios in primary co-cultures.
A) Example image of DIV 21 neuron in a SOD1G93A x PSD95-eGFP co-culture expressing synapsin, PSD95-eGFP and gephyrin. When zoomed, we see clear co-localisation of presynaptic and postsynaptic markers. B) Bar chart showing E:I ratios in co-cultures of 4 different combinations. + /—refers to the presence of the SOD1G93A mutation, N / A refers to the cell type referenced, either neurons or astrocytes, respectively (N = 4 co-culture platedowns). C) Bar chart showing numbers of excitatory and inhibitory synapses normalised to area (N = 4 co-culture platedowns). D) Bar chart showing numbers of excitatory and inhibitory synapses normalised to nuclei count (N = 4 co-culture platedowns).
Fig 2
Fig 2. The presence of the C9BAC500 expansion in astrocytes or neurons has no impact on E:I ratios in primary co-cultures.
A) Example image of DIV 21 neuron in a C9BAC500 x PSD95-eGFP co-culture expressing synapsin, PSD95-eGFP and gephyrin. When zoomed, we see clear co-localisation of presynaptic and postsynaptic markers, indicating significant synapse formation. B) Bar chart showing E:I ratios in co-cultures of 4 different genotype combinations. + /—refers to the C9BAC500 genotype and N / A refers to the cell type, either neurons or astrocytes, respectively (N = 4–7 co-culture platedowns). C) Bar chart showing numbers of excitatory and inhibitory synapses normalised to area (N = 4–7 co-culture platedowns). D) Bar chart showing numbers of excitatory and inhibitory synapses normalised to nuclei count (N = 4–7 co-culture platedowns).
Fig 3
Fig 3. SOD1G93A and C9BAC500 astrocytes do not express differing levels of synaptogenic protein ephrin-B1 versus controls.
A) Example image of ephrin-B1 expression in primary astrocyte culture. B) Expression measures of ephrin-B1 in primary astrocytes harbouring the SOD1G93A mutation. ‘G93A’ refers to cultures derived from SOD1G93A +/- PSD95-eGFP +/- animals, whilst ‘Control’ refers to cultures derived from SOD1G93A -/- PSD95-eGFP +/- animals (N = 3 platedowns). C) Expression measures of ephrin-B1 in primary astrocytes harbouring the C9BAC500 mutation. ‘C9BAC500’ refers to cultures derived from C9BAC500 +/- PSD95-eGFP +/- animals, whilst ‘Control’ refers to cultures derived from C9BAC500 -/- PSD95-eGFP +/- animals (N = 4 platedowns).
Fig 4
Fig 4. Week 3 SOD1G93A lumbar spinal cords show no difference in E:I ratios versus controls.
A) Schematic demonstrating the Rexed’s laminae of the L3 lumbar spinal cord used to delineate E:I ratios in different parts of the grey matter, together with a hemi-section scan of synapsin, PSD95-eGFP and gephyrin. B) Example zoomed images revealing high resolution synaptic structures of a control spinal cord (SOD1G93A -/- PSD95-eGFP +/-) and a SOD1G93A spinal cord (SOD1G93A +/- PSD95-eGFP +/-). C) Quantification of E:I ratios across spinal laminae in control versus SOD1G93A spinal slices (P16-P19, N = 4 for control and SOD1G93A). D) Quantification of excitatory synapse density across spinal laminae in control versus SOD1G93A spinal slices (N = 4 for control and SOD1G93A). E) Quantification of inhibitory synapse density across spinal laminae in control versus SOD1G93A spinal slices (N = 4 for control and SOD1G93A).
Fig 5
Fig 5. IPSC-derived MN/astrocyte cultures harbouring a C9orf72 repeat expansion show no changes in synapse formation compared to isogenic controls.
A) Example image of a 28 day post-plating iPSC-derived MN/astrocyte culture expressing synapsin, PSD95 and gephyrin. Zoomed panels on the right show a large degree of synapsin-PSD95 co-localisation, with relatively few gephyrin puncta present. B) Quantification of excitatory vs inhibitory synapse densities in C9orf72 cultures vs isogenic controls (N = 3).

References

    1. Kuo JJ, Schonewille M, Siddique T, Schults ANA, Fu R, Bär PR, et al.. Hyperexcitability of Cultured Spinal Motoneurons from Presymptomatic ALS Mice. J Neurophysiol. 2004;91: 571–575. doi: 10.1152/jn.00665.2003 - DOI - PubMed
    1. Kuo JJ, Siddique T, Fu R, Heckman CJ. Increased persistent Na+ current and its effect on excitability in motoneurones cultured from mutant SOD1 mice. Journal of Physiology. 2005;563: 843–854. doi: 10.1113/jphysiol.2004.074138 - DOI - PMC - PubMed
    1. van Zundert B, Peuscher MH, Hynynen M, Chen A, Neve RL, Brown RH, et al.. Neonatal Neuronal Circuitry Shows Hyperexcitable Disturbance in a Mouse Model of the Adult-Onset Neurodegenerative Disease Amyotrophic Lateral Sclerosis. Journal of Neuroscience. 2008;28: 10864–10874. doi: 10.1523/JNEUROSCI.1340-08.2008 - DOI - PMC - PubMed
    1. Quinlan KA, Schuster JE, Fu R, Siddique T, Heckman CJ. Altered postnatal maturation of electrical properties in spinal motoneurons in a mouse model of amyotrophic lateral sclerosis. Journal of Physiology. 2011;589: 2245–2260. doi: 10.1113/jphysiol.2010.200659 - DOI - PMC - PubMed
    1. Fritz E, Izaurieta P, Weiss A, Mir FR, Rojas P, Gonzalez D, et al.. Mutant SOD1-expressing astrocytes release toxic factors that trigger motoneuron death by inducing hyperexcitability. J Neurophysiol. 2013;109: 2803–2814. doi: 10.1152/jn.00500.2012 - DOI - PMC - PubMed

MeSH terms