. 2024 Aug 2;385(6708):eadk1679.
doi: 10.1126/science.adk1679. Epub 2024 Aug 2.

A chemogenetic screen reveals that Trpv1-expressing neurons control regulatory T cells in the gut

Affiliations

A chemogenetic screen reveals that Trpv1-expressing neurons control regulatory T cells in the gut

Yangyang Zhu et al. Science. .

Abstract

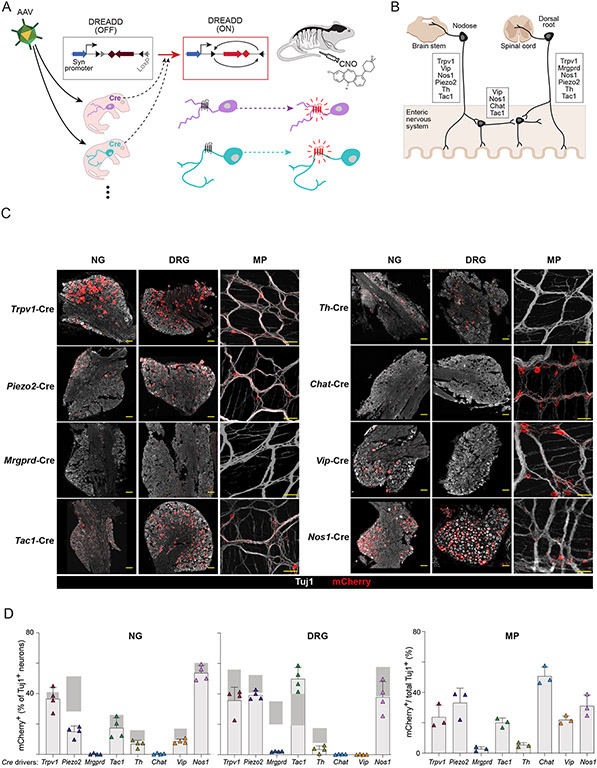
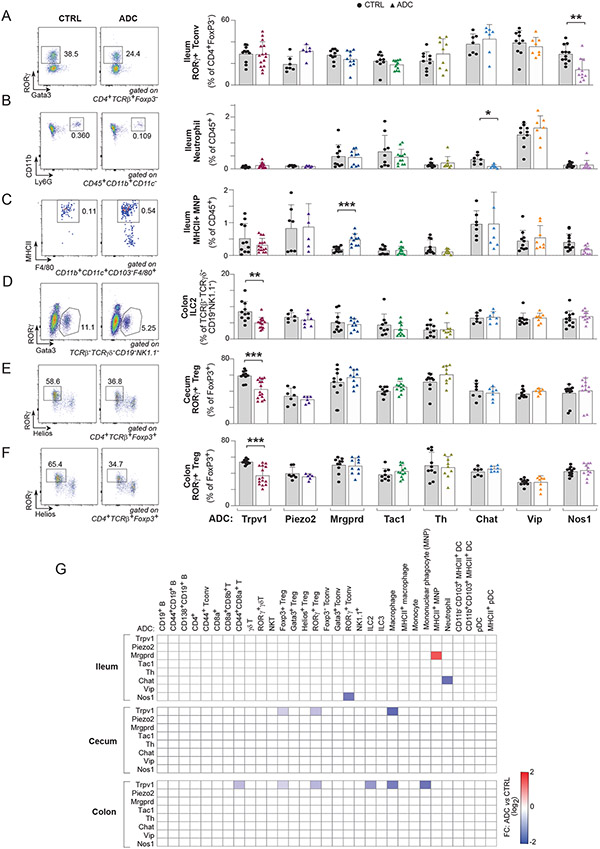
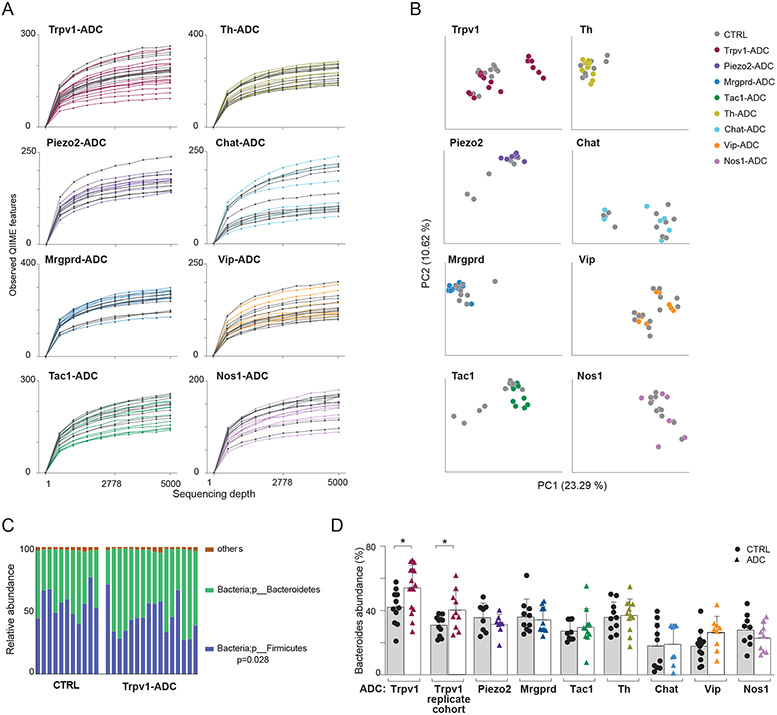
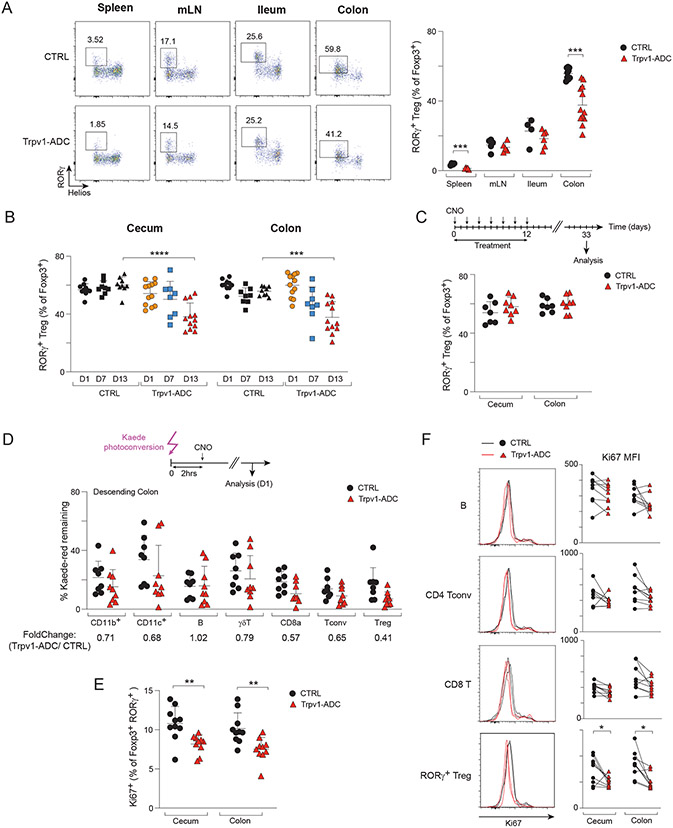
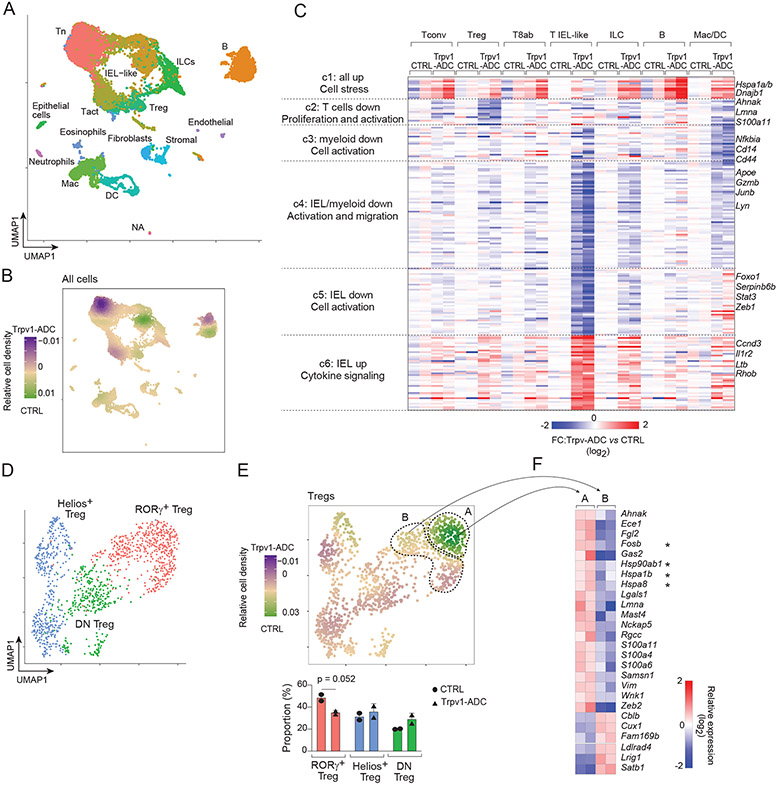
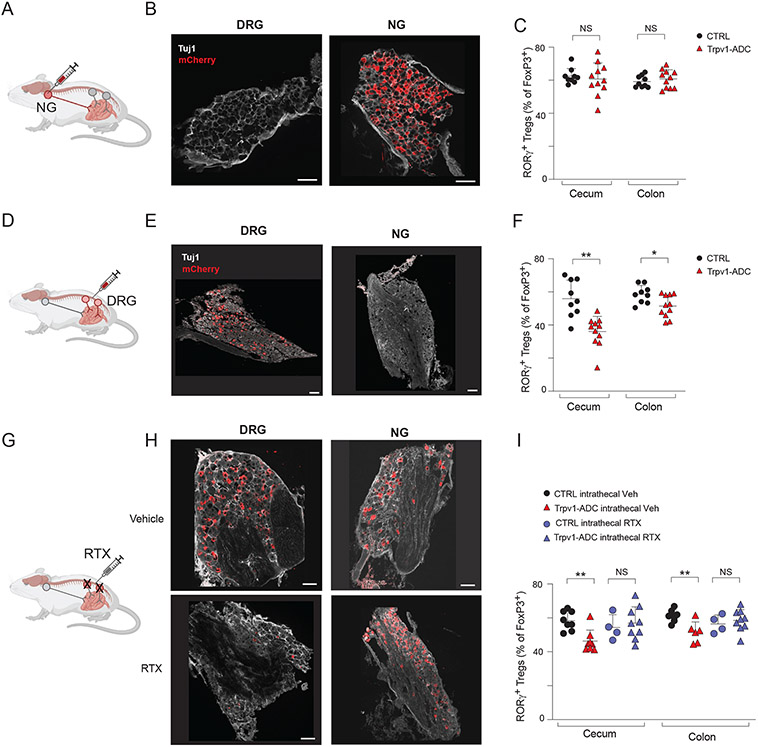
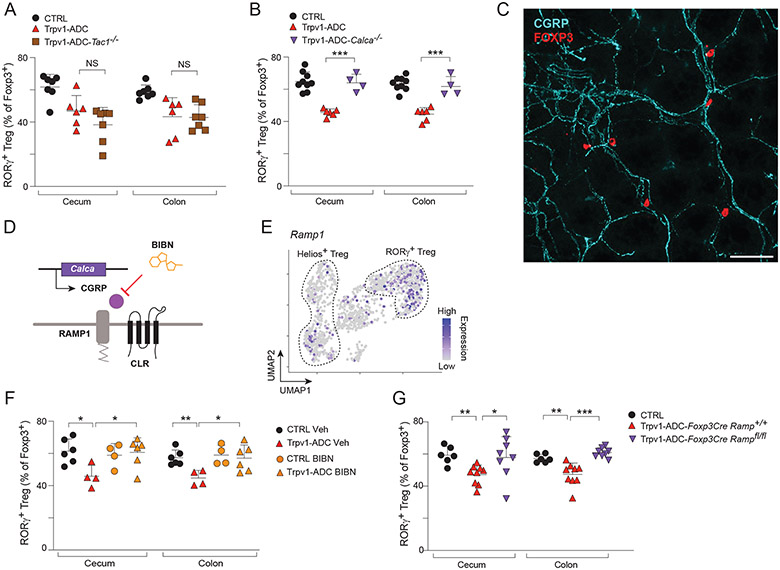
Neuroimmune cross-talk participates in intestinal tissue homeostasis and host defense. However, the matrix of interactions between arrays of molecularly defined neuron subsets and of immunocyte lineages remains unclear. We used a chemogenetic approach to activate eight distinct neuronal subsets, assessing effects by deep immunophenotyping, microbiome profiling, and immunocyte transcriptomics in intestinal organs. Distinct immune perturbations followed neuronal activation: Nitrergic neurons regulated T helper 17 (TH17)-like cells, and cholinergic neurons regulated neutrophils. Nociceptor neurons, expressing Trpv1, elicited the broadest immunomodulation, inducing changes in innate lymphocytes, macrophages, and RORγ+ regulatory T (Treg) cells. Neuroanatomical, genetic, and pharmacological follow-up showed that Trpv1+ neurons in dorsal root ganglia decreased Treg cell numbers via the neuropeptide calcitonin gene-related peptide (CGRP). Given the role of these neurons in nociception, these data potentially link pain signaling with gut Treg cell function.


Figures

Fig 1.
Fig 1.. Screening neuronal subtypes for immunomodulatory capabilities using viral mediated DREADDs.
(A) Schematic of experimental procedures describing setup of DREADD-based chemogenetic screen for neuronal effects on the gut immune system. (B) Diagram showing neuronal subtypes in different anatomical locations (dorsal root ganglia, nodose ganglia, enteric nervous system) that innervate the gut and markers expressed in each location. (C) Representative images of mCherry (red) and Tuj1 (βIII-tubulin, gray) staining in nodose ganglia (NG) and dorsal root ganglia (DRG) and myenteric plexus (MP) of the ENS after AAV.PhP.S-hSyn-DIO-mCherry-DREADD labeling of eight Cre lines. Scale bars are 100μm. (D) Quantification of mCherry expression patterns across the eight Cre lines in the DRG, NG, and MP. For DRG and NG, the proportion of mCherry+ cells out of total Tuj1+ cells were quantified (4-5 fields per mouse). For MP, the area labeled by mCherry out of total Tuj1 area was quantified (2 fields per mouse). Gray bars indicate the expected expression range for marker genes.
Fig 2.
Fig 2.. Distinct gut immune changes after DREADD-mediated neuronal activation.
(A-F) Quantification of proportions of ileum RORγ+ Tconv (A), ileum neutrophil (B), ileum MHCII+ MNP (C), colon ILC2 (D), colon RORγ+ Treg (E), and cecum RORγ+ Treg (F) with representative flow cytometric plots after chemogenetic activation of different neuronal subsets in distinct ADC mice and controls (CTRL). (G) Heatmap of average fold changes (relative to CTRL) for significantly changed immune cell populations in the ileum, cecum, and colon from each Cre line compared to control littermates after CNO treatment (P<0.05). White squares are where P>0.05. Each symbol (A-F) represents an individual mouse; Error bars represent mean and standard deviation. *,P < 0.05; **, P < 0.01 ***; P < 0.001 (unpaired Student’s t test with Holm-Sidak correction for multiple comparison). Data are representative of ≥2 independent experiments. n = 7-12 mice/group.
Fig 3.
Fig 3.. Microbiome changes upon specific neuronal activation.
(A) Alpha diversity rarefaction plots of microbial populations in different pairs of ADC mice and CTRL mice after CNO treatment. (B) Principal coordinates analysis (PCoA) of unweighted UniFrac distance measurements in different ADC mice and CTRL mice after CNO treatment. (C) Phylum-level analysis of the microbiome in the colon of Trpv1-ADC and CTRL mice. (D) Quantification of proportions of Bacteroidetes (phylum-level) in the colon of different ADC mice and CTRL mice after CNO treatment. Each symbol (C and E) represents an individual mouse; Error bars represent mean and standard deviation. *, P < 0.05 (unpaired Student’s t test with Holm-Sidak correction for multiple comparison). Data are representative of ≥2 independent experiments. n = 7-12 mice/group.
Fig 4.
Fig 4.. Trpv1+ neurons control the gut Treg cell niche.
(A) Representative flow cytometric plots and quantification of proportions of RORγ+ Tregs in the spleen, mLN, ileum and colon tissues from Trpv1-ADC and CTRL littermates. (B) Quantification of proportions of RORγ+ Tregs in the cecum and colon of Trpv1-ADC and CTRL mice from indicated timepoints post-CNO treatment (day 1, day 7: CNO injected daily, day 13: CNO injected every other day). (C) Quantification of proportions of RORγ+ Tregs in the cecum and colon of Trpv1-ADC and CTRL mice from indicated timepoint. (D) Quantification of proportions of Kaede red+ immune cells in the descending colon from Trpv1-ADC-Kaede and littermate controls. (E) Quantification of proportions of Ki67+ cells (of RORγ+ Tregs) in the cecum and colon from Trpv1-ADC and CTRL mice. (F) Representative flow cytometric plots and quantification of geometric MFI (gMFI) of Ki67 (of B, CD4 Tconv, CD8 T, and RORγ+ Treg) in the cecum and colon from Trpv1-ADC and CTRL mice. Each symbol (A-F) represents an individual mouse; Error bars represent mean and standard deviation. *; P < 0.05; **, P < 0.01 ***; P < 0.001; ****, P < 0.0001 (unpaired Student’s t test with Holm-Sidak correction for multiple comparison). Data are representative of ≥3 independent experiments. n = 5-12 mice/group.
Fig 5.
Fig 5.. scRNAseq reveals cell stress and cell activation upon nociceptor neuron activation.
(A and B) Single-cell RNA sequencing analysis of cecum immunocytes from Trpv1-ADC and CTRL mice. UMAP plot (A). Differential density plot (B). Tn: naïve T cells; Tact: activated T cells. (C) Heatmap of average expression fold changes (Trpv1-ADC vs. CTRL mice, log2) of differentially expressed genes (DEGs) extracted from 7 cell clusters as indicated. T8ab: CD8a+CD8b+ T, Mac/DC: Macrophages and dendritic cells. (D and E) scRNAseq analysis of cecum Tregs from Trpv1-ADC and CTRL mice. UMAP plot (D). Proportions of different clusters and differential density plot (E). (F) Heatmap of relative expression level (log2) of differential expressed genes (DEGs) extracted from the two RORγ+ Treg clusters as indicated in E from CTRL mice only. Each symbol (E) represents an individual mouse; Error bars represent mean and standard deviation. n = 2 mice/group.
Fig 6.
Fig 6.. Trpv1+ DRG neurons, but not NG, regulate the gut Treg niche.
(A) Schematic of intranodose ganglionic injection into Trpv1-Cre and control mice for targeting of AAV9hM3Dq virus to nodose/jugular ganglia. (B) Representative images of DRG and NG of mCherry (red) and Tuj1 (gray) after intranodose injection. (C) Quantification of RORγ+ Treg cells in the cecum and colon from intranodose ganglionic injected Trpv1-Cre and control mice. (D) Schematic of intrathecal injection into Trpv1-Cre and control mice for targeting of AAV9hM3Dq virus to DRG neurons. (E) Representative images of DRG and NG of mCherry (red) and Tuj1 (gray) from intrathecally injected mice. (F) Quantification of RORγ+ Tregs in the cecum and colon from intrathecally injected Trpv1-Cre and control mice. (G) Schematic of resiniferatoxin (RTX) intrathecal injection for ablation of Trpv1+ DRG neurons. (H) Representative images of DRG and NG of mCherry (red) and Tuj1 (gray) from Trpv1-ADC mice injected intrathecally with vehicle or RTX. (I) Quantification of RORγ+ Tregs in the cecum and colon from Trpv1-ADC and CTRL mice with intrathecal injection of vehicle or RTX. Each symbol (C, F, and I) represents an individual mouse; Error bars represent mean and standard deviation. *, P < 0.05; **, P < 0.01; NS, no significance (unpaired Student’s t test with Holm-Sidak correction for multiple comparison). Scale Bars: 100 μm in (B, E, and H). Data are representative of ≥2 independent experiments. n = 4-11 mice/group.
Fig 7.
Fig 7.. Trpv1+ neurons regulate the gut Treg niche via CGRP.
(A) Quantification of RORγ+ Tregs in the cecum and colon from CTRL, Trpv1-ADC, and Trpv1-ADC-Tac1−/− mice. (B) Quantification of RORγ+ Tregs in the cecum and colon from CTRL, Trpv1-ADC, and Trpv1-ADC-Calca−/− mice. (C) Representative image of Foxp3+ Tregs (red) in proximity to CGRP fibers (cyan) from whole mount colon tissue. (D) Schematic of CGRP signaling through its coreceptor complex formed by RAMP1 and CLR. (E) UMAP of Ramp1 expression in Treg cell populations from CTRL mice. (F) Quantification of RORγ+ Tregs in the cecum and colon from CTRL and Trpv1-ADC mice treated with vehicle or BIBN4096. (G) Quantification of RORγ+ Tregs in the cecum and colon from CTRL, Trpv1-ADC-FoxP3CreRamp1+/+, and Trpv1-ADC-FoxP3CreRamp1fl/fl mice. Each symbol (A-C, and E) represents an individual mouse; Error bars represent mean and standard deviation. *, P < 0.05; **, P < 0.01; ***; P < 0.001; NS, no significance (unpaired Student’s t test with Holm-Sidak correction for multiple comparison). Scale Bars: 100 μm in (D). Data are representative of ≥2 independent experiments. n = 4-10 mice/group.

Comment in

References

    1. Jacobson A, Yang D, Vella M, Chiu IM, The intestinal neuro-immune axis: crosstalk between neurons, immune cells, and microbes. Mucosal. Immunol 14, 555–565 (2021). - PMC - PubMed
    1. Wang H, Foong JPP, Harris NL, Bornstein JC, Enteric neuroimmune interactions coordinate intestinal responses in health and disease. Mucosal. Immunol 15, 27–39 (2022). - PMC - PubMed
    1. Cryan JF, Dinan TG, Gut microbiota: Microbiota and neuroimmune signalling-Metchnikoff to microglia. Nat Rev Gastroenterol. Hepatol 12, 494–496 (2015). - PubMed
    1. Blackshaw LA, Brookes SJ, Grundy D, Schemann M, Sensory transmission in the gastrointestinal tract. Neurogastroenterol. Motil 19, 1–19 (2007). - PubMed
    1. Costa M, Brookes SJ, Hennig GW, Anatomy and physiology of the enteric nervous system. Gut. 47 Suppl 4, iv15–iv19 (2000). - PMC - PubMed

Publication types

MeSH terms

Substances