. 2024 Aug 22;187(17):4751-4769.e25.
doi: 10.1016/j.cell.2024.07.005. Epub 2024 Jul 31.

Molecular mechanism of distinct chemokine engagement and functional divergence of the human Duffy antigen receptor

Affiliations

Molecular mechanism of distinct chemokine engagement and functional divergence of the human Duffy antigen receptor

Shirsha Saha et al. Cell. .

Abstract

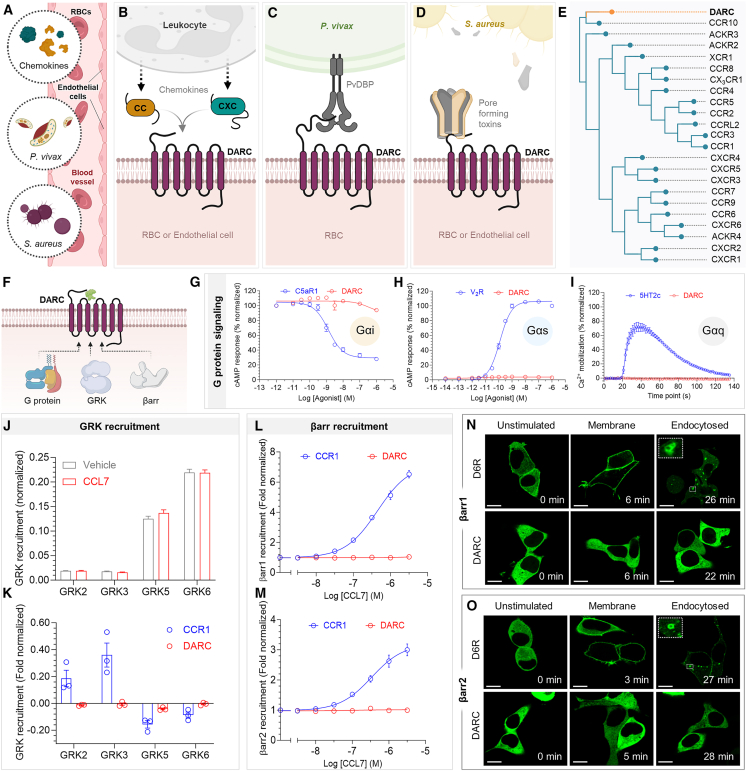
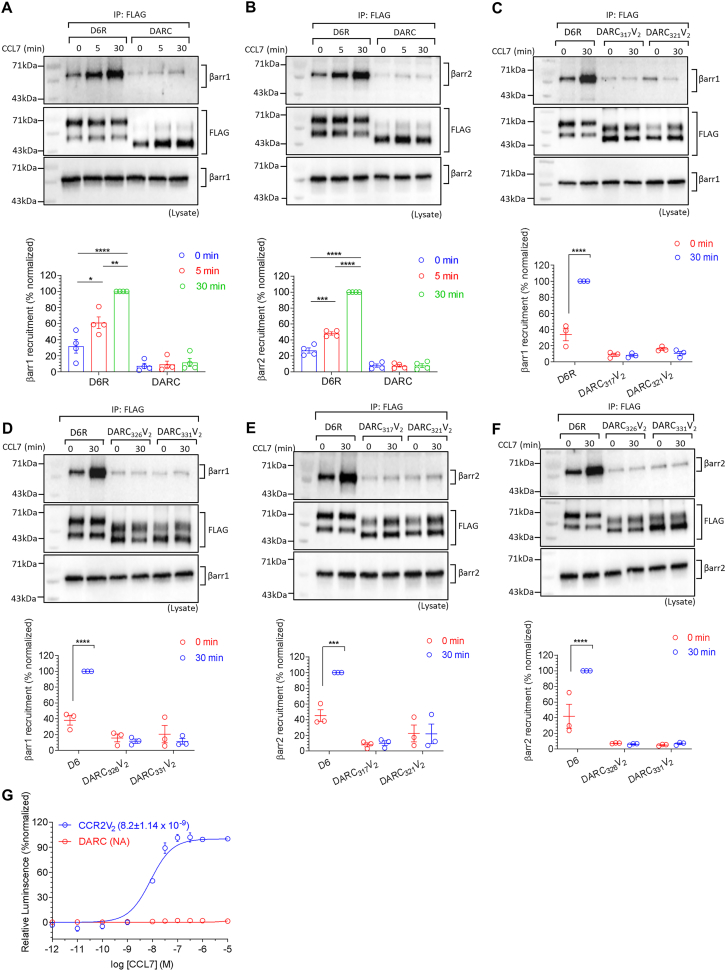
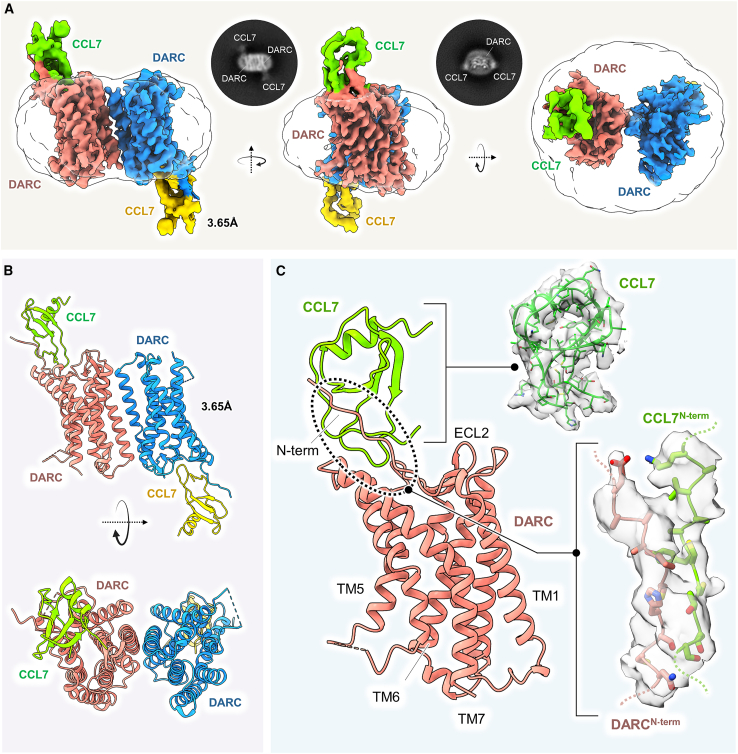
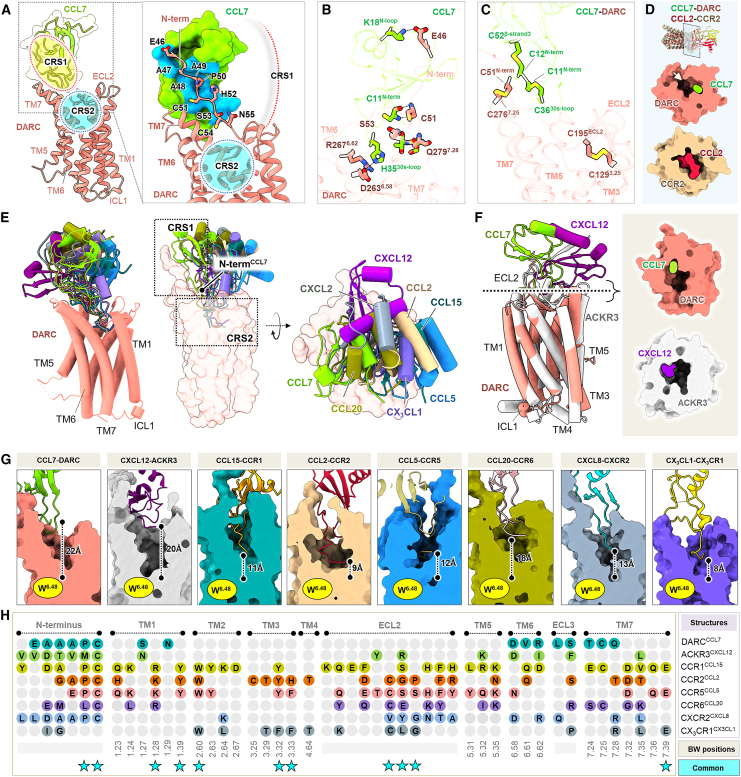
The Duffy antigen receptor is a seven-transmembrane (7TM) protein expressed primarily at the surface of red blood cells and displays strikingly promiscuous binding to multiple inflammatory and homeostatic chemokines. It serves as the basis of the Duffy blood group system in humans and also acts as the primary attachment site for malarial parasite Plasmodium vivax and pore-forming toxins secreted by Staphylococcus aureus. Here, we comprehensively profile transducer coupling of this receptor, discover potential non-canonical signaling pathways, and determine the cryoelectron microscopy (cryo-EM) structure in complex with the chemokine CCL7. The structure reveals a distinct binding mode of chemokines, as reflected by relatively superficial binding and a partially formed orthosteric binding pocket. We also observe a dramatic shortening of TM5 and 6 on the intracellular side, which precludes the formation of the docking site for canonical signal transducers, thereby providing a possible explanation for the distinct pharmacological and functional phenotype of this receptor.

Keywords: ACKR1; Duffy antigen receptor; G protein-coupled receptors; atypical chemokine receptors; cellular signaling; chemokine receptors; cryogenic-electron microscopy.


Conflict of interest statement

Declaration of interests The authors declare no competing interests.

Figures

None
Graphical abstract
Figure 1
Figure 1
Functional divergence exhibited by the Duffy antigen receptor (A) DARC provides the docking site for various chemokines and pathogens. (B) CC and CXC chemokines released from leukocytes reportedly bind to DARC. (C) The malarial parasite Plasmodium vivax interacts with and invades red blood cells through the interaction of PvDBP and DARC. (D) Multiple pore-forming toxins secreted by the pathogen Staphylococcus aureus also target DARC receptor for pore formation. (E) Phylogenetic analysis of all chemokine receptors. (F) Schematic representation of transducer coupling with DARC. (G–I) The G protein signaling profiles of DARC with respect to Gi, Gs, and Gq are shown in comparison with C5aR1, V2R, and 5HT2c, respectively. Data (mean ± SEM) represent four (G–I) independent sets. Data have been normalized either with respect to the highest signal observed for each set (treated as 100%) (G) or with respect to the highest signal observed for positive control (treated as 100%) (H). (J and K) Stimulation of DARC with CCL7 fails to induce GRK recruitment, as measured by BRET assay (J) and NanoBiT assay (K). Data (mean ± SEM) represent 3–6 independent experiments. Change in response has been plotted for both assays. (L and M) Recruitment of βarr isoforms (βarr1/2) to DARC and CCR1 are shown, as assessed via NanoBiT assay. Data (mean ± SEM) represent three independent experiments and have been normalized with respect to the signal observed at basal condition for each set (treated as 1). (N and O) Confocal assay corroborates the lack of β-arrestin recruitment and trafficking downstream of DARC. A representative image visualizing mYFP-β-arrestin is shown from two independent experiments (scale bars, 10 μm). See also Figures S1–S4.
Figure S1
Figure S1
Phylogenetic analysis of GPCRs highlighting the position of DARC, related to Figure 1 The phylogenetic plot presented here was obtained from www.gpcrdb.org.
Figure S2
Figure S2
Lack of G protein activation and GRK recruitment downstream of DARC, related to Figure 1 (A) Stimulation with CCL7 does not induce G protein heterotrimer dissociation. Data (mean ± SEM) represent three independent experiments, normalized with respect to baseline signal (i.e., vehicle treatment) for each set. (B and C) CCL7 treatment fails to induce GRK recruitment to DARC, as measured by BRET assay (B) and NanoBiT assay (C). Data (mean ± SEM) represent four to six independent experiments (B). Data (mean ± SEM) represent three independent experiments, normalized with respect to baseline signal (i.e., vehicle treatment) for each set, treated as 1 (C).
Figure S3
Figure S3
Lack of β-arrestin recruitment to DARC, related to Figure 1 (A and B) DARC fails to elicit β-arrestin recruitment in response to CCL7, as measured by co-immunoprecipitation. A representative image from four independent experiments and densitometry-based quantification of data (mean ± SEM), normalized with respect to the signal observed at 30 min after ligand stimulation of D6R (treated as 100%) is shown here. Data are analyzed using two-way ANOVA (Sidak’s multiple comparison; p < 0.05, ∗∗p < 0.01, ∗∗∗p < 0.001, ∗∗∗∗p < 0.0001). (C–F) Addition of V2-tail at different positions fails to induce β-arrestin recruitment. A representative image from four independent experiments and densitometry-based quantification of data (mean ± SEM), normalized with respect to the signal observed at 30 min after ligand stimulation of D6R (treated as 100%) is shown here. Data are analyzed using two-way ANOVA (Sidak’s multiple comparison; ∗∗∗p < 0.001, ∗∗∗∗p < 0.0001). (G) TANGO assay confirms the lack of β-arrestin coupling to DARC. Data (mean ± SEM) represent four independent experiments, normalized with respect to the highest signal observed for CCR2V2 (treated as 100%).
Figure S4
Figure S4
Lack of G protein signaling and β-arrestin recruitment downstream of DARC in response to multiple chemokines and surface expression of receptors in various assays, related to Figure 1 (A) Surface expression of all receptors for various assays. (B) Schematic representation of the different chemokines that bind DARC (chemokines used in subsequent assays are highlighted). (C) No decrease in cytosolic cAMP is observed upon stimulating DARC with multiple CC and CXC chemokines. Data (mean ± SEM) represent three independent experiments, normalized with respect to the baseline signal observed for each set (treated as 100%). For CXCL12, the observed response is due to endogenous CXCR4, which is then blocked by pre-treatment with CXCR4 antagonist AMD3100. (D) Multiple CC and CXC chemokines tested fail to induce β-arrestin recruitment to DARC, as measured by NanoBiT assay. Data (mean ± SEM) represent three independent experiments, normalized with respect to the baseline signal observed for each set (treated as 1).
Figure S5
Figure S5
Mass-spectrometry-based phosphoproteomics analysis, related to Figure 2 (A) Schematic outline of sample preparation for phosphoproteomics assay. (B) Significantly enriched pathways identified in phosphoproteomics (top-10) are represented by a Circos plot. Pathways that are significantly enriched are indicated on the right side of the Circos, whereas the significantly differentially expressed proteins (DEPs) regulating these pathways are indicated on the left side of the Circos plot. The unidirectional edges of the Circos plot show un-weighted association of the significant DEP (each having a unique color marker) with their respective pathway(s).
Figure 2
Figure 2
Proteomics-based insights into potential downstream signaling (A) Heatmap showing differentially phosphorylated peptides generated following MS-based phospho-proteomics analysis of HEK293 cells stably expressing DARC in the presence and absence of CCL7 stimulation. Four independent samples prepared in parallel were subjected to analysis. (B) Cellular proteins identified to undergo phosphorylation/dephosphorylation following stimulation with CCL7 were classified on the basis of biological processes, molecular functions, and cellular localizations to reveal an extensive network of potential signaling pathways. (C) Volcano plot representation of the peptides undergoing upregulation/downregulation in their phosphorylation state following stimulation with CCL7. (D) Heatmap showing proteins whose physical interaction with DARC undergoes an alteration upon stimulation with CCL7, identified on the basis of mass-spectrometry-based interactome study. Four independent samples prepared in parallel were subjected to analysis. (E) Cellular proteins identified to undergo an alteration in their physical interaction with DARC following stimulation with CCL7 were classified on the basis of biological processes, molecular functions, and cellular localizations to reveal an extensive network of potential signaling pathways. (F) Volcano plot representation of the proteins undergoing increased/decreased association with DARC upon stimulation with CCL7. See also Figures S5 and S6 and Tables S1 and S2.
Figure 3
Figure 3
Identifying potential signaling partners of DARC (A) A simplified schematic depicting the process of transcytosis of DARC along with the bound chemokine across the venular endothelium, from the basolateral to the apical side. Hits identified from phosphoproteomics analysis that are potential regulators of this pathway have been denoted, along with a brief description of their known functions (Rab11-FIP1, Rab11 family interacting protein 1, Uniprot ID: Q6WKZ4; Snapin Uniprot ID: O95295; Raftlin Uniprot ID: Q14699; EHBP-1, EH-domain-binding protein 1, Uniprot ID: Q8NDI1; Rabex-5 Uniprot ID: Q9UJ41). (B) STRING analysis reveals CD82 as one of the potential interactors of DARC. (C) Schematic representation of the physiological role of CD82 and DARC interaction in suppressing metastasis. (D) DARC interacts with CD82 in the absence of any stimulation, as measured under non-cross-linking conditions. A representative image from three independent experiments is shown here. (E–H) Stimulation with CCL7 does not alter the interaction between DARC and CD82, as measured under both non-cross-linking (E and F) and cross-linking (G and H) conditions. A representative image from three to four independent experiments, along with densitometry-based quantification of data (mean ± SEM) normalized with respect to the signal observed under unstimulated condition (treated as 1) is shown here. Two-way ANOVA using Tukey’s multiple comparison has been performed (ns denotes not significant).
Figure S6
Figure S6
Mass-spectrometry-based interactome analysis, related to Figure 2 (A) Schematic outline of sample preparation for interactome assay. (B) Significantly enriched pathways identified in interactome assay (all) are represented by a Circos plot. Pathways that are significantly enriched are indicated on the right side of the Circos, whereas the significantly differentially expressed proteins (DEPs) regulating these pathways are indicated on the left side of the Circos plot. The unidirectional edges of the Circos plot shows un-weighted association of the significant DEP (each having a unique color marker) with their respective pathway(s).
Figure 4
Figure 4
Structure of the Duffy antigen receptor (A) Cryo-EM structure of the CCL7-bound DARC dimeric complex, at a resolution of 3.65Å, is shown in surface depiction in three different orientations. Representative 2D class averages with discernible secondary features are shown in the inset. (B) Atomic coordinates of CCL7-DARC complex shown in ribbon representation in two different views. (C) A monomeric unit of CCL7-DARC complex is shown as a cartoon representation with cryo-EM density maps of CCL7 and the interface region between CCL7 and DARC in the insets. (Salmon and blue, DARC protomers; green and yellow, CCL7). See also Data S1 and Tables S3 and S4.
Figure S7
Figure S7
Validation of CCL7 binding to purified DARC, docking sites on DARC in comparison with CCR2, and comparative analysis with inactive and active state chemokine receptors, related to Figures 5 and 6 (A and B) Apo-DARC and CCL7-DARC were subjected to cryo-EM data collection, followed by 2D class average analysis and an ab initio reconstruction from a small dataset. A clear density of CCL7 is apparent in the CCL7-DARC complex, confirming its binding to purified DARC. (C) The extracellular and intracellular cavities have been highlighted in the CCL7-bound DARC in comparison with CCL2-CCR2 (PDB: 7XA3) (left). Receptors are shown as Coulombic charged surface to depict the constricted ligand binding pocket on DARC (right). (D and E) Structural alignment of CCL7-DARC with inactive CCR5 (PDB: 5UIW), CXCR2 (PDB: 6LFL), and active CCR5 (PDB: 7O7F), CXCR2 (PDB: 6LFO) structures. The deviations in TM5, TM6, and TM7 are shown. (Arrows with gray and cyan depict inactive CCR5 and CXCR2, respectively. Arrows with blue and slate gray depict active CCR5 and CXCR2, respectively. TMs of DARC have been shown in red arrows).
Figure 5
Figure 5
A distinct mode of chemokine recognition by DARC (A) Overall CCL7 binding mode in DARC. The regions of CRS1 and CRS2 are indicated by dashed circles (left). The key residues of DARC that interacts with CCL7 (blue surface) are shown. The possible CRS2 is empty and indicated by blue dashed circle. (B) Interactions between the core domain of CCL7 and the N terminus of DARC in CRS1 are illustrated (hydrogen bonds and salt bridges are shown as black dashed lines). (C) Disulfide linkages in CCL7 and DARC stabilize their overall architecture and fold. (D) The shallow binding of CCL7 with DARC has been depicted as surface slice representation. The CCL2-CCR2 structure (PDB: 7XA3) has been used as a reference where CCL2 enters deep into the ligand binding pocket. (E) Overall binding pose of chemokines on DARC (left and right) with CRS1 and CRS2 highlighted as dotted box (middle). Other receptor components have been removed after aligning the chemokine-receptor complex structures with CCL7-DARC. (F) Structural alignment of CCL7-DARC and CXCL12-ACKR3 (left), the shallow binding mode of ligands on the respective ligands are illustrated as surface slice representation. (G) Pairs of chemokine-chemokine receptor structures are shown to highlight the position of N termini of chemokines at the orthosteric pocket. Distance between the N terminus and the conserved toggle switch residue (Trp6.48) has been calculated in all structures. The N terminus of CCL7 is the farthest from Trp6.48 compared with the other pairs (CXCL12-ACKR3, PDB: 7SK8; CCL15-CCR1, PDB: 7VL9; CCL2-CCR2, PDB: 7XA3; CCL5-CCR5, PDB: 7O7F; CCL20-CCR6, PDB: 6WWZ; CXCL8-CXCR2, PDB: 6LFO; CX3CL1-CX3CR1, PDB: 7XBX). (H) Alignment of the interface residues between chemokines and their respective chemokine receptor structures have been provided. The Ballesteros-Weinstein positions are also mentioned below the TM regions. CCL7 makes the least number of contacts with DARC as compared with the other chemokine-chemokine receptor structures. The conserved interface residues in receptors are denoted as cyan-colored stars. See also Figure S7.
Figure 6
Figure 6
Divergent structural features of the 7TM domain in DARC (A) Structural alignment of CCL7-DARC with the inactive (PDB: 6GPS) and active (PDB: 7XA3) structures of CCR2 to highlight the changes in TM5, TM6, and TM7 (left). The deviation angles of TM5, TM6, and TM7 in CCL7-DARC, with respect to the inactive and active structure of CCR2, are shown in blue and brown, respectively. (Arrows with blue, red and brown depict the TMs of inactive CCR2, DARC and active CCR2, respectively). (B) Conformations of ICL2 and TM4 were found to be unique in DARC as compared with the CCL2-CCR2 structure (PDB: 7XA3). The cytoplasmic end of TM3 forms a kink and translates about 64° in comparison with that of CCR2, probably due to a shorter ICL2. (C) TM5 and TM6 are shorter in length compared with that of CCR2. In addition, TM5 exhibits an outward shift. (D) TM3 in CXCL12-ACKR3 (PDB: 7SK8) forms a relatively smaller kink toward the cytoplasmic side when compared with CCL7-DARC (left). DARC harbors relatively shorter TM5 and TM6 as compared with ACKR3 (right). (E) Superimposition of CCL7-bound DARC with active structures of chemokine-chemokine receptor pairs. Salmon, CCL7-DARC; gray, CXCL12-ACKR3 (PDB: 7SK8); blue, CCL5-CCR5 (PDB: 7O7F); beige, CCL2-CCR2 (PDB: 7XA3); deep gray, CXCL8-CXCR2 (PDB: 6LFO); and teal, CCL15-CCR1 (PDB: 7VL9). DARC has been shown in cylinders and other structures are in ribbon representation. (F) Conformations of ICL2 and TM4 in active chemokine upon alignment with CCL7-bound DARC (CCL15-CCR1, PDB: 7VL9; CCL5-CCR5, PDB: 7O7F; CCL20-CCR6, PDB: 6WWZ; CXCL8-CXCR2, PDB: 6LFO; CX3CL1-CX3CR1, PDB: 7XBX). (G) The activation hallmark microswitches conserved in class A receptors are shown in cyan spheres (left). Positions of microswitches are different in the CCL7-bound DARC structure when compared with the classical GPCRs. The inactive (PDB: 6GPS) and active (PDB: 7XA3) structures of CCR2 have been taken as reference. See also Figures S7 and S8 and Table S5.
Figure S8
Figure S8
Interface of P-C motif on DARC, CCL7 HDX-MS analysis and schematic representation highlighting ligand promiscuity and lack of transducer coupling, related to Figures 6 and 7 (A) CCL7 bound to DARC is shown as ribbon representation. (B) Residues of the P-C motif are shown as sticks bound to CCL7 as surface. The P-C motif residues dock into the cavity in CCL7 formed by the C-I-C residues. (C) Non-bonded contacts between P-C and C-I-C residues are shown as black dashed lines. (D) HDX-MS profiles have been shown upon binding of CCL7 onto DARC. Different regions with distinct deuterium uptake values have been highlighted on the structure of DARC (blue, reduced deuterium exchange; yellow, no exchange). The HDX-MS plots for the peptides with reduced exchange have been shown. Data (mean ± SEM) represent three independent experiments analyzed using two-way ANOVA (Sidak’s multiple comparison; p < 0.05, ∗∗p < 0.01, ∗∗∗p < 0.001, ∗∗∗∗p < 0.0001). (E) The schematic illustrates the importance of the cleft formed by the cytoplasmic ends of TM5 and TM6 in G protein, GRK, and β-arrestin coupling (left). DARC exhibits the most promiscuous interaction with chemokines, leading to scavenging functions. CRS2 in DARC is not directly involved in ligand binding. DARC possesses relatively shorter TM5/TM6, exhibiting limited conformational changes as compared with the canonical GPCRs, thereby precluding the interactions with G protein, GRK, and β-arrestins (right).
Figure 7
Figure 7
A schematic summary of distinct structural and functional features of DARC (A) Comparison of CXCL12-ACKR3 (PDB: 7SK8), CCL15-CCR1 (PDB: 7VL9), CCL2-CCR2 (PDB: 7XA3), CCL5-CCR5 (PDB: 7O7F), CCL20-CCR6 (PDB: 6WWZ), CXCL2-CXCR2 (PDB: 6LFO), and CX3CL1-CX3CR1 (PDB: 7XBX), with CCL7-DARC structure shown as surface slice representation illustrating the formation of the transducer binding cavity as opposed to CCL7-DARC. Red arrows highlight the formed cytoplasmic cavity. (B) Relative lengths of TM5 and TM6 have been compared with active state classical GPCRs. A single receptor from each sub-family has been selected for comparison. (β2AR, PDB: 3SN6; C5aR1, PDB: 8HQC; LHR, PDB: 7FIG; FFAR4, PDB: 8H4I; MT1R, PDB: 7VGZ; A1R, PDB: 6D9H; HCAR2, PDB: 7XK2; Rho, PDB: 6FUF; OR51E2, PDB: 8F76). (C) Alignment of the CCL7-DARC structure with C5aR1-Gi (PDB: 8IA2), NTSR1-GRK2 (PDB: 8JPB), and β1V2R-βarr1 (PDB: 6TKO) highlighting the short TM5 and TM6 in DARC compared with other receptors. (D) Structural superimposition of DARC and various receptors in complex with G proteins. (Top) C5aR1-Gi (PDB: 8IA2) and V2R-Gs (PDB: 7BB6), (bottom) 5HT2c-Gq (PDB: 8DPF) and GPR35-G13 (PDB: 8H8J). DARC (tube helices) and G proteins (ribbon helices) are shown as cartoons and other receptors as transparent surfaces. (E) Structural alignment of CCL7-DARC structure with NTSR1-GRK2 (PDB: 8JPB). DARC (tube helices) and GRK2 (ribbon helices) are shown as cartoons and NTSR1 as a transparent surface. (F) Structural alignment of CCL7-DARC structure with β1V2R-βarr1 (PDB: 6TKO). DARC (tube helices) and βarr1 (ribbon representation) are shown as cartoons and β1V2R as a transparent surface. See also Figure S8.

References

    1. Chaudhuri A., Polyakova J., Zbrzezna V., Williams K., Gulati S., Pogo A.O. Cloning of Glycoprotein D Cdna, Which Encodes the Major Subunit of the Duffy Blood-Group System and the Receptor for the Plasmodium-Vivax Malaria Parasite. Proc. Natl. Acad. Sci. USA. 1993;90:10793–10797. doi: 10.1073/pnas.90.22.10793. - DOI - PMC - PubMed
    1. Cutbush M., Mollison P.L. The Duffy blood group system. Heredity (Edinb) 1950;4:383–389. doi: 10.1038/hdy.1950.31. - DOI - PubMed
    1. Hadley T.J., Lu Z.H., Wasniowska K., Martin A.W., Peiper S.C., Hesselgesser J., Horuk R. Postcapillary venule endothelial cells in kidney express a multispecific chemokine receptor that is structurally and functionally identical to the erythroid isoform, which is the Duffy blood group antigen. J. Clin. Invest. 1994;94:985–991. doi: 10.1172/JCI117465. - DOI - PMC - PubMed
    1. Peiper S.C., Wang Z.X., Neote K., Martin A.W., Showell H.J., Conklyn M.J., Ogborne K., Hadley T.J., Lu Z.H., Hesselgesser J., et al. The Duffy antigen/receptor for chemokines (DARC) is expressed in endothelial cells of Duffy negative individuals who lack the erythrocyte receptor. J. Exp. Med. 1995;181:1311–1317. doi: 10.1084/jem.181.4.1311. - DOI - PMC - PubMed
    1. Landegger L.D., Vasilijic S., Fujita T., Soares V.Y., Seist R., Xu L., Stankovic K.M. Cytokine Levels in Inner Ear Fluid of Young and Aged Mice as Molecular Biomarkers of Noise-Induced Hearing Loss. Front. Neurol. 2019;10:977. doi: 10.3389/fneur.2019.00977. - DOI - PMC - PubMed