. 2024 Sep 5;187(18):4946-4963.e17.
doi: 10.1016/j.cell.2024.07.002. Epub 2024 Jul 31.

The choroid plexus synergizes with immune cells during neuroinflammation

Affiliations

The choroid plexus synergizes with immune cells during neuroinflammation

Huixin Xu et al. Cell. .

Abstract

The choroid plexus (ChP) is a vital brain barrier and source of cerebrospinal fluid (CSF). Here, we use longitudinal two-photon imaging in awake mice and single-cell transcriptomics to elucidate the mechanisms of ChP regulation of brain inflammation. We used intracerebroventricular injections of lipopolysaccharides (LPS) to model meningitis in mice and observed that neutrophils and monocytes accumulated in the ChP stroma and surged across the epithelial barrier into the CSF. Bi-directional recruitment of monocytes from the periphery and, unexpectedly, macrophages from the CSF to the ChP helped eliminate neutrophils and repair the barrier. Transcriptomic analyses detailed the molecular steps accompanying this process and revealed that ChP epithelial cells transiently specialize to nurture immune cells, coordinating their recruitment, survival, and differentiation as well as regulation of the tight junctions that control the permeability of the ChP brain barrier. Collectively, we provide a mechanistic understanding and a comprehensive roadmap of neuroinflammation at the ChP brain barrier.

Keywords: adhesion molecules; bacterial infection; blood-CSF barrier; choroid plexus; colony-stimulating factor 1; epiplexus macrophages; epithelial cells; immune recruitment; neuroinflammation.


Conflict of interest statement

Declaration of interests J.O.-M. reports compensation for consulting services with Cellarity, Tessel Biosciences, and Radera Biotherapeutics. J.C. has been an employee of Dyne Therapeutics since April 2021. Her contributions to this manuscript were made when she was employed by Boston Children’s Hospital.

Figures
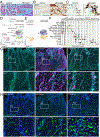
Figure 1.
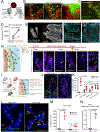
Figure 1.. The ChP is a key site of inflammation in meningitis.
(A-C) Pathology specimens from patients with meningitis and controls analyzed by H&E (A, CSF is pseudo colored in blue), CD45 (B, infiltrated immune cells), and CD163 (C, macrophages). Scale = 100 μm. (D) UMAP embedding of 11,765 immune cells collected from mouse CSF 24 hours or 48 hours following intracerebroventricular injection (ICV) LPS challenge, analyzed via scRNA-seq. Neu = Neutrophil; MΦ = Macrophage; IFN-stim = Interferon-stimulated. (E) UMAP colored by hash call assignment to each treatment group with pooled samples from 5 adult mice, including those without definitive hash identities (”Unassigned”). (F) Violin plot of representative genes used to assign cell type and state identity to clusters. (G) Representative histology images showing accumulation of S100A9+ leukocytes in wholemount mouse ChP explants. Scale = 500 μm (200 μm in G1-G3). (H) Representative images of wholemount mouse explants, showing increasing amounts of CX3CR1+ macrophages with amoeboid morphology following LPS. Scale = 500 μm (200 μm in H1-H3).
Figure 2.
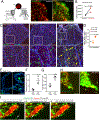
Figure 2.. The ChP allows rapid leukocyte infiltration into the CSF across its epithelial barrier.
(A) Schematic of the cranial window, head post, and injection cannula that allow live two-photon recording of the ChP in awake mice following ICV injections of LPS. (B) Representative still images extracted from 3 serial in vivo imaging sessions of the same mouse, showing the gradual infiltration of Lyz2+ leukocytes into the ChP over the course of 24 hours following LPS ICV delivery. Dotted lines denote major vasculature. See also Video S1. Scale = 100 μm. (C) Representative still images extracted from in vivo imaging showing high numbers of Lyz2+ infiltrating leukocytes both in the ChP and in the CSF, 24 hours following LPS delivery. See also Video S2. Scale = 100 μm. (D) the amplitude of Lyz2+ signal fluorescence 24 hours following LPS was significantly increased from baseline (** p = 0.0078, N=3). (E) Representative image demonstrates spatial correspondence between the in vivo view and the wholemount explant. Scale = 500 μm. (F-G) Representative images of wholemount explants showing selective expression of E-selectin 24 hours following LPS. Scale = 500 μm; Yellow square indicates typical in vivo field of view. (H) Schematic and 6 representative images demonstrating infiltration of Lyz2-ZsGreen S100A9+ immune cells, injected IC 16 hours following LPS ICV, from peripheral blood into the ChP (examples 1–4) and CSF (examples 5–6). Scale = 50 μm. (I) Schematic depicting strategy to breed mice harboring CCR2RFP and tamoxifen-inducible Cx3cr1Zsgreen, which enables simultaneous visualization of infiltrated monocytes and monocytes-derived macrophages (RFP+, ZsGreen-) and resident macrophages (ZsGreen+), in both stromal and epiplexus spaces of the ChP. (J-K) Representative images and counts of fluorescent cells showing significant increases in epiplexus (**** p < 0.0001) and stromal (** p = 0.0016) RFP+ cells, as well as a small, but significant, increase in numbers of of epiplexus ZsGreen+ cells (**** p < 0.0001). Scale = 100 μm. (L-N) Representative images and cell counts showing significant increases in EdU+ CCR2+ monocytes (** p = 0.0028) and EdU+ ZsGreen+ resident macrophages (total: **** p < 0.0001; epiplexus: ** p = 0.0079). Scale = 100 μm. All quantitative data are presented as mean ± SD.
Figure 3.
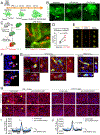
Figure 3.. The ChP recruits macrophages from peripheral monocytes and CSF macrophages.
(A) In vivo imaging schematic (same as Figure 2A) and representative still in vivo images showing increasing numbers of ChP macrophages over the course of 48 hours following LPS delivery. Also see Video S4. Scale = 100 μm. (B) Plot showing significant increase of CX3CR1+ fluorescence signal over the course of 48 hours following LPS ICV delivery (* p = 0.0385, N=3). (C) Representative images from wholemount explant histology, showing increasing numbers of CCR2+ monocytes and CCR2+/CX3CR1+ macrophages following LPS delivery. Scale = 500 μm (200 μm in C1-C3). (D) Quantitative analysis showing increasing number of cells that are CCR2+/CX3CR1+ in ChP wholemount explants. * p = 0.0231, one-way ANOVA. (E-G) Representative images and quantifications showing increases in epiplexus (F, * p = 0.0218) and total (G, ** p = 0.0084) Iba1+ macrophages in the ChP following LPS ICV delivery. Scale = 100 μm. (H) Representative images compressed from one-hour long in vivo video recordings, showing increased numbers of Cx3cr1+ macrophages traveling through CSF (green arrows) following LPS delivery. Also see Video S4. Scale = 100 μm. (I) Representative images showing CX3CR1+ macrophages traveling from CSF and landing on the ChP. Also see Video S7. Scale = 50 μm. All quantitative data are presented as mean ± SD.
Figure 4.
Figure 4.. scRNA-seq of the inflamed ChP reveals complex and dynamic immune signatures to support immune infiltration.
(A) UMAP embedding of 16,291 cells collected from ChP 24 hours or 72 hours following LPS ICV or 24 hours following PBS ICV for scRNA-seq. Neu = Neutrophil; MΦ = Macrophage; Epi = epithelial cells. (B) UMAP as in (A) colored by hash call assignment, including those without definitive hash identities (”Unassigned”). (C) Violin plot of literature-curated marker genes used to assign cell type and state identity to clusters. (D) CellChat analysis showing cell-to-cell interactions mediated by secreted ligand (outgoing) and receptor (incoming) pairs at its peak strength 24 hours after LPS ICV. (E) CellChat analysis showing chemokine signaling from all cell types (outgoing arrows) to immune cells (incoming arrows).
Figure 5.
Figure 5.. Epithelial cells emerge as key coordinators of choroid plexus immune responses.
(A) Violin plot showing expression of extracellular matrix remodeling proteins by epithelial cells, fibroblasts, and other non-immune cells, as well as neutrophils and macrophages of the ChP. (B) Representative images showing increased MMP3 expression in ChP epithelial cells following LPS ICV. Scale = 50 μm. (C) Representative images of wholemount ChP explants showing disrupted patterns of Occludin, Claudin 2, and ZO-1 staining by LPS. Scale = 50 μm. (D) Cellchat analysis showing robust CSF1/M-CSF signaling from ChP epithelial cells, fibroblasts, endothelial cells towards resident and infiltrated macrophages at 24 hours following LPS ICV. (E) Representative images showing increased CSF1/M-CSF protein expression in the ChP 24 hours following LPS ICV. The expression levels were reduced at 72 hours and undetectable in PBS ChP; Scale = 200 μm. (F) Immunoblot of CSF showing increased level of CSF1/M-CSF in CSF from mice 24 hours following LPS ICV delivery. 9 μl of CSF was loaded for each lane. (G-H) Representative images and quantification showing reduced epiplexus macrophages (Iba1+) in mice treated with anti-CSF1/M-CSF antibody ICV following LPS ICV. Scale = 100 μm. (I) Schematics demonstrating the experimental procedure to collect ZsGreen+ brain resident macrophages within LPS-stimulated donor CSF and transplant to LPS-stimulated recipient mice by ICV. (J-K) Representative images and quantifications showing reduced numbers of both ZsGreen+ donor CSF macrophages (* p = 0.0189) and total Iba1+ epiplexus macrophages (**** p < 0.0001) in mice treated ICV with anti-VCAM1/ICAM1 neutralizing antibodies prior to cell transplant. Scale = 100 μm. All quantitative data are presented as mean ± SD.
Figure 6.
Figure 6.. Macrophages at the ChP aided inflammation resolution and barrier repair.
(A) Schematics depicting morphological changes of ChP macrophages following LPS ICV. (B) Representative images extracted from in vivo recordings showing ChP macrophages at baseline and with large vacuoles and forming clusters following LPS ICV. Also see Video S8. Scale = 50 μm. (C) Breeding scheme for TtrmNeon mice to label epithelial cells while expressing Tamoxifen-inducible Cx3cr1TdTomato to label resident macrophages. The image on the right is a representative image extracted from in vivo imaging, demonstrating morphological changes in epiplexus resident ChP macrophages. Also see Video S11. Scale = 50 μm. (D) Quantification showing increased CX3CR1+ resident epiplexus macrophages from baseline to 72 hours following LPS ICV delivery (** p = 0.0034, N=3). (E) Representative images from ImageStream showing Ly6G+ neutrophils internalized by F4/80+ macrophages. Scale = 10 μm. (F) Representative images showing co-localization of Iba1 (macrophage) and S100A9 (neutrophil) by immunohistochemistry. Scale = 50 μm. (G) Representative 3D image and orthogonal views showing epiplexus and stromal CX3CR1+ macrophages that contain Occludin in ChP explants from mice 72 hours following LPS vs. PBS ICV delivery. (H-J) Representative images and line profile quantification showing progressive repair of ChP epithelial tight junctions. Mice treated with anti-VCAM1/ICAM1 neutralizing antibodies (N=4) had delayed Occludin repair compared to controls (N=3). Statistical significance was calculated by the maximum height of peaks. * p = 0.0320. Scale = 50 μm. All quantitative data are presented as mean ± SD.

References

    1. Castellani G, Croese T, Peralta Ramos JM, and Schwartz M (2023). Transforming the understanding of brain immunity. Science 380. 10.1126/science.abo7649. - DOI - PubMed
    1. Engelhardt B, Vajkoczy P, and Weller RO (2017). The movers and shapers in immune privilege of the CNS. Nature immunology 18, 123–131. 10.1038/ni.3666. - DOI - PubMed
    1. Langen UH, Ayloo S, and Gu C (2019). Development and Cell Biology of the Blood-Brain Barrier. Annu Rev Cell Dev Biol 35, 591–613. 10.1146/annurev-cellbio-100617-062608. - DOI - PMC - PubMed
    1. Osborne O, Peyravian N, Nair M, Daunert S, and Toborek M (2020). The Paradox of HIV Blood-Brain Barrier Penetrance and Antiretroviral Drug Delivery Deficiencies. Trends Neurosci 43, 695–708. 10.1016/j.tins.2020.06.007. - DOI - PMC - PubMed
    1. Pellegrini L, Albecka A, Mallery DL, Kellner MJ, Paul D, Carter AP, James LC, and Lancaster MA (2020). SARS-CoV-2 Infects the Brain Choroid Plexus and Disrupts the Blood-CSF Barrier in Human Brain Organoids. Cell stem cell 27, 951–961 e955. 10.1016/j.stem.2020.10.001. - DOI - PMC - PubMed

Substances