

An Infrared Nanospectroscopy Technique for the Study of Electric-Field-Induced Molecular Dynamics
- PMID: 39089683
- PMCID: PMC11328210
- DOI: 10.1021/acs.nanolett.4c01387
An Infrared Nanospectroscopy Technique for the Study of Electric-Field-Induced Molecular Dynamics
Abstract
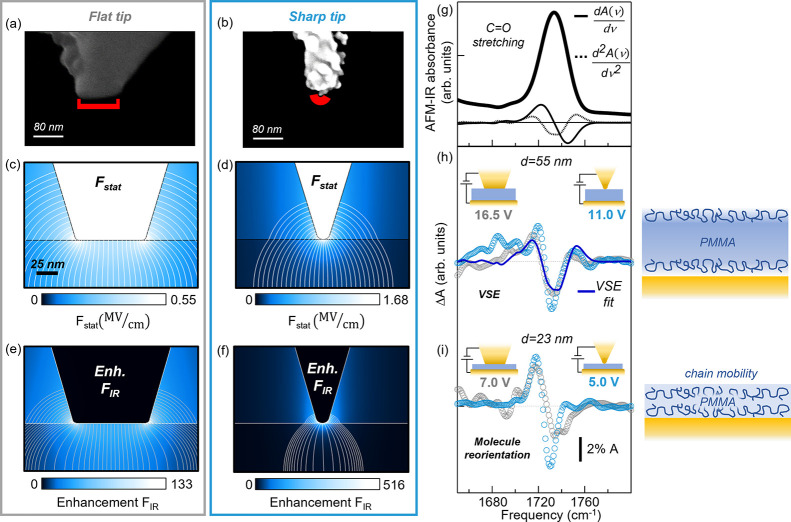
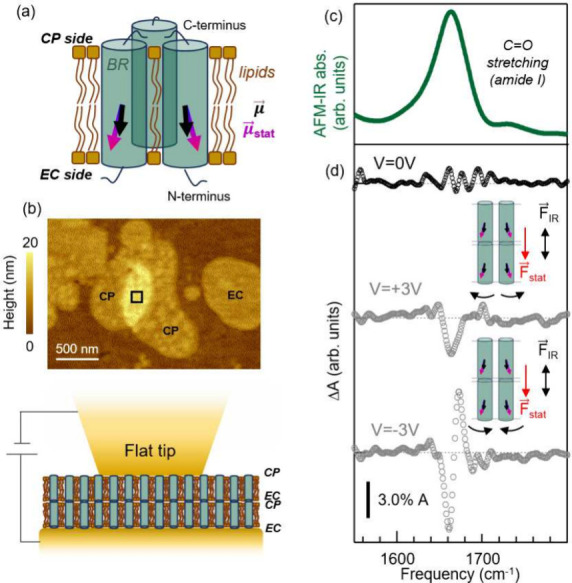
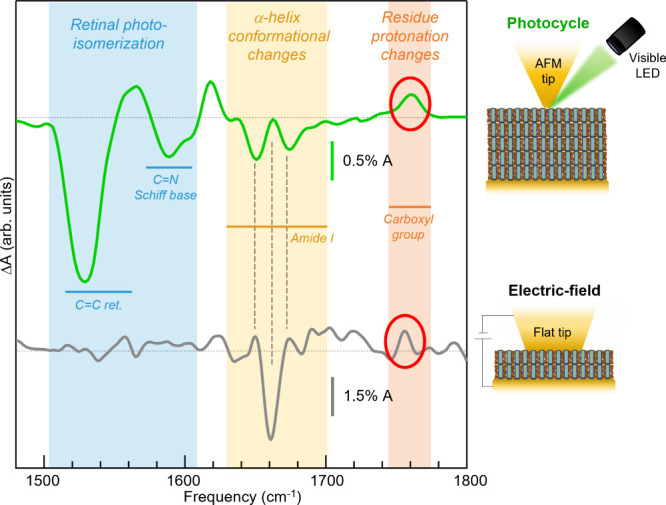
Static electric fields play a considerable role in a variety of molecular nanosystems as diverse as single-molecule junctions, molecules supporting electrostatic catalysis, and biological cell membranes incorporating proteins. External electric fields can be applied to nanoscale samples with a conductive atomic force microscopy (AFM) probe in contact mode, but typically, no structural information is retrieved. Here we combine photothermal expansion infrared (IR) nanospectroscopy with electrostatic AFM probes to measure nanometric volumes where the IR field enhancement and the static electric field overlap spatially. We leverage the vibrational Stark effect in the polymer poly(methyl methacrylate) for calibrating the local electric field strength. In the relevant case of membrane protein bacteriorhodopsin, we observe electric-field-induced changes of the protein backbone conformation and residue protonation state. The proposed technique also has the potential to measure DC currents and IR spectra simultaneously, insofar enabling the monitoring of the possible interplay between charge transport and other effects.
Keywords: IR nanospectroscopy; electric-field-induced molecular dynamics; electrostatic AFM probe; membrane proteins; vibrational Stark effect.
Conflict of interest statement
The authors declare no competing financial interest.
Figures
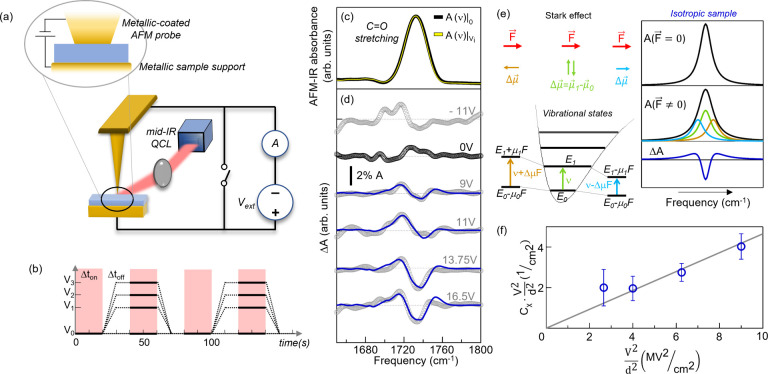
 (empty circles) obtained from
the fitting
curves in (d) using eq 1, highlighting the linear dependence on
(empty circles) obtained from
the fitting
curves in (d) using eq 1, highlighting the linear dependence on  .
.
Similar articles
-
Tip-Enhanced Infrared Difference-Nanospectroscopy of the Proton Pump Activity of Bacteriorhodopsin in Single Purple Membrane Patches.Nano Lett. 2019 May 8;19(5):3104-3114. doi: 10.1021/acs.nanolett.9b00512. Epub 2019 Apr 17. Nano Lett. 2019. PMID: 30950626 Free PMC article.
-
Surface Heterogeneity in Amorphous Silica Nanoparticles Evidenced from Tapping AFM-IR Nanospectroscopy.Anal Chem. 2023 Jan 17;95(2):1505-1512. doi: 10.1021/acs.analchem.2c04533. Epub 2022 Dec 19. Anal Chem. 2023. PMID: 36535897
-
Vibrational Probes: From Small Molecule Solvatochromism Theory and Experiments to Applications in Complex Systems.Acc Chem Res. 2017 Apr 18;50(4):968-976. doi: 10.1021/acs.accounts.7b00002. Epub 2017 Mar 27. Acc Chem Res. 2017. PMID: 28345879
-
Atomic Force Microscopy-Based Nanoscale Infrared Techniques for Catalysis.J Phys Chem Lett. 2023 Dec 21;14(50):11318-11323. doi: 10.1021/acs.jpclett.3c02937. Epub 2023 Dec 8. J Phys Chem Lett. 2023. PMID: 38064367 Review.
-
Stark realities.J Phys Chem B. 2009 Mar 12;113(10):2972-83. doi: 10.1021/jp8067393. J Phys Chem B. 2009. PMID: 19708160 Review.
Cited by
-
Effect of RNA on the supramolecular architecture of α-synuclein fibrils.Biophys J. 2025 Jun 17;124(12):2005-2019. doi: 10.1016/j.bpj.2025.04.031. Epub 2025 May 5. Biophys J. 2025. PMID: 40329536 Free PMC article.
References
-
- Xin N.; Guan J.; Zhou C.; Chen X.; Gu C.; Li Y.; Ratner M. A.; Nitzan A.; Stoddart J. F.; Guo X. Concepts in the design and engineering of single-molecule electronic devices. Nature Reviews Physics 2019, 1, 211–230. 10.1038/s42254-019-0022-x. - DOI
-
- Chen H.; Fraser Stoddart J. From molecular to supramolecular electronics. Nature Reviews Materials 2021, 6, 804–828. 10.1038/s41578-021-00302-2. - DOI
LinkOut - more resources
Full Text Sources
Miscellaneous
