. 2024 Jul 31;12(7):e008441.
doi: 10.1136/jitc-2023-008441.

Blockade of glucose-6-phosphate dehydrogenase induces immunogenic cell death and accelerates immunotherapy

Affiliations

Blockade of glucose-6-phosphate dehydrogenase induces immunogenic cell death and accelerates immunotherapy

Motoki Nakamura et al. J Immunother Cancer. .

Abstract

Background: Enhanced glucose metabolism has been reported in many cancers. Glucose-6-phosphate dehydrogenase (G6PD) is a rate-limiting enzyme involved in the pentose phosphate pathway, which maintains NADPH levels and protects cells from oxidative damage. We recently found that low G6PD expression correlates with active tumor immunity. However, the mechanism involving G6PD and tumor immunity remained unclear.

Methods: We conducted in vitro studies using G6PD-knocked down malignant melanoma cells, pathway analysis using the GEO dataset, in vivo studies in combination with immune checkpoint inhibitors (ICIs) using a mouse melanoma model, and prognostic analysis in 42 melanoma patients and 30 lung cancer patients who were treated with ICIs.

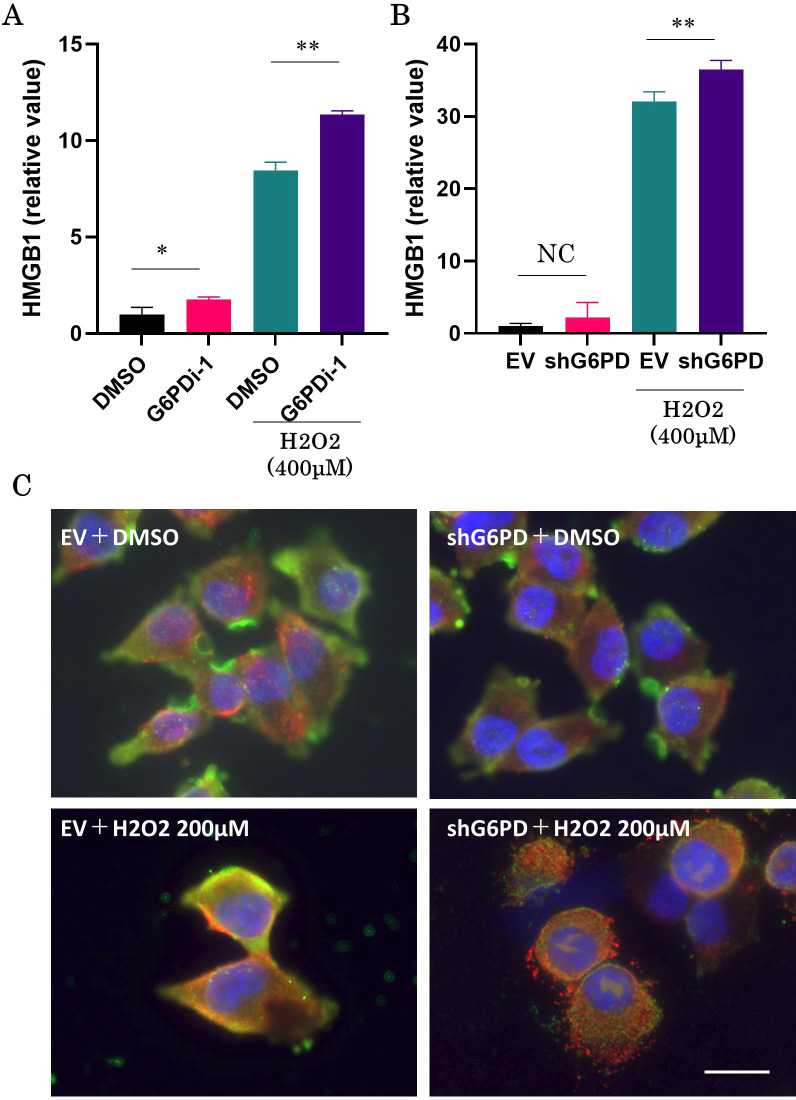
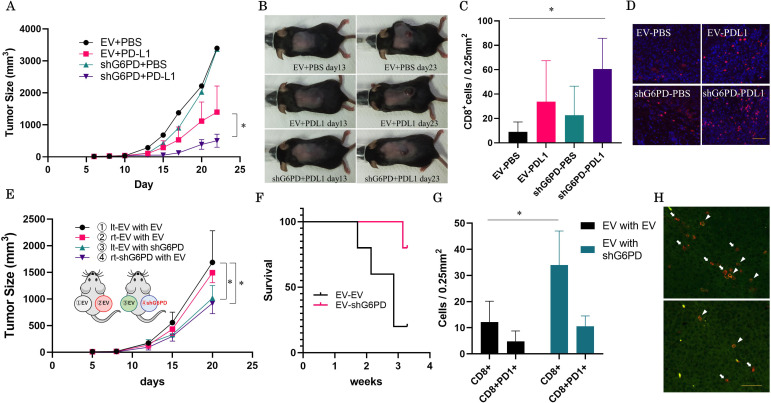
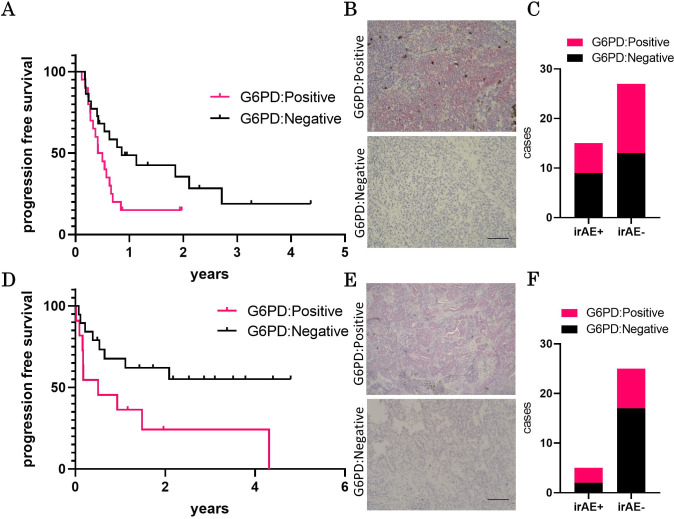
Results: Inhibition of G6PD, both chemically and genetically, has been shown to decrease the production of NADPH and reduce their oxidative stress tolerance. This leads to cell death, which is accompanied by the release of high mobility group box 1 and the translocation of calreticulin to the plasma membrane. These findings suggested that inhibiting G6PD can induce immunogenic cell death. In experiments with C57BL/6 mice transplanted with G6PD-knockdown B16 melanoma cells and treated with anti-PD-L1 antibody, a significant reduction in tumor size was observed. Interestingly, inhibiting G6PD in only a part of the lesions increased the sensitivity of other lesions to ICI. Additionally, out of 42 melanoma patients and 30 lung cancer patients treated with ICIs, those with low G6PD expression had a better prognosis than those with high G6PD expression (p=0.0473; melanoma, p=0.0287; lung cancer).

Conclusion: G6PD inhibition is a potent therapeutic strategy that triggers immunogenic cell death in tumors, significantly augmenting the efficacy of immunotherapies.

Keywords: Immune Checkpoint Inhibitors; Immunotherapy; Melanoma; Non-Small Cell Lung Cancer.


Conflict of interest statement

Competing interests: Nagoya City University is submitting patents for the G6PD test methods. MN invented the G6PD test method.

Figures

Figure 1
Figure 1. Glucose-6-phosphate dehydrogenase (G6PD) inhibition in melanoma cell lines. G6PD expression in each melanoma cell line was quantified by qRT-PCR. A375 melanoma cells had the highest G6PD expression compared with other cell lines (p=0.0014, Dunnett’s test) (A). Each melanoma cell line was analyzed for resistance to oxidative damage in an XTT assay in a dose course of H2O2. A375 melanoma cells were significantly more resistant to oxidative damage than the other cell lines (p=0.0489, Dunnett’s test) (B). G6PD in melanoma cells (COLO679) was inhibited by G6PDi-1 100 µM and decreased expression was confirmed by qRT-PCR (p=0.011, Student’s t-test) (C). COLO679 melanoma cells showed decreased tolerance to H2O2 in a G6PDi-1 concentration-dependent manner in XTT assay (D). A375 melanoma cells genetically blocked for G6PD with shRNA also showed significantly reduced G6PD expression by qRT-PCR (p<0.00001, Student’s t-test) (E). A375 melanoma cells genetically blocked for G6PD with shRNA were significantly less resistant to oxidative damage when 200 µM H2O2 was added compared with cells transfected with empty vector (p=0.0328, Student’s t-test) (F). NADPH production in COLO679 melanoma cells during G6PD inhibition was measured by the NADP+/NADPH assay. The NADP+/NADPH ratio was increased by the concentration of G6PDi-1 (p≤0.01, Williams’ test) (G). G6PD blocked A375 human melanoma cell line had an increased the NADP+/NADPH ratio (p≤0.05, Student’s t-test) (H). G6PD blocked B16 mouse melanoma cell line had an increased the NADP+/NADPH ratio (p≤0.01, Student’s t-test) (I). Experiments were performed in biological triplicates. Error bars show±SD. *p ≤ 0.05, **p ≤ 0.01. EV, empty vector.
Figure 2
Figure 2. High mobility group box 1 (HMGB1) assay and immunofluorescent of calreticulin. HMGB1 is measured in the culture medium supernatant with or without 400 µM H2O2 and 100 µM G6PDi-1. HMGB1 is elevated in the culture medium of glucose-6-phosphate dehydrogenase (G6PD)-inhibited COLO679 melanoma cells (A). A375 melanoma cells in which G6PD was blocked with shRNA were also treated with 400 µM H2O2, and HMGB1 was measured in the culture medium supernatant 24 hours later. There is no difference in the amount of HMGB1 released without the addition of H2O2, but the addition of H2O2 increases HMGB1 release, significantly more than in melanomas transfected with empty vector (B). Immunofluorescent with calreticulin stained red, β-actin stained green, and nuclei stained blue show calreticulin migrating to the cell membrane surface in melanoma cells with 200 µM H2O2. Scale bar, 20 µm (C). Experiments were performed in biological triplicates. Error bars show±SD. *p ≤ 0.05, **p ≤ 0.01.
Figure 3
Figure 3. In silico analysis. In silico analysis was performed using the profiled data set containing 83 melanoma samples at GEO database (GSE8401). Clustering analysis reveals genes that are downregulated and upregulated in each group. Purple means high expression and green means low expression (A). Genes significantly highly expressed in each group are represented by volcano plots (B). GAGE analysis reveals sets of genes specifically upregulated in the G6PD: low group. Pathway analysis results show that 8 of the top 10 gene sets are endoplasmic reticulum target gene related, reflecting endoplasmic reticulum stress (above connecting 8 dots). Two more gene sets (7th and 8th) and the 14th gene set (B cell activation) are related to lymphocyte activation (C).
Figure 4
Figure 4. Glucose-6-phosphate dehydrogenase (G6PD) inhibition in melanoma mouse model. B16 melanoma cells knocked down G6PD using shRNA plasmid were injected subcutaneously into the back of C57BL/6 mice. Mice injected with B16 melanoma cells transfected with the empty vector (EV) as controls. Experiments were conducted with six mice in each of four groups. Mice treated with anti-PD-L1 antibody had smaller tumor growth than mice injected with PBS. Among those treated with twice-weekly 200 µg/mouse anti-PD-L1 antibody, mice injected with B16 knockdown of G6PD (shG6PD) show significantly smaller tumors than those injected with B16 with the empty vector (p=0.0497, Student’s t-test) (A). Examples of representative mice are shown (B). Fluorescent immunostaining counts of the number of infiltrating CD8-positive cells using tumors obtained on day 23 showed that shG6PD melanomas treated with anti-PD-L1 had significantly more cellular infiltration than other tumors (p=0.027, Tukey test) (C). Representative images of immunofluorescent staining for CD8 (red) (D). Mice were injected subcutaneously with B16 melanoma cells at two sites on either side of the back. One group was injected subcutaneously with EV-transfected tumor on both the left and right sides, and the other group was injected subcutaneously with EV-transfected tumor on the left and a G6PD shRNA-blocked tumor on the right. Both groups were treated with 200 µg/mouse anti-PD-L1 antibody twice a week. Experiments were conducted with five mice in each of two groups. Comparing tumor size after 20 days, not only the shG6PD tumor (p=0.0186, Dunnett’s test) but also the EV-transfected tumors of mice with shG6PD tumors (p=0.0393, Dunnett’s test), significantly inhibited tumor growth compared with mice without blocked G6PD was observed (E). There was a significant difference in survival between the group that blocked G6PD in some tumors and the group that did not. (p=0.0357, log-rank test) (F). Immunohistochemistry comparison of the number of lymphocytes infiltrating EV-transfected tumors on the left back of mice in each group showed that CD8-positive cells were significantly increased in mice with G6PD knockdown tumors on the right back (p=0.0128, Student’s t-test) (G). Representative images of immunofluorescent staining for CD8 (red) and PD1 (green). Arrows point to CD8 alone positive cells, and arrowheads point to double-positive cells for CD8 and PD1. Scale bar, 50 µm (H). All mouse experiments were repeated three times with essentially similar results. *p ≤ 0.05.
Figure 5
Figure 5. Cohort study of melanoma and lung cancer patients. The Glucose-6-phosphate dehydrogenase (G6PD) negative melanoma (n=22) showed longer progression-free survival than the positive melanoma (n=20) (p=0.0473, log-rank test) (A). Representative images of G6PD positive and negative melanoma samples. Scale bar, 100 µm (B). There was no significant difference in the occurrence of grade III or higher irAE in each group (Fisher’s exact test) (C). The G6PD negative lung cancer (n=19) showed longer progression-free survival than the positive lung cancer (n=11) (p=0.0287, log-rank test) (D). Representative images of G6PD positive and negative lung cancer samples. Scale bar, 100 µm (E). There was no significant difference in the occurrence of grade III or higher irAE in each group (Fisher’s exact test) (F).

References

    1. Nakamura M, Nagase K, Yoshimitsu M, et al. Glucose-6-phosphate dehydrogenase correlates with tumor immune activity and programmed death ligand-1 expression in merkel cell carcinoma. J Immunother Cancer. 2020;8:e001679. doi: 10.1136/jitc-2020-001679. - DOI - PMC - PubMed
    1. Stanton RC. Glucose-6-phosphate dehydrogenase, NADPH, and cell survival. IUBMB Life. 2012;64:362–9. doi: 10.1002/iub.1017. - DOI - PMC - PubMed
    1. Luzzatto L, Arese P. Favism and glucose-6-phosphate dehydrogenase deficiency. N Engl J Med. 2018;378:60–71. doi: 10.1056/nejmra1708111. - DOI - PubMed
    1. WARBURG O. On the origin of cancer cells. Science. 1956;123:309–14. doi: 10.1126/science.123.3191.309. - DOI - PubMed
    1. Gatenby RA, Gillies RJ. Why do cancers have high aerobic glycolysis? Nat Rev Cancer. 2004;4:891–9. doi: 10.1038/nrc1478. - DOI - PubMed

MeSH terms

Substances