. 2024 Aug 2;15(1):6506.
doi: 10.1038/s41467-024-50660-y.

A male mouse model for metabolic dysfunction-associated steatotic liver disease and hepatocellular carcinoma

Affiliations

A male mouse model for metabolic dysfunction-associated steatotic liver disease and hepatocellular carcinoma

Byung-Kwan Jeong et al. Nat Commun. .

Abstract

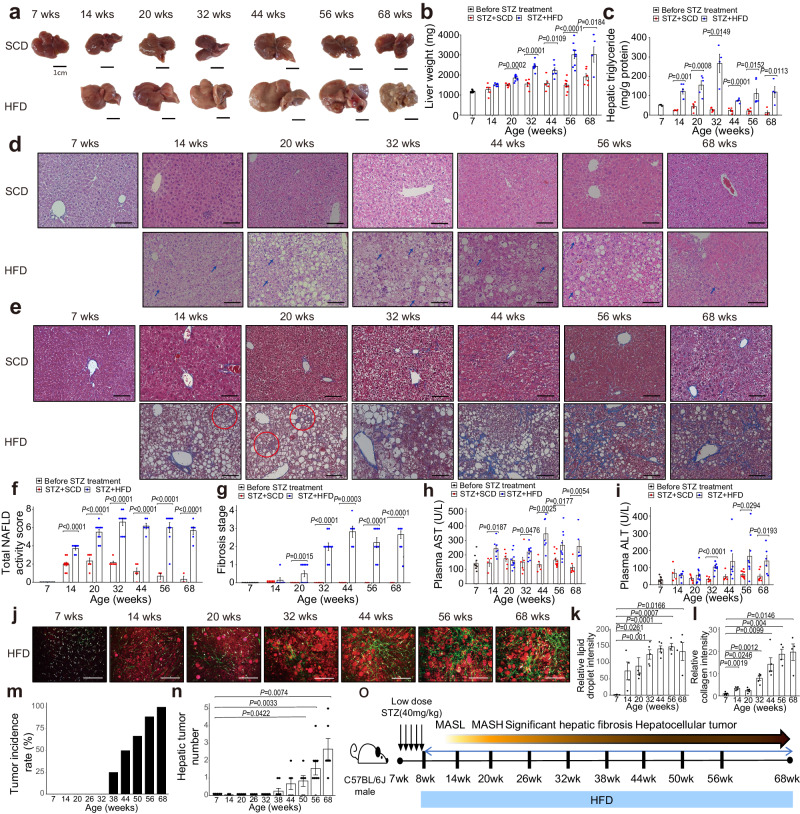
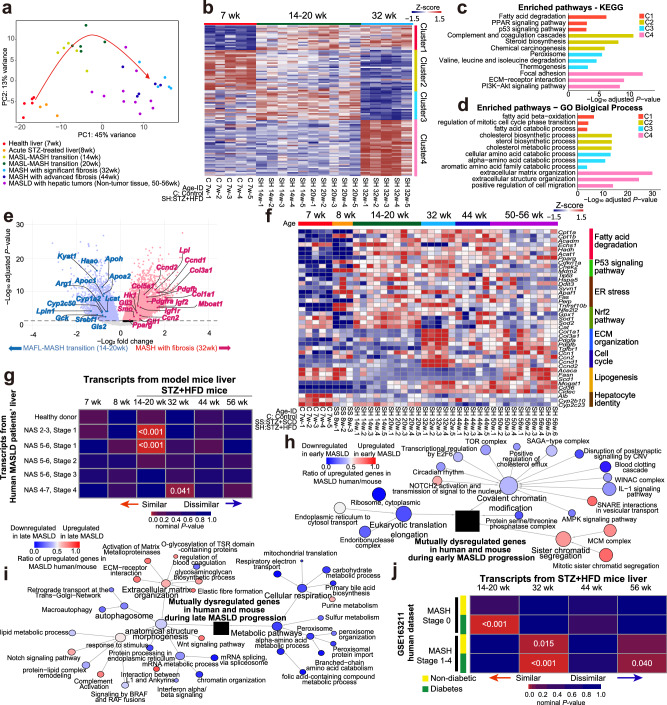
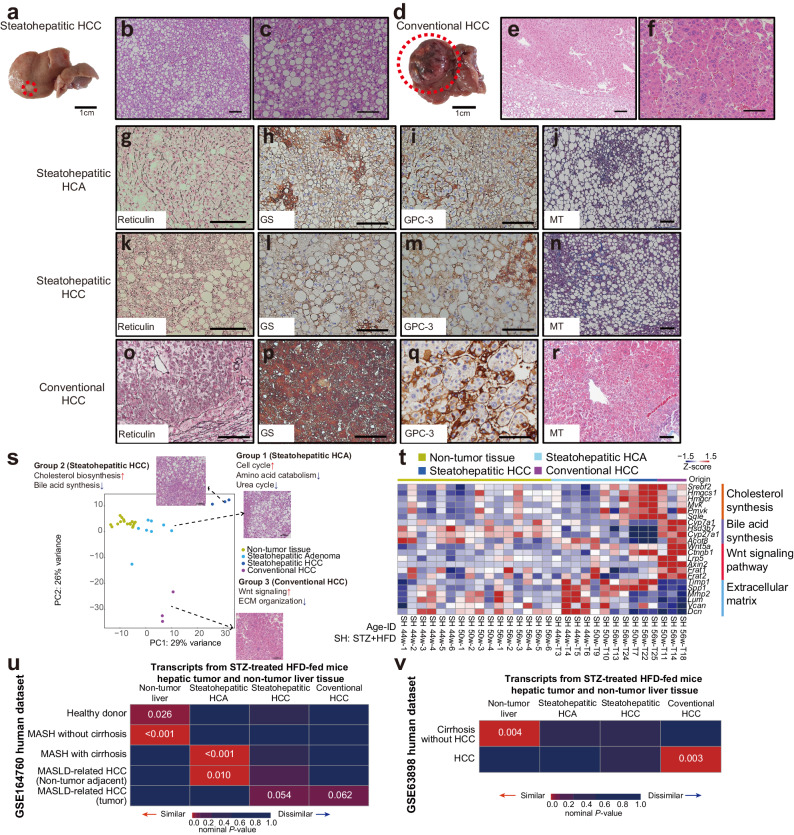
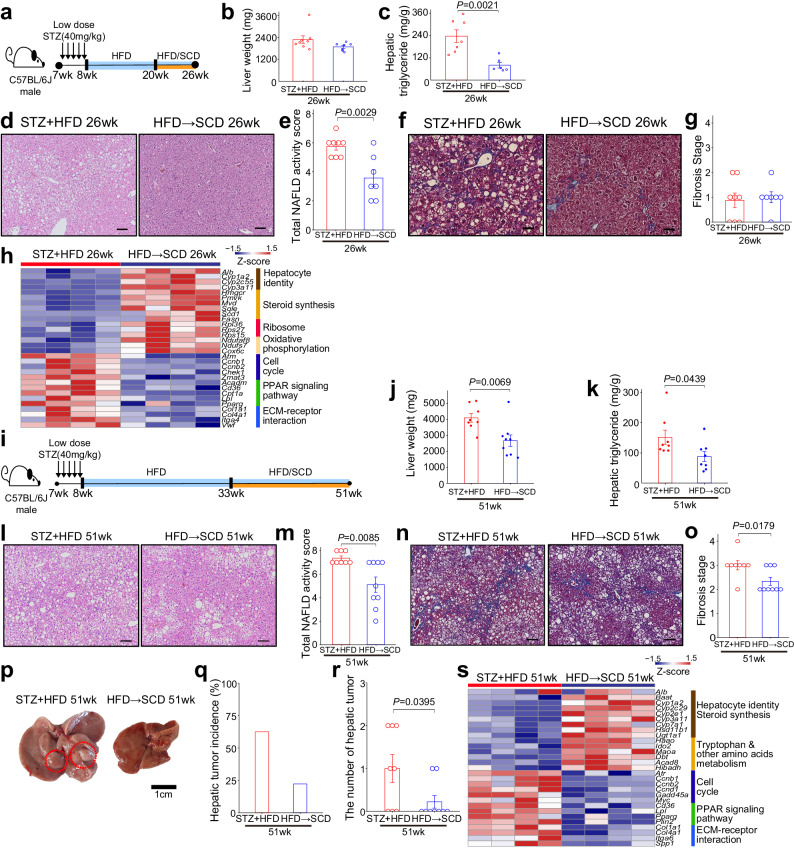
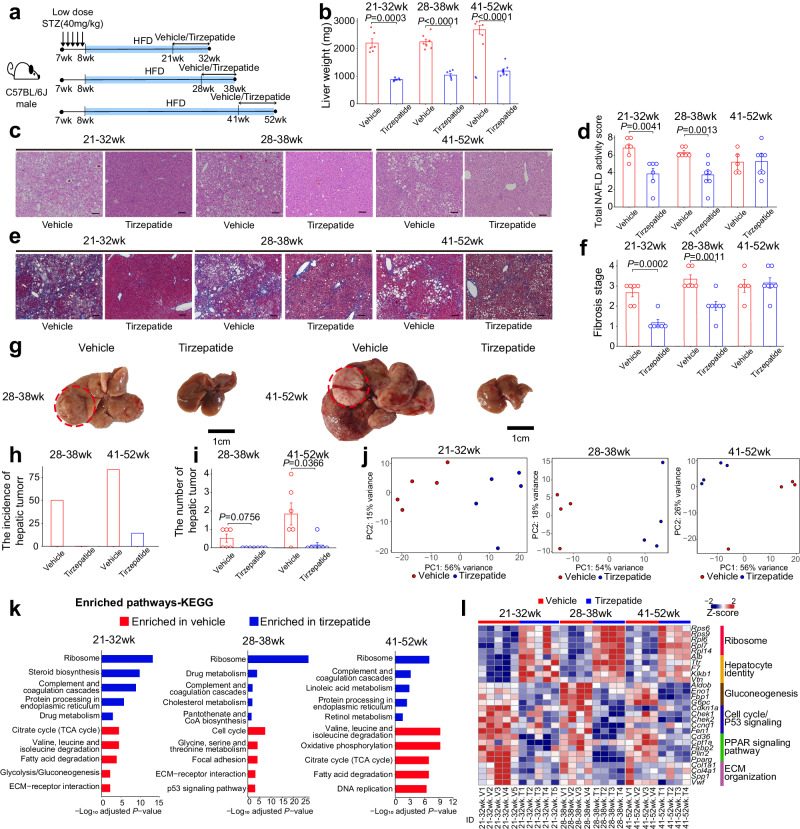
The lack of an appropriate preclinical model of metabolic dysfunction-associated steatotic liver disease (MASLD) that recapitulates the whole disease spectrum impedes exploration of disease pathophysiology and the development of effective treatment strategies. Here, we develop a mouse model (Streptozotocin with high-fat diet, STZ + HFD) that gradually develops fatty liver, metabolic dysfunction-associated steatohepatitis (MASH), hepatic fibrosis, and hepatocellular carcinoma (HCC) in the context of metabolic dysfunction. The hepatic transcriptomic features of STZ + HFD mice closely reflect those of patients with obesity accompanying type 2 diabetes mellitus, MASH, and MASLD-related HCC. Dietary changes and tirzepatide administration alleviate MASH, hepatic fibrosis, and hepatic tumorigenesis in STZ + HFD mice. In conclusion, a murine model recapitulating the main histopathologic, transcriptomic, and metabolic alterations observed in MASLD patients is successfully established.


Conflict of interest statement

The authors declare no competing interests.

Figures

Fig. 1
Fig. 1. HFD feeding after STZ administration induces the whole spectrum of MASLD.
an Seven-week-old B6J mice were treated with STZ and fed SCD (STZ + SCD) or HFD (STZ + HFD) for 6-60 weeks. a Representative liver gross image of STZ-treated mice. Scale bar, 1 cm. b Liver weight; Before STZ treatment, n = 10; STZ + SCD, n = 5, 6, 6, 5, 10, and 6, from 14 to 68-week-old, respectively; STZ + HFD, n = 7, 9, 9, 6, 9, and 5, from 14 to 68-week-old, respectively. c Hepatic triglyceride levels; Before STZ treatment, n = 4; STZ + SCD, n = 4, 6, 6, 5, 5, and 4, from 14 to 68-week-old, respectively; STZ + HFD, n = 6, 5, 4, 5, 6, and 4, from 14 to 68-week-old, respectively. Representative liver histology evaluated via (d) H&E staining and (e) Masson’s trichrome staining for hepatic fibrosis in STZ-treated mice. Blue arrows indicate ballooning degeneration of hepatocytes. Red circles signify perisinusoidal fibrosis. The data are representative results of the biological replicates shown in f and g. Scale bar, 100 μm. f, g Nonalcoholic fatty liver disease score (NAS) and fibrosis stage graded using the NASH CRN scoring system in STZ-treated mice; Before STZ treatment, n = 10; STZ + SCD, n = 10, 6, 6, 5, 3, and 3, from 14 to 68-week-old, respectively; STZ + HFD, n = 7, 10, 10, 6, 9, and 6, from 14 to 68-week-old, respectively. Plasma (h) AST and (i) ALT levels; Before STZ treatment, n = 10; STZ + SCD, n = 10, 6, 6, 5, 5, and 6, from 14 to 68-week-old, respectively; STZ + HFD, n = 7, 10, 10, 6, 9, and 6, from 14 to 68-week-old, respectively. Scale bar, 100 μm. jl Hepatic lipid droplets (red, k) and collagen fibrils (green, l) of STZ + HFD mice assessed via in vivo liver imaging; n = 5, 4, 5, 5, 5, 4, and 4, from 7 to 68-week-old, respectively. Hepatic tumor (m) incidence and (n) number in STZ + HFD mice; n = 10, 7, 10, 8, 10, 8, 6, 6, 9, and 6, from 7 to 68-week-old, respectively. o Comprehensive MASLD progression overview. Data are expressed as means ± SEM. *P < 0.05, **P < 0.01, ***P < 0.001, ****P < 0.0001, compared with the age-matched group, Student’s t-test or Welch’s t-test (b, c, and fi). #P < 0.05, ##P < 0.01, ###P < 0.001, ####P < 0.000, compared with the 7-week-old control group, two-sided Student’s t-test or Welch’s t-test (b, c, fI, k, l, n). Source data are provided as a Source Data file.
Fig. 2
Fig. 2. Molecular characteristics of MASH progression in STZ + HFD mice.
af Liver RNA-seq profiling of 7- to 56-week-old STZ + HFD mice. a Principal component analysis of RNA-seq data showing transcriptomic changes over time (red arrow). b K-means clustering of differentially expressed genes from 7- to 32-week-old STZ + HFD mice. Functional enrichment analyses using EnrichR with c KEGG and d GO biological process pathways for each gene cluster. Benjamini-Hochberg method and Fisher’s exact test were used. e Volcano plot comparing 32-week-old STZ + HFD mouse liver samples with 14 to 20-week-old mouse liver samples using DESeq2. Benjamini-Hochberg method and Fisher’s exact test were used. f Heatmap displaying significant molecular events during MASLD progression in STZ + HFD mice. g Submap clustering analyses with Fisher’s exact test comparing liver RNA-seq data from STZ + HFD mice and human MASLD patients at different NAS/fibrosis stages. Hierarchical clustering with a STRING-based protein interaction network of mutually dysregulated genes in human patients and STZ + HFD mouse liver samples during (h) early (human: NAS 5-6, fibrosis stage 1 versus healthy donors; mouse: 14 to 20-weeks-old STZ + HFD mice versus 7-weeks-old control mice) and (i) late (human: NAS 4-7, fibrosis stage 3-4 versus NAS 5-6, fibrosis stage 1-2; mouse: 32-weeks-old versus 14 to 20-weeks-old STZ + HFD mice) MASLD progression. j Submap clustering analyses with Fisher’s exact test comparing liver RNA-seq data from STZ + HFD mice and human MASH patients with or without coexisting type 2 diabetes.
Fig. 3
Fig. 3. Histopathological and molecular characteristics of hepatic tumors in STZ + HFD mice.
an Hepatic tumors originating from STZ + HFD mice resembling human steatohepatitic hepatocellular carcinoma (HCC) (ac, kn), steatohepatitic hepatocellular adenoma (HCA) (gj), or conventional HCC (df, or). Representative (a) gross and (b, c) microscopic H&E images of hepatic tumor resembling steatohepatitic HCC (Scale bar: a; 1 cm, b, c; 100 μm). The red circle indicates tumor. The data are representative of 6 independent biological replicates. Representative (d) gross and (e, f) microscopic images of hepatic tumor resembling conventional HCC (Scale bar: d; 1 cm, e, f; 100 μm). The red circle indicates tumor. The data are representative of 8 independent biological replicates. Immunohistochemical and histochemical staining of hepatic tumor resembling (gj) steatohepatitic HCA, (kn) steatohepatitic HCC, or (or) conventional HCC (g, k, o; Reticulin, h, l, p; Glutamine synthase (GS), i, m, q; Glypican-3 (GPC-3), j, n, r; Masson’s trichrome (MT), scale bar: 100 μm). The data are representative of (gj) 11, (kn) 6, or (or) 8 independent biological replicates. sv Hepatic tumor and non-tumor liver tissues of 44 to 56-week-old STZ + HFD mice subjected to RNA-seq. s Principal component analyses of RNA-seq data, along with representative H&E images of different tumor groups (Scale bar:100 μm). t Heatmap displaying the top differentially enriched pathways in different tumor groups. u Submap clustering analyses with Fisher’s exact test comparing RNA-seq data of hepatic tumor and non-tumor liver tissues from STZ + HFD mice and human MASLD-related HCC patients (GSE164760). v Submap clustering analyses with Fisher’s exact test comparing RNA-seq data of hepatic tumor and non-tumor liver tissues from STZ + HFD mice and human HCC patients with viral or alcoholic hepatitis (GSE63898).
Fig. 4
Fig. 4. Dietary changes ameliorate MASH, hepatic fibrosis, and hepatic tumorigenesis in STZ + HFD mice.
ah Seven-week-old B6J mice were treated with STZ, fed HFD from 8 to 20 weeks, followed by HFD or SCD (HFD → SCD) until 26 weeks. a Schematic figure. b Liver weight; STZ + HFD, n = 8; HFD → SCD, n = 7. c Hepatic triglyceride levels; STZ + HFD, n = 7; HFD → SCD, n = 6. d Representative liver histology assessed via H&E staining (scale bar, 100 μm). e NAS grading using the NASH CRN scoring system; STZ + HFD, n = 8; HFD → SCD, n = 7. f Representative liver histology with Masson’s trichrome staining (scale bar, 100 μm). g Fibrosis stage grading with the NASH CRN scoring system; STZ + HFD, n = 8; HFD → SCD, n = 7. h Heatmap displaying the top differentially enriched pathways between two groups. i–s Seven-week-old B6J mice were treated with STZ and fed HFD from 8 to 33 weeks, followed by administration of HFD or SCD (HFD → SCD) until 51 weeks. i Schematic figure. j Liver weight; STZ + HFD, n = 8; HFD → SCD, n = 9. k Hepatic triglyceride levels; n = 8 per group. l Representative liver histology evaluation via H&E staining (Scale bar, 100 μm). m NAS grading based on the NASH CRN scoring system; STZ + HFD, n = 8; HFD → SCD, n = 9. n Representative liver histology via Masson’s trichrome staining (Scale bar, 100 μm). o Fibrosis stage grading via the NASH CRN scoring system; STZ + HFD, n = 8; HFD → SCD, n = 9. p Representative liver gross image (Scale bar, 1 cm). Red circles indicate hepatic tumors. Hepatic tumor (q) incidence and (r) number; STZ + HFD, n = 8; HFD → SCD, n = 9. s Heatmap displaying top differentially enriched pathways between two groups. Data are expressed as means ± SEM. *P < 0.05, **P < 0.01, ***P < 0.001, ****P < 0.0001, compared with age-matched group, two-sided Student’s t-test or Welch’s t-test (b, c, e, g, j, k, m, o, r). Source data are provided as a Source Data file.
Fig. 5
Fig. 5. Tirzepatide ameliorates MASH, hepatic fibrosis, and hepatic tumorigenesis in STZ + HFD mice.
al Seven-week-old B6J mice were treated with STZ, fed HFD from 8 weeks onwards, and administered vehicle or tirzepatide for 10–11 weeks from 21, 28, or 41 weeks of age. a Schematic illustration. b Liver weight; Vehicle, n = 6, 7, and 5, from 21–32 to 41–52 weeks, respectively; Tirzepatide, n = 6, 7, and 7, from 21–32 to 41–52 weeks, respectively. c Representative liver histology based on H&E staining (Scale bar, 100 μm). d NAFLD activity score grading using the NASH CRN scoring system; Vehicle, n = 6, 6, and 5, from 21–32 to 41–52 weeks, respectively; Tirzepatide, n = 6, 7, and 7, from 21–32 to 41–52 weeks, respectively. e Representative liver histology determined via Masson’s trichrome staining (Scale bar, 100 μm). f Fibrosis stage grading using the NASH CRN scoring system; Vehicle, n = 6, 6, and 5, from 21–32 to 41–52 weeks, respectively; Tirzepatide, n = 6, 7, and 7, from 21-32 to 41–52 weeks, respectively. g Representative liver gross images from STZ + HFD mice treated with vehicle or tirzepatide at 28–38 or 41–52 weeks of age (Scale bar, 1 cm). Hepatic tumor (h) incidence and (i) number of STZ + HFD mice treated with vehicle or tirzepatide at 28–38 or 41–52 weeks of age; Vehicle, n = 6 per group; Tirzepatide, n = 7 per group. j Principal component analyses of RNA-seq data. k Functional enrichment analyses using KEGG pathways for differentially expressed genes between age-matched groups subjected to tirzepatide treatment and l heatmap displaying the top enriched genes. Benjamini-Hochberg method and Fisher’s exact test were used. Data are expressed as means ± SEM. *P < 0.05, **P < 0.01, ***P < 0.001, ****P < 0.0001, compared with age-matched group, two-sided Student’s t-test or Welch’s t-test (b, d, f, i). Source data are provided as a Source Data file.

Similar articles

Cited by

References

    1. Rinella, M. E. et al. A multisociety Delphi consensus statement on new fatty liver disease nomenclature. J. Hepatol.79, 1542–1556 (2023). - PubMed
    1. Powell, E. E., Wong, V. W. S. & Rinella, M. Non-alcoholic fatty liver disease. Lancet397, 2212–2224 (2021). - PubMed
    1. Teng, M. L. et al. Global incidence and prevalence of nonalcoholic fatty liver disease. Clin. Mol. Hepatol.29, S32–S42 (2023). - PMC - PubMed
    1. Younossi, Z. M. et al. The economic and clinical burden of nonalcoholic fatty liver disease in the United States and Europe. Hepatology64, 1577–1586 (2016). - PubMed
    1. Huang, D. Q., El-Serag, H. B. & Loomba, R. Global epidemiology of NAFLD-related HCC: trends, predictions, risk factors and prevention. Nat. Rev. Gastroenterol. Hepatol.18, 223–238 (2021). - PMC - PubMed

MeSH terms