. 2024 Aug 1;15(1):6192.
doi: 10.1038/s41467-024-49863-0.

Achieving net zero greenhouse gas emissions critical to limit climate tipping risks

Affiliations

Achieving net zero greenhouse gas emissions critical to limit climate tipping risks

Tessa Möller et al. Nat Commun. .

Abstract

Under current emission trajectories, temporarily overshooting the Paris global warming limit of 1.5 °C is a distinct possibility. Permanently exceeding this limit would substantially increase the probability of triggering climate tipping elements. Here, we investigate the tipping risks associated with several policy-relevant future emission scenarios, using a stylised Earth system model of four interconnected climate tipping elements. We show that following current policies this century would commit to a 45% tipping risk by 2300 (median, 10-90% range: 23-71%), even if temperatures are brought back to below 1.5 °C. We find that tipping risk by 2300 increases with every additional 0.1 °C of overshoot above 1.5 °C and strongly accelerates for peak warming above 2.0 °C. Achieving and maintaining at least net zero greenhouse gas emissions by 2100 is paramount to minimise tipping risk in the long term. Our results underscore that stringent emission reductions in the current decade are critical for planetary stability.


Conflict of interest statement

The authors declare no competing interests.

Figures
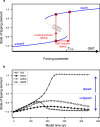
Fig. 1
Fig. 1. Tipping risk and interacting tipping elements.
a Schematic fold-bifurcation diagram of a model tipping element with global mean temperature (GMT) as a forcing parameter and two stable states separated by the unstable manifold. The red arrows indicate the feedback direction of the entire system if a forcing occurs. This means, that if the system is pushed across the unstable manifold, it will move towards the opposite stable equilibrium state. b Illustrative time-evolution of one sample model run of each tipping element: Greenland Ice Sheet (GIS), West Antarctic Ice Sheet (WAIS), Atlantic Meridional Overturning Circulation (AMOC), Amazon Rainforest (AMAZ), including the threshold for state evaluation (dashed grey line).
Fig. 2
Fig. 2. Overview of the input data and dimensions of uncertainty.
a All-sector total greenhouse gas (GHG) emissions for nine investigated scenarios (GHG emissions as considered by the Kyoto Protocol, aggregated with Global Warming Potentials over a period of 100 years, GtCO2eq/year). b Resulting temperature outcomes, including climate response uncertainty, given in °C relative to preindustrial (1850–1900 average). Shaded areas correspond to the 10–90th temperature percentiles, the median is given by the line. Scenario Ref-1p5 has been added for comparison and is only defined in temperature space. c Network of the four investigated tipping elements with interactions: Greenland Ice Sheet (GIS), West Antarctic Ice Sheet (WAIS), Atlantic Meridional Overturning Circulation (AMOC), Amazon Rainforest (AMAZ). Every arrow symbolises a physical interaction mechanism between two tipping elements, categorised as destabilising (+), stabilising (−), or uncertain (±). d Critical temperature ranges under sustained warming for at least the respective tipping timescale, given in °C relative to preindustrial. The ranges of AMOC and AMAZ extend beyond the plot up to 8.0 and 6.0 °C, respectively. Intensifying grey indicates an increasing risk that a threshold will be exceeded, with lines marking the centre estimates. e Timescales of the tipping elements, with centre estimate (dot) and estimated range, from committing the tipping until it is completed. For critical temperature ranges, timescales of tipping, and interactions between tipping elements, also see Supplementary Tables 1 and 2.
Fig. 3
Fig. 3. Tipping risk ranges for all emission scenarios.
a In the medium-term (until 2300) and b in the long-term (50,000 years), with the risk derived from the median temperature trajectory as centre dots and the range spanning the 10-90th temperature percentiles. IPCC likelihood ranges are given on the right. c Peak temperature of the overshoot, d long-term stabilisation temperature relative to pre-industrial, with 1.5 °C as a dashed line, and e duration of the overshoot above 1.5 °C until 2300.
Fig. 4
Fig. 4. Tipping risk for each of the four investigated core climate tipping elements, Greenland Ice Sheet (GIS), West Antarctic Ice Sheet (WAIS), Atlantic Meridional Overturning Circulation (AMOC), Amazon Rainforest (AMAZ).
a Medium-term tipping risk (until 2300). b Long-term tipping risk (model equilibrium). The x-axis accounts for the uncertainties in climate response, with a 90% probability of the temperature outcome exceeding the lower bound (10th percentile), and a 10% probability of the temperature outcome exceeding the upper bound (90th percentile). The y-axis denotes the tipping risk. IPCC likelihood ranges are given on the right.
Fig. 5
Fig. 5. Impact of overshoot peak temperature and non-linear acceleration in tipping risk.
a Increase in tipping risk (%) until 2300 per overshoot peak temperature, for all trajectories with overshoot above 1.5 °C. Each point represents one temperature percentile (10–90%) of a scenario and is coloured by the corresponding scenario information. b Acceleration in tipping risk for overshoot peak temperature. Each point represents the slope of a linear fit through a window of 25 adjacent data points of peak temperature vs. tipping risk (see panel a), thereby denoting the increase in tipping risk for this window, against the mean peak temperature within this window. The sliding window analysis is shown for all four tipping elements separately: Greenland Ice Sheet (GIS), West Antarctic Ice Sheet (WAIS), Atlantic Meridional Overturning Circulation (AMOC), Amazon Rainforest (AMAZ), as well as for the combined risk of the four considered tipping elements (panel b, yellow points). Shaded areas represent the 95% confidence interval.
Fig. 6
Fig. 6. Tipping risk assessed by adherence to the net zero greenhouse gas (NZGHG) criterion.
Each point represents one temperature percentile (10–90%) of a scenario and is coloured by the peak temperature increase. Scenarios were grouped by their adherence to NZGHG (‘NZGHG’: reach NZGHG emissions by 2100 and maintain NZGHG emissions in the long term; ‘No-long-term-NZGHG’: reach NZGHG emissions by 2100, but do not maintain NZGHG emissions in the long term; ‘No-NZGHG’: do not reach NZGHG emissions by 2100) and assessed for both investigated timeframes. Point size is fixed. White boxes indicate the medium-term, grey boxes the long-term, with the upper and lower box edges of the boxplots corresponding to the interquartile ranges of the 25th and 75th percentiles of points per class and the line denoting the median.

References

    1. Lenton, T. M. et al. Tipping elements in the Earth’s climate system. Proc. Natl Acad. Sci. USA105, 1786–1793 (2008). 10.1073/pnas.0705414105 - DOI - PMC - PubMed
    1. Armstrong McKay, D. I. et al. Exceeding 1.5 °C global warming could trigger multiple climate tipping points. Science377, eabn7950 (2022). 10.1126/science.abn7950 - DOI - PubMed
    1. Rahmstorf, S. et al. Thermohaline circulation hysteresis: a model intercomparison. Geophys. Res. Lett.32, L23605 (2005).10.1029/2005GL023655 - DOI
    1. Garbe, J., Albrecht, T., Levermann, A., Donges, J. F. & Winkelmann, R. The hysteresis of the Antarctic Ice Sheet. Nature585, 538–544 (2020). 10.1038/s41586-020-2727-5 - DOI - PubMed
    1. Kriegler, E., Hall, J. W., Held, H., Dawson, R. & Schellnhuber, H. J. Imprecise probability assessment of tipping points in the climate system. Proc. Natl Acad. Sci. USA106, 5041–5046 (2009). 10.1073/pnas.0809117106 - DOI - PMC - PubMed

LinkOut - more resources