. 2024 Aug 1;15(8):554.
doi: 10.1038/s41419-024-06946-6.

M6A-methylated circPOLR2B forms an R-loop and regulates the biological behavior of glioma stem cells through positive feedback loops

Affiliations

M6A-methylated circPOLR2B forms an R-loop and regulates the biological behavior of glioma stem cells through positive feedback loops

Hongda Lin et al. Cell Death Dis. .

Abstract

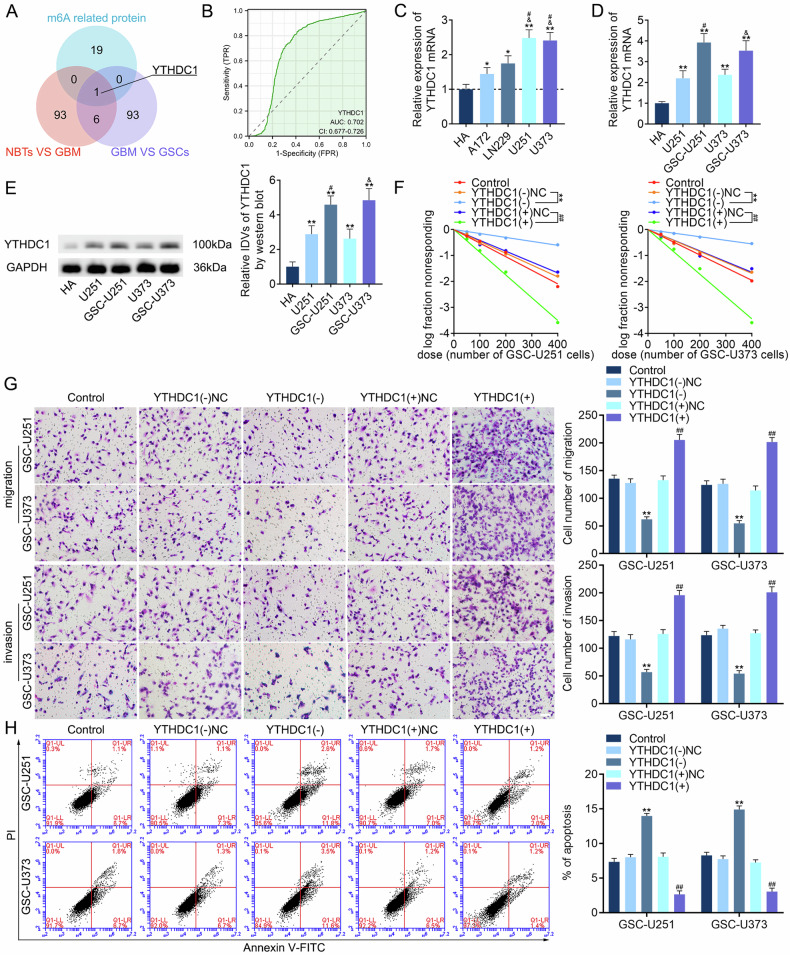
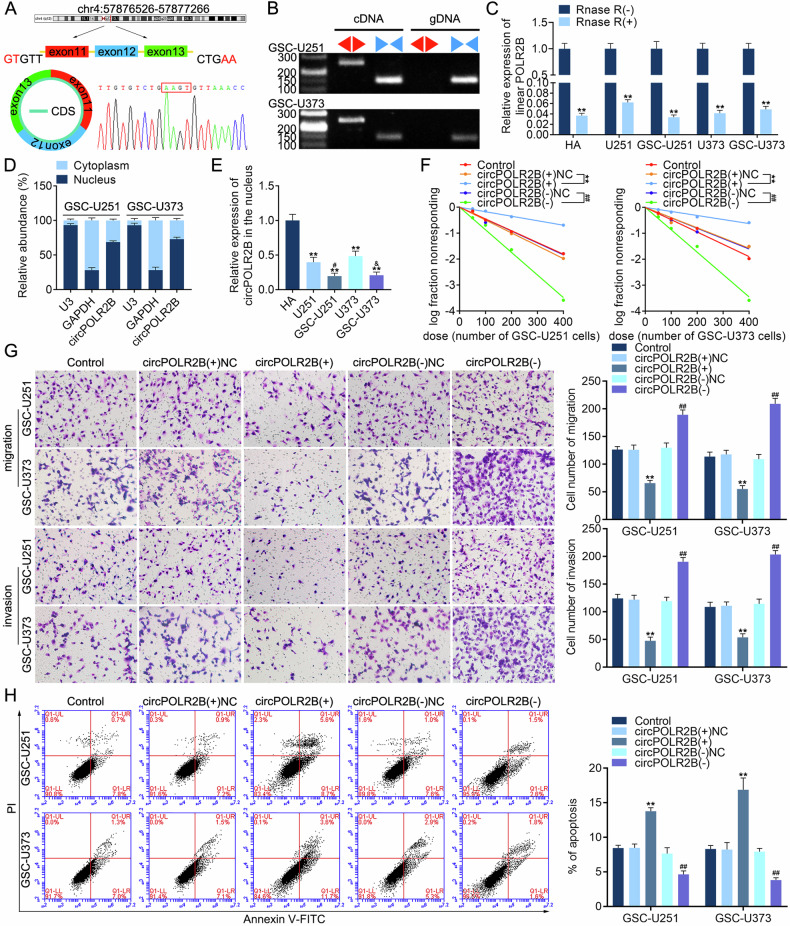
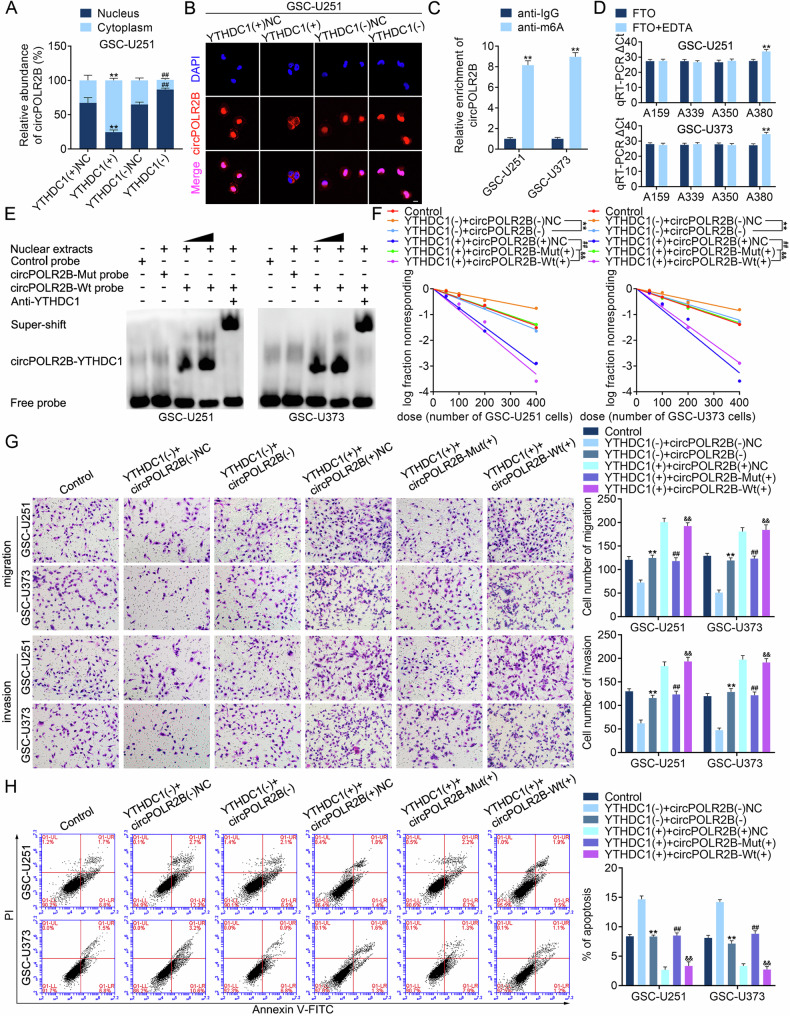
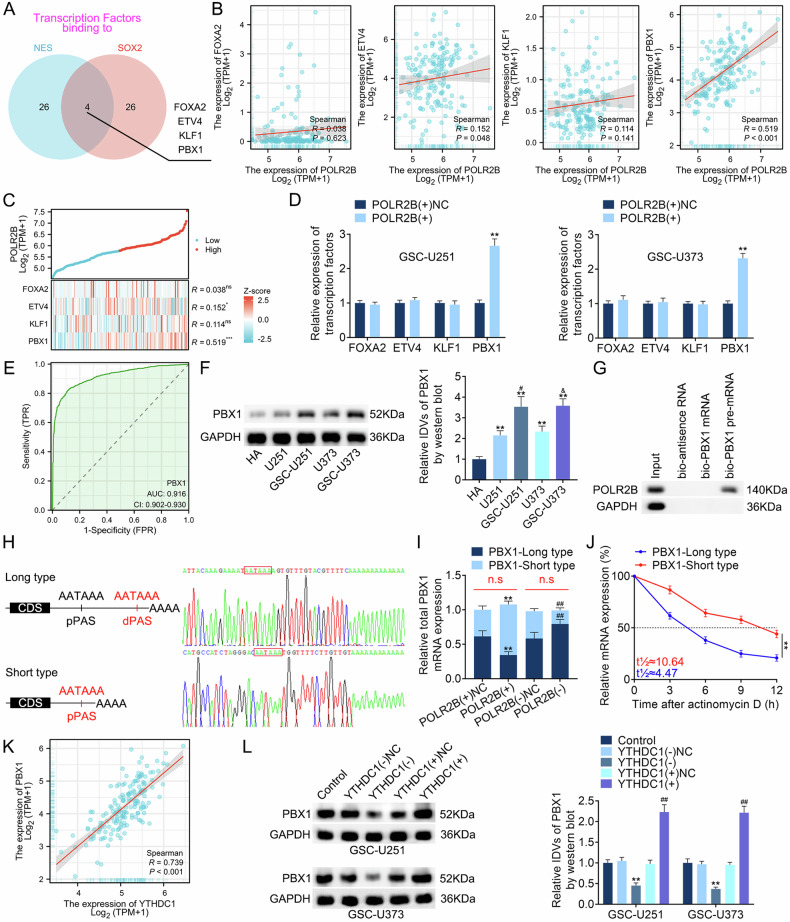
Glioma is the most common primary brain tumor, and targeting glioma stem cells (GSCs) has become a key aspect of glioma treatment. In this study, we discovered a molecular network in which circRNA forms an R-loop structure with its parental gene to regulate the biological behavior of GSCs. Genes with abnormal expression in GSCs were screened using RNA-seq and circRNA microarray analyses. The study results showed that high expression of YTHDC1 in GSCs promoted the transportation of N6-methyladenosine (m6A)-modified circPOLR2B from the nucleus to the cytoplasm. Decreased circPOLR2B levels in the nucleus resulted in fewer R-loop structures formed with its parental gene POLR2B. This reduction in R-loop structures relieved the inhibitory effect on POLR2B transcription and upregulated PBX1 expression through alternative polyadenylation (APA) action, thereby promoting the malignant biological behavior of GSCs. Knockdown of YTHDC1, POLR2B, and PBX1 reduced xenograft tumor volume and prolonged the survival of nude mice. The YTHDC1/circPOLR2B/POLR2B/PBX1 axis plays a regulatory role in the biological behavior of GSCs, offering potential targets and novel strategies for the treatment of glioma.


Conflict of interest statement

The authors declare no competing interests.

Figures

Fig. 1
Fig. 1. High YTHDC1 expression promotes the malignant biological behavior of GSCs.
A Using the GTEx project, TCGA database, and RNA-seq screening, upregulated genes were identified and combined with m6A-related genes to screen YTHDC1. B ROC curve of YTHDC1 gene expression in the GBM queue of TCGA. C YTHDC1 expression in GBM cell lines differs from that in HA. Data are presented as mean ± standard deviation (SD; n = 3, each group). *P < 0.05 compared with the HA group, **P < 0.01 compared with the HA group, #P < 0.05 compared with the A172 group, and &P < 0.05 compared with the LN229 group. D, E The expression of YTHDC1 in HA, U251, GSC-U251, U373, and GSC-U373, and the statistical analysis of integrated densities (IDVs) in each group. Data are presented as mean ± SD (n = 3, each group). **P < 0.01 compared with the HA group, #P < 0.05 compared with the U251 group, and &P < 0.05 compared with the U373 group. F ELDA was used to detect the impact of the knockdown or overexpression of YTHDC1 on the self-renewal ability of GSCs. **P < 0.01 compared with the YTHDC1(−)NC group and ##P < 0.01 compared with the YTHDC1(+)NC group. G The Transwell assay was used to detect the impact of the knockdown or overexpression of YTHDC1 on the migration and invasion ability of GSCs. Data are presented as mean ± SD (n = 3, each group). **P < 0.01 compared with the YTHDC1(−)NC group and ##P < 0.01 compared with the YTHDC1(+)NC group. H Flow cytometry was used to detect the impact of the knockdown or overexpression of YTHDC1 on the apoptosis level of GSCs. Data are presented as mean ± SD (n = 3, each group). **P < 0.01 compared with the YTHDC1(−)NC group and ##P < 0.01 compared with the YTHDC1(+)NC group.
Fig. 2
Fig. 2. CircPOLR2B is downregulated in the nuclei of GSCs and regulates their biological behavior.
A CircPOLR2B derived from POLR2B pre-mRNA exons 11–13 and confirmed by Sanger sequencing across the junction region. B PCR with diverging (red) and converging primers (blue) were used to detect circPOLR2B in cDNA and gDNA. C The qRT-PCR assay was used to detect the digestion efficiency of RNase R. Data are presented as mean ± SD (n = 3, each group). **P < 0.01 compared with the RNase R(−) group. D The qRT-PCR assay determined that circPOLR2B is codistributed in the nucleus and cytoplasm and is more concentrated in the nucleus. GAPDH and U3 served as internal references for the cytoplasm and nucleus. E Expression of circPOLR2B in HA, U251, GSC-U251, U373, and GSC-U373. Data are presented as mean ± SD (n = 3, each group). **P < 0.01 compared with the HA group, #P < 0.05 compared with the U251 group, and &P < 0.05 compared with the U373 group. Effects of circPOLR2B on the self-renewal (F), migration and invasion (G), and apoptosis levels (H) of GSC-U251 and GSC-U373. **P < 0.01 compared with the circPOLR2B(+)NC group and ##P < 0.01 compared with the circPOLR2B(−)NC group. The scale bar represents 10 μm.
Fig. 3
Fig. 3. YTHDC1 regulates the nuclear–cytoplasmic distribution of circPOLR2B through m6A methylation modifications.
A, B qRT-PCR and FISH assays showed that after the overexpression of YTHDC1 in GSC-U251, circPOLR2B in the nucleus transferred to the cytoplasm, while knockdown of YTHDC1 resulted in circPOLR2B remaining in the nucleus (the scale bar represents 10 μm). Data are presented as mean ± SD (n = 3, each group). **P < 0.01 compared with the YTHDC1(+)NC group, and ##P < 0.01 compared with the YTHDC1(−)NC group. C The MeRIP assay showed that circPOLR2B was enriched. Data are presented as mean ± SD (n = 3, each group). **P < 0.01 compared with the anti-immunoglobulin G (IgG) group. D qRT-PCR showed difficulty in amplifying circPOLR2B at A380. Data are presented as mean ± SD (n = 3, each group). **P < 0.01 compared with the FTO group. E The EMSA assay confirmed the binding of YTHDC1 to the circPOLR2B A380 site. Effects of YTHDC1 and circPOLR2B-Mut or circPOLR2B-Wt on the self-renewal (F), migration and invasion (G), and apoptosis levels (H) of GSC-U251 and GSC-U373. **P < 0.01 compared with the YTHDC1(−) + circPOLR2B(−)NC group, ##P < 0.01 compared with the YTHDC1(+) + circPOLR2B(+)NC group, and &&P < 0.01 compared with the YTHDC1(+) + circPOLR2B-Mut(+) group. The scale bar represents 10 μm.
Fig. 4
Fig. 4. CircPOLR2B forms an R-loop structure with the parent gene POLR2B.
A POLR2B expression is higher in tumor tissues than in normal tissues. B Expression of POLR2B in HA, U251, GSC-U251, U373, and GSC-U373; the IDVs in each group were statistically analyzed. Data are presented as mean ± SD (n = 3, each group). **P < 0.01 compared with the HA group, #P < 0.05 compared with the U251 group, and &P < 0.05 compared with the U373 group. C ROC curve of POLR2B expression in TCGA–GBM queue. D The effects of the overexpression or knockdown of circPOLR2B on POLR2B expression; the IDVs in each group were statistically analyzed. Data are presented as mean ± SD (n = 3, each group). **P < 0.01 compared with the circPOLR2B(+)NC group and ##P < 0.01 compared with the circPOLR2B(−)NC group. E After treatment with RNase H, DNase I, or RNase R, the S9.6 dot blot assay was performed. F CircPOLR2B was enriched in the DRIP assay. Data are presented as mean ± SD (n = 3, each group). **P < 0.01 compared with the anti-IgG group. G CircPOLR2B combined with its parent gene POLR2B gDNA to form an R-loop structure. The nucleus was stained with DAPI (scale, 10 μm). H The RNAFOLD web server was used to predict the secondary structure of circPOLR2B.
Fig. 5
Fig. 5. CircPOLR2B regulates POLR2B expression at exon 15.
A Sanger sequencing confirmed that circPOLR2B is truncated at exon 15 of the POLR2B gene and generates ΔPOLR2B mRNA. B After overexpressing circPOLR2B, ΔPOLR2B mRNA expression is upregulated, while normal POLR2B mRNA expression is downregulated. Data are presented as mean ± SD (n = 3, each group). **P < 0.01 compared with the circPOLR2B(+)NC group. C The overexpression of circPOLR2B in 293T cells resulted in the decreased fluorescence activity of the construction vector containing the exon 15 sequence. Data are presented as mean ± SD (n = 3, each group). **P < 0.01 compared with the circPOLR2B(+)NC group. D After the overexpression of circPOLR2B, the expression of exon 15 and subsequent exons of POLR2B was downregulated. Data are presented as mean ± SD (n = 3, each group). **P < 0.01 compared with the circPOLR2B(+)NC group. E After actinomycin D treatment, the relationship between the half-lives of POLR2B mRNA and ΔPOLR2B mRNA was analyzed. Data are presented as mean ± SD (n = 3, each group). **P < 0.01 compared with the POLR2B mRNA group. F An additional protein was pulled down against the POLR2B-N-terminal antibody and confirmed by mass spectrometry to be the truncated ΔPOLR2B protein. G ΔPOLR2B expression upregulation and normal POLR2B protein expression downregulation after overexpressing circPOLR2B; the IDVs in each group were statistically analyzed. Data are presented as mean ± SD (n = 3, each group). **P < 0.01 compared with the circPOLR2B(+)NC group. H Protein half-life after treating cells with CHX; the IDVs in each group were statistically analyzed. Data are presented as mean ± SD (n = 3, each group). **P < 0.01 compared with the POLR2B group. I, J After YTHDC1 overexpression in GSCs, the formation of the R-loop structure by circRNAs was reduced, while the enrichment of circPOLR2B was reduced in DRIP. Data are presented as mean ± SD (n = 3 in each group). **P < 0.01 compared with the YTHDC1(+)NC group. K TCGA–GBM database showcased the relationship between the expression levels of YTHDC1 and POLR2B. L Effects of YTHDC1 on POLR2B expression; the IDVs in each group were statistically analyzed. Data are presented as mean ± SD (n = 3, each group). **P < 0.01 compared with the YTHDC1(−)NC group and ##P < 0.01 compared with the YTHDC1(+)NC group.
Fig. 6
Fig. 6. POLR2B regulates PBX1 expression through APA action.
A Transcription factors that bind to the NES and SOX2 promoter regions were screened in the HumanTFDB. B TCGA–GBM database showcased the expression levels of POLR2B and four transcription factors. C Co-expression heatmap of POLR2B with FOXA2, ETV4, KLF1, and PBX1. D After POLR2B overexpression, PBX1 upregulation was significant. Data are presented as mean ± SD (n = 3, each group). **P < 0.01 compared with the POLR2B(+)NC group. E ROC curve of PBX1 expression in the GBM queue of TCGA. F The expression of PBX1 in HA, U251, GSC-U251, U373, and GSC-U373. Data are presented as mean ± SD (n = 3, each group). **P < 0.01 compared with the HA group, #P < 0.05 compared with the U251 group, and &P < 0.05 compared with the U373 group. G RNA pull-down assay showed that POLR2B binds to PBX1 pre-mRNA. H The 3′RACE assay collected two different lengths of PBX1 mRNA in the 3′-UTR region, which were confirmed by Sanger sequencing. I Overexpression or knockdown of POLR2B changed only the length of the 3′-UTR region of PBX1 mRNA and did not alter the overall expression of PBX1 mRNA. Data are presented as mean ± SD (n = 3 in each group). **P < 0.01 compared with the POLR2B(+)NC group, and ##P < 0.01 compared with the POLR2B(−)NC group. The sum of PBX1-long type and PBX1-short type was non-sense (n.s) (red) compared with the POLR2B(+)NC or POLR2B(−)NC group. J qRT-PCR was used to detect the half-lives of the PBX1-long type and PBX1-short type. Data are presented as mean ± SD (n = 3, each group). **P < 0.01 compared with the PBX1-long type group. K TCGA–GBM database showcased the relationship between the expression levels of YTHDC1 and PBX1. L Effects of YTHDC1 on PBX1 expression; the IDVs in each group were statistically analyzed. Data are presented as mean ± SD (n = 3, each group). **P < 0.01 compared with the YTHDC1(−)NC group and ##P < 0.01 compared with the YTHDC1(+)NC group.
Fig. 7
Fig. 7. PBX1 transcription promotes the expression of NES, SOX2, and YTHDC1.
AC The ChIP assay determined that PBX1 binds to the promoter regions of NES, SOX2, and YTHDC1. The relative luciferase activity of different report vectors in 293T cells is shown. Data are presented as mean ± SD (n = 3, each group). **P < 0.01 compared with the pEX3 empty vector group.
Fig. 8
Fig. 8. Tumor xenotransplantation and diagram of the YTHDC1/circPOLR2B/POLR2B/PBX1 pathway.
A Tumor formation in nude mice carrying GSC-U251 and GSC-U373 cell suspensions. Tumor samples removed from each group are shown in the figure. B The tumor growth curve shows that after injections of GSC-U251 and GSC-U373 cell suspensions, the tumor volumes were calculated every 5 d. The tumors were removed after 45 d. Data are presented as mean ± SD (n = 3, each group). **P < 0.01 compared with the control group and ##P < 0.01 compared with the YTHDC1(−), POLR2B(−), or PBX1(−) groups. C Survival curve of nude mice with orthotopic xenografts (n = 8, each group). **P < 0.01 compared with the control group, ##P < 0.01 compared with the YTHDC1(−), POLR2B(−), or PBX1(−) groups. D Molecular mechanisms of the YTHDC1/circPOLR2B/POLR2B/PBX1 pathway in GSCs.

Similar articles

Cited by

References

    1. Ma R, Taphoorn MJB, Plaha P. Advances in the management of glioblastoma. J Neurol Neurosurg Psychiatry. 2021;92:1103–11. 10.1136/jnnp-2020-325334 - DOI - PubMed
    1. Yang K, Wu Z, Zhang H, Zhang N, Wu W, Wang Z, et al. Glioma targeted therapy: insight into future of molecular approaches. Mol Cancer. 2022;21:39. 10.1186/s12943-022-01513-z - DOI - PMC - PubMed
    1. Venkataramani V, Yang Y, Schubert MC, Reyhan E, Tetzlaff SK, Wißmann N, et al. Glioblastoma hijacks neuronal mechanisms for brain invasion. Cell. 2022;185:2899–2917.e31. - PubMed
    1. Reya T, Morrison SJ, Clarke MF, Weissman IL. Stem cells, cancer, and cancer stem cells. Nature. 2001;414:105–11. 10.1038/35102167 - DOI - PubMed
    1. Zhang R, Tu J, Liu S. Novel molecular regulators of breast cancer stem cell plasticity and heterogeneity. Semin Cancer Biol. 2022;82:11–25. 10.1016/j.semcancer.2021.03.008 - DOI - PubMed

MeSH terms

LinkOut - more resources