. 2024 Aug 1;15(1):6480.
doi: 10.1038/s41467-024-50806-y.

Tregs delivered post-myocardial infarction adopt an injury-specific phenotype promoting cardiac repair via macrophages in mice

Affiliations

Tregs delivered post-myocardial infarction adopt an injury-specific phenotype promoting cardiac repair via macrophages in mice

Yasmin K Alshoubaki et al. Nat Commun. .

Abstract

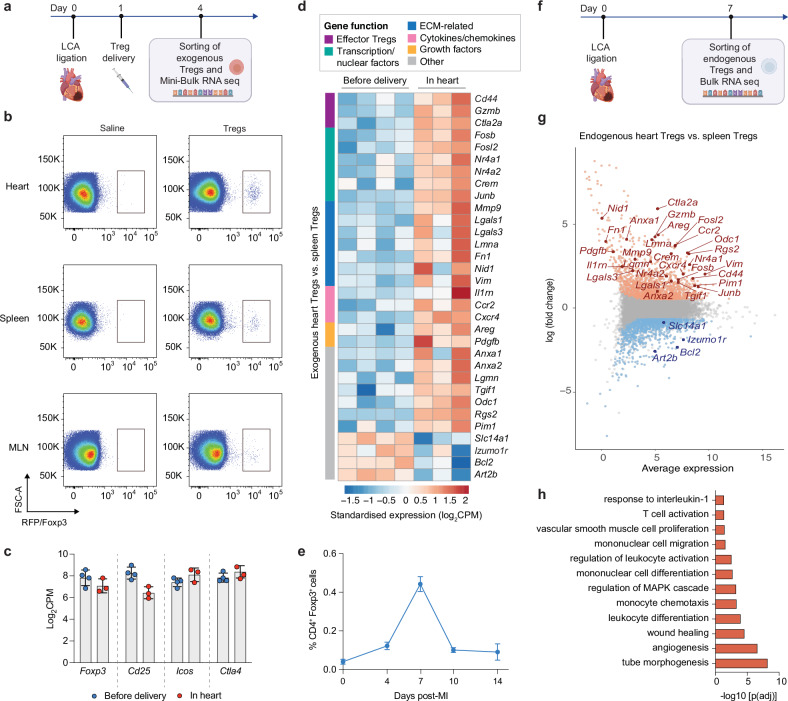
Regulatory T cells (Tregs) are key immune regulators that have shown promise in enhancing cardiac repair post-MI, although the mechanisms remain elusive. Here, we show that rapidly increasing Treg number in the circulation post-MI via systemic administration of exogenous Tregs improves cardiac function in male mice, by limiting cardiomyocyte death and reducing fibrosis. Mechanistically, exogenous Tregs quickly home to the infarcted heart and adopt an injury-specific transcriptome that mediates repair by modulating monocytes/macrophages. Specially, Tregs lead to a reduction in pro-inflammatory Ly6CHi CCR2+ monocytes/macrophages accompanied by a rapid shift of macrophages towards a pro-repair phenotype. Additionally, exogenous Treg-derived factors, including nidogen-1 and IL-10, along with a decrease in cardiac CD8+ T cell number, mediate the reduction of the pro-inflammatory monocyte/macrophage subset in the heart. Supporting the pivotal role of IL-10, exogenous Tregs knocked out for IL-10 lose their pro-repair capabilities. Together, this study highlights the beneficial use of a Treg-based therapeutic approach for cardiac repair with important mechanistic insights that could facilitate the development of novel immunotherapies for MI.


Conflict of interest statement

The authors declare no competing interests.

Figures

Fig. 1
Fig. 1. Systemic delivery of exogenous Tregs post-MI improves the cardiac repair outcome.
aj LCA ligation was performed in wild-type (wt) mice. Mice received a systemic injection of saline or Tregs, 1 day after MI. The experimental design is shown in (a). b Representative parasternal long-axis views of the left ventricles. Scale bar: 2 mm. c Left ventricular ejection fraction (n = 9). d Left ventricular end diastolic volume in µl measured by echocardiography at baseline, 7 and 28 days post-MI (n = 9). e Quantification of fibrosis by histology expressed as percentage of the left ventricular area (n = 9). f Representative histology of whole transverse heart sections from apex to base, after Masson’s Trichrome staining, 28 days post-MI. Scale bar: 2 mm. g Representative sections of the heart 3 days post-treatment with staining of apoptotic cells in red (TUNEL assay), cell border (wheat germ agglutinin, WGA; in green), and nuclei in blue (in blue). Scale bar: 100 μm. h Quantification of TUNEL+ cardiomyocytes (CMs) (n = 5). i Representative immunostaining of heart sections for endothelial cells (CD31, in red)) and nuclei (in blue) 28 days post-MI. Scale bar: 100 μm. j Quantification of immunostaining for CD31 (n = 9). For all graphs, boxes show median (centre line) and interquartile range (edges), whiskers show the range of values and dots represent individual data points. Two-way ANOVA with Bonferroni post-hoc test for pair-wise comparisons was used to compare the groups in (c, d). Two-tailed Student’s t-test was used to compare the groups in (e, h, j). P-values are indicated. Panel (a) created with BioRender.com released under a Creative Commons Attribution-NonCommercial-NoDerivs 4.0 International license (https://creativecommons.org/licenses/by-nc-nd/4.0/deed.en).
Fig. 2
Fig. 2. Exogenous Tregs homing to the heart adopt an injury-specific transcription profile similar to endogenous heart Tregs.
ad Mice received a systemic injection of saline or Tregs (from Foxp3IRES-mRFP mice), 1 day post-MI. Four days post-MI, the delivered red-fluorescent protein (RFP) positive Tregs were sorted from the heart, spleen, and mediastinum lymph nodes (MLN) for bulk RNA sequencing. The experimental timeline is shown in (a). b Flow cytometry plots showing RFP+ Tregs gated from total CD3+ cells in the heart, spleen and MLN 4 days post-MI. c Count per million (CPM) plots depicting gene expression levels of classic Treg markers in exogenous Tregs before delivery and exogenous Tregs recovered from the heart (data are presented as mean ± SD, n = 3–4/group). d Heat map of selected significantly upregulated genes depicting standardised gene expression values in exogenous Tregs before delivery and exogenous Tregs recovered from the heart. Genes are classified according to main known function indicated by the coloured tab next to the heat map. e Accumulation kinetic of endogenous Tregs in the myocardium post-MI. Data are presented as mean ± SD (n = 4). fh Endogenous heart Tregs were sorted and sequenced 7 days post-MI, along with Tregs from spleens of uninjured mice. The experimental timeline is shown in (f). g MA-plot of differentially expressed genes (FDR < 0.05, fold change > |1.5 | ) in Tregs sorted from the infarcted heart vs. Tregs from uninjured spleen. Common genes between the endogenous heart Tregs and the exogenous Tregs in (d) are labelled. Biological replicates are shown and each replicate comes from a pool of > 2 injuries. h GO analysis showing enriched terms from all commonly upregulated genes between endogenous and exogenous Tregs sorted from the heart (FDR < 0.01, adjusted by Benjamini-Hochberg correction). Panels (a, f) created with BioRender.com released under a Creative Commons Attribution-NonCommercial-NoDerivs 4.0 International license (https://creativecommons.org/licenses/by-nc-nd/4.0/deed.en).
Fig. 3
Fig. 3. The pro-repair effect of exogenous Tregs depends on Mo/MΦ.
a, b Wild-type (wt) mice received saline or Tregs 1 day post-MI. Immune cells in the infarct zone were analysed by flow cytometry on days 4, 7 and 10 post-MI. The experimental design is shown in (a). b Number (No.) of Mo/MΦ (CD11b+, F4/80+ cells) per mg of scar tissue, CD206+ expression in Mo/MΦ (represented by the geometric mean fluorescence intensity, MFI), and number of cytotoxic T cells per mg of scar tissue (n = 4). cg Mice received saline or were depleted of Mo/MΦ using clodronate liposomes (CLs) prior to receiving saline or Tregs on day 1 post-MI. The experimental design is shown in (c). d Representative parasternal long-axis views of the left ventricles. The red trace is end-diastolic, and the green is end-systolic. e Left ventricular ejection fraction measured by echocardiography 7 and 28 days post-MI (n = 6). f Representative histology of whole transverse heart sections from apex to base stained with Masson’s Trichrome staining, 28 days post-MI. Scale bar: 2 mm. g Quantification of fibrosis by histology expressed as percentage of the left ventricle (n = 6). For all graphs, boxes show median (centre line) and interquartile range (edges), whiskers show the range of values and dots represent individual data points. Two-way ANOVA with Bonferroni post-hoc test for pair-wise comparisons was used to compare the groups in (b, e). One-way ANOVA with Bonferroni post-hoc test for pair-wise comparisons was used to compare the groups in (g). P values are indicated, n.s. indicates non-significant. Panels (a, c) created with BioRender.com released under a Creative Commons Attribution-NonCommercial-NoDerivs 4.0 International license (https://creativecommons.org/licenses/by-nc-nd/4.0/deed.en).
Fig. 4
Fig. 4. Mo/MΦ adopt a pro-repair profile in response to exogenous Tregs.
ac Endogenous cardiac Mo/MΦ from saline- and Treg-treated groups were sorted and sequenced on days 4 and 7 post-MI (n = 4 for saline, n = 3 for Tregs). The experimental design is shown in (a). b Heat map of selected significantly upregulated and downregulated DEGs (FDR < 0.05) depicting standardised gene expression values on days 4 and 7 post-MI (individual biological replicates are shown). Genes are classified according to function with the coloured tab to the left of the heat map. c GO enriched terms depicting biological processes in the significantly upregulated and downregulated genes in Mo/MΦ following exogenous Treg treatment from days 4 and 7 post-MI (FDR < 0.01, adjusted by Benjamini-Hochberg correction). d, e LCA ligation was performed in wild-type mice, followed by a systemic injection of either saline or Tregs 1 day post-MI. Hearts were collected on day 7 post-MI and stained for F4/80 (green) to identify Mo/MΦs, with proteins of interest (CD206, LYVE1, CD163, and SPARC) in red, and nuclei stained in blue. d Representative images. Scale bar: 100 μm. e Quantification of signal intensity expressed as average raw density per F4/80+ cells (n = 4). For all graphs, Boxes show median (centre line) and interquartile range (edges), whiskers show the range of values and dots represent individual data points. Two-tailed Student’s t-test was used to compare the groups in (e). P values are indicated. Panel (a) created with BioRender.com released under a Creative Commons Attribution-NonCommercial-NoDerivs 4.0 International license (https://creativecommons.org/licenses/by-nc-nd/4.0/deed.en).
Fig. 5
Fig. 5. The absence of Tregs after MI leads to a pro-inflammatory phenotype in cardiac Mo/MΦ.
ac Foxp3DTR/GFP and wild-type control mice received diphtheria toxin (DT) to deplete Tregs in Foxp3DTR/GFP mice. MI was induced by LCA ligation and cardiac Mo/MΦ were sorted on days 4 and 7 post-MI for bulk RNA sequencing. The experimental design is shown in (a). b Heat maps of selected significantly upregulated and downregulated DEGs (FDR < 0.05) depicting standardised gene expression values on days 4 and 7 post-MI (n = 3). Genes are classified according to function with the coloured tab at the bottom of the heat maps. c GO analysis depicting enriched biological processes from commonly upregulated and downregulated DEGs in cardiac Mo/MΦs from Treg-depleted mice across both time points (FDR <  0.01, adjusted by Benjamini-Hochberg correction). Panel (a) created with BioRender.com released under a Creative Commons Attribution-NonCommercial-NoDerivs 4.0 International license (https://creativecommons.org/licenses/by-nc-nd/4.0/deed.en).
Fig. 6
Fig. 6. Exogenous Tregs decrease the Ly6CHi CCR2+ Mo/MΦ subset in the infarct zone.
a, b Mice received saline or Tregs 1 day post-MI, and the number of Ly6CHi CCR2+ Mo/MΦ in the infarct zone was assessed by flow cytometry 3 days post-MI. The experimental design is shown in (a), and the quantification is presented in (b) (n = 4). ch Mice received anti-CCR2 Fc-silent antibody (α-CCR2) prior treatment along with saline or Tregs one day post-MI. The experimental design is shown in (c). d Quantification of the Ly6CHi CCR2+ Mo/MΦ in the blood on day 6 post-MI (n = 6). e Representative parasternal long-axis views of the left ventricle. The red trace is end-diastolic, and the green is end-systolic. f Left ventricular ejection fraction measured by echocardiography on baseline, day 7 and day 28 post-MI (n = 6). g Representative histology of whole transverse heart sections from apex to base stained with Masson’s Trichrome staining, 28 days post-MI. Scale bar: 2 mm. h Quantification of fibrosis by histology expressed as percentage of the left ventricle (n = 6). i Experimental design of the ex vivo culture system with sorted cardiac Mo/MΦ and CD8+ T cells. Mo/MΦ Ly6C expression was measured by flow cytometry (represented by the geometric mean fluorescence intensity, MFI). j Mo/MΦ Ly6C expression expressed as percentage increase relative to high or low numbers of cardiac CD8+ T cells (n = 4). k Mo/MΦ Ly6C expression after stimulation with Treg-derived factors in the presence of IFN-γ (n = 8 for untreated, n = 4 for exogenous Treg-derived factors). l Mo/MΦ Ly6C expression after stimulation with nidogen-1 or IL-10 without IFN-γ (n = 4 for untreated, n = 4 for exogenous Treg-derived factors). For all graphs, boxes show median (centre line) and interquartile range (edges), whiskers show the range of values and dots represent individual data points. Two-tailed Student’s t-test was used to compare the groups in (b, d, j). Two-way ANOVA with Bonferroni post-hoc test for pair-wise comparisons was used to compare the groups in (f). One-way ANOVA with Bonferroni post-hoc test for pair-wise comparisons was used to compare the groups in (k, l). P-values are indicated, n.s. indicates non-significant. Panels (a, c, i) created with BioRender.com released under a Creative Commons Attribution-NonCommercial-NoDerivs 4.0 International license (https://creativecommons.org/licenses/by-nc-nd/4.0/deed.en).
Fig. 7
Fig. 7. Exogenous Tregs primarily exert their therapeutic effect through IL-10.
ae Mice received saline or Tregs from Il10 knockout mice (TregsII10−/−) 1 day post-MI. The experimental design is shown in (a). b Representative parasternal long-axis views of the left ventricle. The red trace is end-diastolic, and the green is end-systolic. Scale bar: 2 mm. c Left ventricular ejection fraction measured by echocardiography 7 and 28 days post-MI (n = 7). d Representative histology of whole transverse heart sections from apex to base stained with Masson’s Trichrome staining, 28 days post-MI. Scale bar: 2 mm. e Quantification of fibrosis by histology expressed as percentage of the left ventricle (n = 7). For all graphs, boxes show median (centre line) and interquartile range (edges), whiskers show the range of values and dots represent individual data points. Two-way ANOVA with Bonferroni post-hoc test for pair-wise comparisons was used to compare the groups in (c). Two-tailed Student’s t-test was used to compare the groups in (e). P-values are indicated, n.s. indicates non-significant. Panel (a) created with BioRender.com released under a Creative Commons Attribution-NonCommercial-NoDerivs 4.0 International license (https://creativecommons.org/licenses/by-nc-nd/4.0/deed.en).

References

    1. Talman, V. & Ruskoaho, H. Cardiac fibrosis in myocardial infarction-from repair and remodeling to regeneration. Cell tissue Res.365, 563–581 (2016). 10.1007/s00441-016-2431-9 - DOI - PMC - PubMed
    1. Ferraro, B. et al. Pro-Angiogenic Macrophage Phenotype to Promote Myocardial Repair. J. Am. Coll. Cardiol.73, 2990 (2019). 10.1016/j.jacc.2019.03.503 - DOI - PubMed
    1. Zhang, R. et al. Bone marrow mesenchymal stem cells transfer in patients with ST-segment elevation myocardial infarction: single-blind, multicenter, randomized controlled trial. Stem Cell Res Ther.12, 33 (2021). 10.1186/s13287-020-02096-6 - DOI - PMC - PubMed
    1. Xia, N. et al. A Unique Population of Regulatory T Cells in Heart Potentiates Cardiac Protection From Myocardial Infarction. Circulation142, 1956–1973 (2020). 10.1161/CIRCULATIONAHA.120.046789 - DOI - PubMed
    1. Farache Trajano, L. & Smart, N. Immunomodulation for optimal cardiac regeneration: insights from comparative analyses. NPJ Regen. Med.6, 8 (2021). 10.1038/s41536-021-00118-2 - DOI - PMC - PubMed

MeSH terms