. 2024 Aug 2;9(1):193.
doi: 10.1038/s41392-024-01912-2.

Revealing the crucial roles of suppressive immune microenvironment in cardiac myxoma progression

Affiliations

Revealing the crucial roles of suppressive immune microenvironment in cardiac myxoma progression

Zedong Jiang et al. Signal Transduct Target Ther. .

Abstract

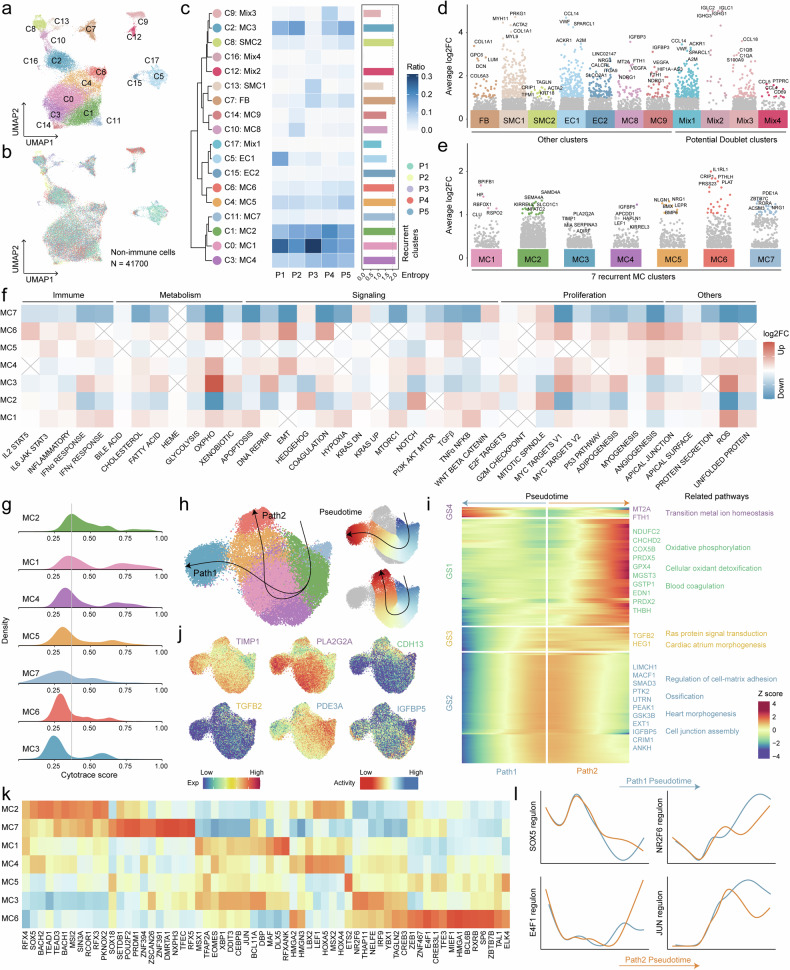
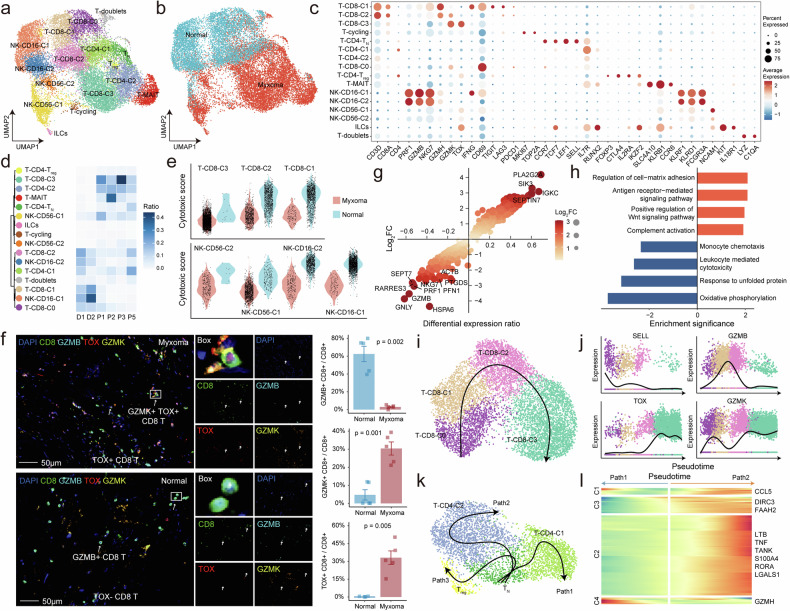
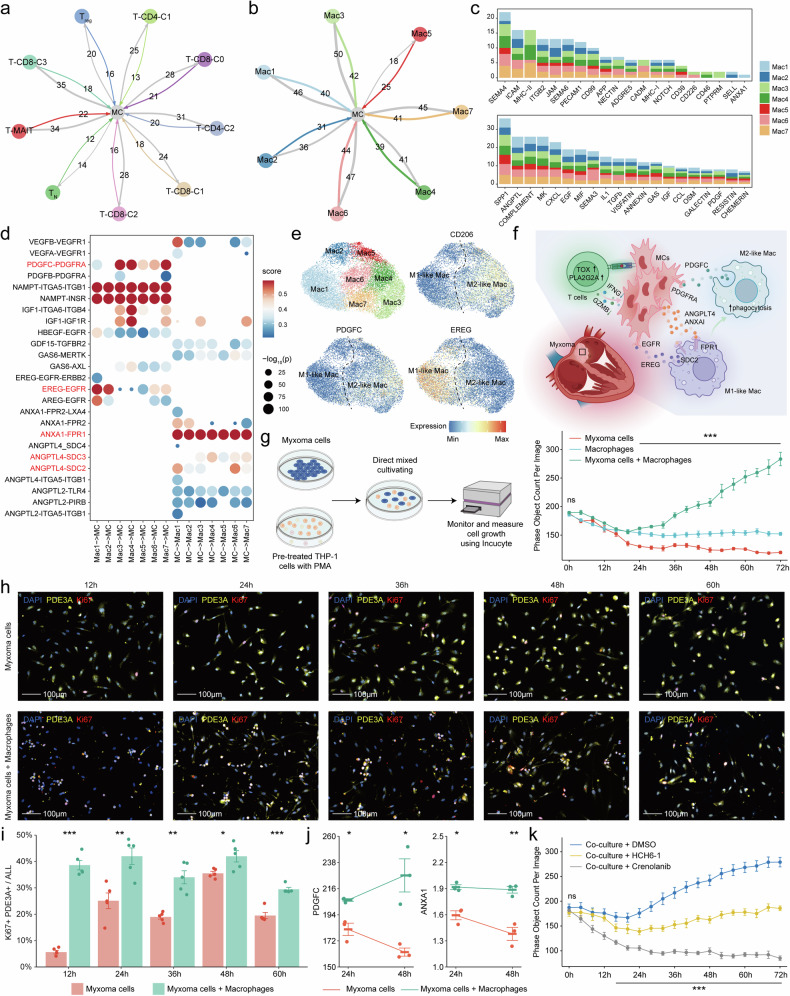
Cardiac myxoma is a commonly encountered tumor within the heart that has the potential to be life-threatening. However, the cellular composition of this condition is still not well understood. To fill this gap, we analyzed 75,641 cells from cardiac myxoma tissues based on single-cell sequencing. We defined a population of myxoma cells, which exhibited a resemblance to fibroblasts, yet they were distinguished by an increased expression of phosphodiesterases and genes associated with cell proliferation, differentiation, and adhesion. The clinical relevance of the cell populations indicated a higher proportion of myxoma cells and M2-like macrophage infiltration, along with their enhanced spatial interaction, were found to significantly contribute to the occurrence of embolism. The immune cells surrounding the myxoma exhibit inhibitory characteristics, with impaired function of T cells characterized by the expression of GZMK and TOX, along with a substantial infiltration of tumor-promoting macrophages expressed growth factors such as PDGFC. Furthermore, in vitro co-culture experiments showed that macrophages promoted the growth of myxoma cells significantly. In summary, this study presents a comprehensive single-cell atlas of cardiac myxoma, highlighting the heterogeneity of myxoma cells and their collaborative impact on immune cells. These findings shed light on the complex pathobiology of cardiac myxoma and present potential targets for intervention.


Conflict of interest statement

The authors declare no competing interests.

Figures

Fig. 1
Fig. 1
Cell composition of cardiac myxomas. a The UMAP plot presents all sequenced cells based on cell type from 5 patients. b Violin plots show the expression levels of classic markers across different clusters. c The mIHC image displays Ki67+ and Ki67- myxoma cells. Scale bars, 30 μm. d The scatter plot shows differential genes between MC and other cell types. Genes with corrected p values less than 0.05 in the differential analysis are displayed in the plot. The x-axis represents the difference in gene expression proportions between the two cell groups, while the y-axis represents the fold difference in gene expression means between the two cell groups. e The functional network is formed by marker genes of the MC cluster. Edges in the network represent the semantic similarity of GO annotations between genes. f A lollipop chart shows functional enrichment analysis results of marker genes from MC. g Heatmap shows the correlation of gene expression between various cell types. h Two separate UMAP plots depicting cell types in myxoma and normal heart. The left side represents 5 myxoma samples, annotated in this study. The right side represents 2 normal heart samples, annotated from a published study. i Two separate UMAP plots depicting gene expression of PDE3A and SOX9 in myxoma and normal heart. j The mIHC image displays PDE3A+ cells in myxoma and normal tissues. Scale bars, 20 μm. k The dot plot shows the scaled expression of selected genes for each cluster, colored by the average expression of each gene in each cluster scaled across all clusters. Dot size represents the percentage of cells in each cluster with more than one read of the corresponding gene
Fig. 2
Fig. 2
Variability in cell type distributions across the severity of cardiac myxomas. a Schematic depicting the analysis of the correlation between cell types and myxoma severity. b Barplot depicting the cell numbers (top panel) and distribution (bottom panel) of 5 cell types in 57 samples. MC, myxoma cell; Mac, macrophage. c Representative images of antibody staining across severity subgroups. Scale bars, 100 μm. d PCA dimension reduction plot based on the proportions of 5 cell types for all samples. The severity of the disease is displayed in different colors and shapes. e Heatmap of the correlation between the proportions of each cell type (top panel). Correlation between the proportion of MC and the proportion of CD8 + T/T and CD206 + Mac/Mac (bottom panel). *P < 0.05, **P < 0.01, and ***P < 0.001. f Prevalence of MC and CD206+ Mac across asymptomatic (n = 11), mild (n = 31), severe (n = 8) patients, and normal samples (n = 8) as a proportion of total cells. g Prevalence of CD206+ Mac/Mac across each subgroup. h G-cross curves of cell type i to cell type j (labeled i & j) fitted based on different severity subgroups. i The mIHC (right panel) and IHC (CD20; right panel) staining demonstrates the T cell center in myxoma. Scale bars, 200 μm
Fig. 3
Fig. 3
Heterogeneity of nonimmune cells in cardiac myxomas. a UMAP view of nonimmune cell clusters from 5 samples. b The UMAP plot shows the sample origin of all nonimmune cells. c Dendrogram demonstrating the similarity of nonimmune cell cluster centroids. The heatmap shows the proportion of each nonimmune cell subset in different samples. d, e Marker genes for various nonimmune cell types. The y-axis represents the expression fold change after log2 transformation, and genes with log2FC > 1 are filled in respective subgroup colors. The top 5 marker genes are annotated in the figure. f Heatmap shows log2 transformed fold change of hallmark gene set score across 7 recurrent MC clusters. g Distribution of CytoTRACE scores for various MC subpopulations. h Developmental trajectory of MCs visualized by UMAP. Potential differentiation trajectories are schematically depicted with arrows. The pseudotime of cells is visualized by UMAP (right). i Heatmaps illustrate genes linked to developmental path 1 (left) and path 2 (right). These genes were divided into 4 classes based on hierarchy clustering. Representative genes and associated pathways of each gene cluster are labeled. j The expression profile of genes related to cell fate is visualized by UMAP. k Heatmap shows differential TF activity across MC clusters revealed by SCENIC. l Changes in TF activity along pseudotime of two differentiation paths
Fig. 4
Fig. 4
T cell dysfunction in cardiac myxomas. a UMAP view of lymphocyte clusters from 6 samples. b The UMAP plot shows the group information of all lymphocytes. c Expression levels and frequencies of selected markers across lymphocyte clusters. d Dendrogram demonstrating the similarity of lymphocyte cluster centroids. The heatmap shows the proportion of each lymphocyte subset in different samples. e Violin plots showing cytotoxic scores in CD8 + T and NK cells across myxoma and normal tissues. f The mIHC staining demonstrates the CD8 + T cells and TOX, GZMK, and GZMB expression in myxoma and normal tissue. Scale bars, 50 μm. The bar plots show the proportion of T cells expressing GZMB, GZMK, and TOX, n = 5 in each group. The error bar indicates the standard error of the mean. g Scatter plot showing differential genes of myxoma and normal tissue–derived lymphocyte cells. Genes with corrected p values less than 0.05 in the differential analysis are displayed in the plot. The x-axis represents the difference in gene expression proportions between the two cell groups, while the y-axis represents the fold difference in gene expression means between the two cell groups. h Barplot shows significantly upregulated (orange) and downregulated (blue) gene sets in lymphocytes of myxoma as obtained from the GSEA method. i Developmental trajectory of CD8 T cells visualized by UMAP. Potential differentiation trajectory is schematically depicted with arrows. j Changes in gene expression along pseudotime of CD8 T cell differentiation trajectory. k The developmental trajectory of CD4 T cells is visualized by UMAP, and three differentiation trajectories are schematically depicted with arrows. l Heatmaps illustrate genes linked to developmental path 1 (left) and path 2 (right) of CD4 T cell differentiation trajectories. These genes were divided into 4 classes based on hierarchy clustering. Representative genes of each gene cluster are labeled
Fig. 5
Fig. 5
Tumor-promoting macrophage in cardiac myxomas. a UMAP view of myeloid cell clusters from 7 samples. b The UMAP plot shows the group information of all myeloid cells. c Dendrogram demonstrating the similarity of myeloid cell cluster centroids. The heatmap shows the proportion of each myeloid cell subset in different samples. d Expression levels and frequencies of selected markers across myeloid cell clusters. e Violin plots showing some characteristics in macrophage clusters scored by the AddModuleScore function. f The mIHC staining demonstrates the tumor-promoting macrophage in myxoma and normal tissue. Scale bars, 50 μm. g The mIHC staining demonstrates the EREG, ABL2, and FRMD4A macrophages in myxoma and normal tissue. Scale bars, 50 μm. The bar plots show the proportion of macrophages expressing EREG, ABL2, and FRMD4A, n = 5 in each group. The error bar indicates the standard error of the mean. h Scatter plot showing differential genes of myxoma and normal macrophages. Genes with corrected p values less than 0.05 in the differential analysis are displayed in the plot. The x-axis represents the difference in gene expression proportions between the two cell groups, while the y-axis represents the fold difference in gene expression means between the two cell groups. i Barplot shows significantly upregulated (orange) and downregulated (blue) gene sets in macrophage of myxoma as obtained from the GSEA method. j Violin plots showing signature scores in macrophage across myxoma and normal tissues. Cellular response to chemokine, GO:1990869; Positive regulation of Wnt signaling pathway, GO:0030177. ****P < 0.0001
Fig. 6
Fig. 6
Macrophages promoted the proliferation of myxoma cells. a The number of significant ligand-receptor interactions between T cells and myxoma cells. b The number of significant ligand-receptor interactions between macrophage and myxoma cells. The direction of the arrow indicates the cell type expressing the ligand, while the direction the arrow points to represents the cell type expressing the receptor. c Barplot depicting the number of significant ligand-receptor interaction pairs (y-axis) between myxoma cells and macrophages (filled by different colors) in different pathways (x-axis). d Representative ligand-receptor pairs between myxoma cells and macrophages. The color indicates the strength of the ligand-receptor interactions, and the dot size represents the statistical significance of interactive molecular pairs. e The expression of genes is projected on the UMAP plot of macrophages. f The infographic (created with BioRender.com) summarizes predicted cell-cell interaction circuits in myxoma. g Incucyte proliferation assay of the co-culture system between myxoma cells and macrophages. h Immunofluorescence images show the proliferation of myxoma cells at different time points in the single culture and co-culture system. i Comparison of the number of myxoma cells in proliferative state at different time points in single culture and co-culture systems. j The secretion levels of some factors in a single culture and co-culture system are based on Elisa. The error bar indicates the standard error of the mean. k Comparison of myxoma cell proliferation status in the co-culture system after the addition of different inhibitors. HCH6-1, FPR1 antagonist. Crenolanib, PDGFR inhibitor. *P < 0.05; **P < 0.01; ***P < 0.001

References

    1. Maleszewski, J. J., Anavekar, N. S., Moynihan, T. J. & Klarich, K. W. Pathology, imaging, and treatment of cardiac tumours. Nat. Rev. Cardiol.14, 536–549 (2017). 10.1038/nrcardio.2017.47 - DOI - PubMed
    1. Joshi, M., Kumar, S., Noshirwani, A. & Harky, A. The current management of cardiac tumours: a comprehensive literature review. Braz. J. Cardiovasc. Surg.35, 770–780 (2020). 10.21470/1678-9741-2019-0199 - DOI - PMC - PubMed
    1. Butany, J. et al. Cardiac tumours: diagnosis and management. Lancet Oncol.6, 219–228 (2005). 10.1016/S1470-2045(05)70093-0 - DOI - PubMed
    1. Griborio-Guzman, A. G., Aseyev, O. I., Shah, H. & Sadreddini, M. Cardiac myxomas: clinical presentation, diagnosis and management. Heart108, 827–833 (2022). 10.1136/heartjnl-2021-319479 - DOI - PubMed
    1. Gosev, I. et al. Cardiac myxoma the great imitators: comprehensive histopathological and molecular approach. Int. J. Cardiol.164, 7–20 (2013). 10.1016/j.ijcard.2011.12.052 - DOI - PubMed

Publication types