. 2024 Aug 1;8(1):87.
doi: 10.1186/s41747-024-00491-9.

Automated evaluation of diaphragm configuration based on chest CT in COPD patients

Affiliations

Automated evaluation of diaphragm configuration based on chest CT in COPD patients

Jens T Bakker et al. Eur Radiol Exp. .

Abstract

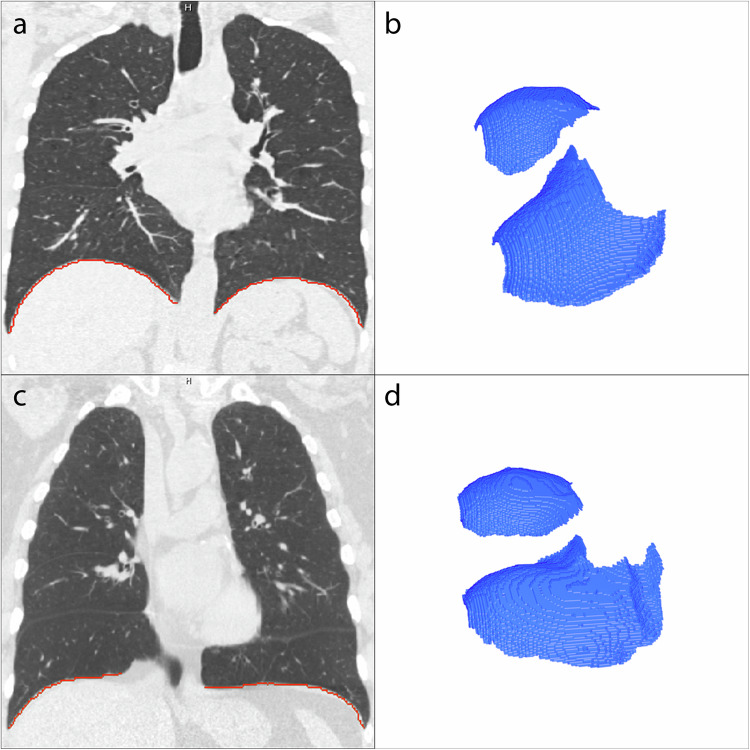
Background: Severe chronic obstructive pulmonary disease (COPD) often results in hyperinflation and flattening of the diaphragm. An automated computed tomography (CT)-based tool for quantifying diaphragm configuration, a biomarker for COPD, was developed in-house and tested in a large cohort of COPD patients.

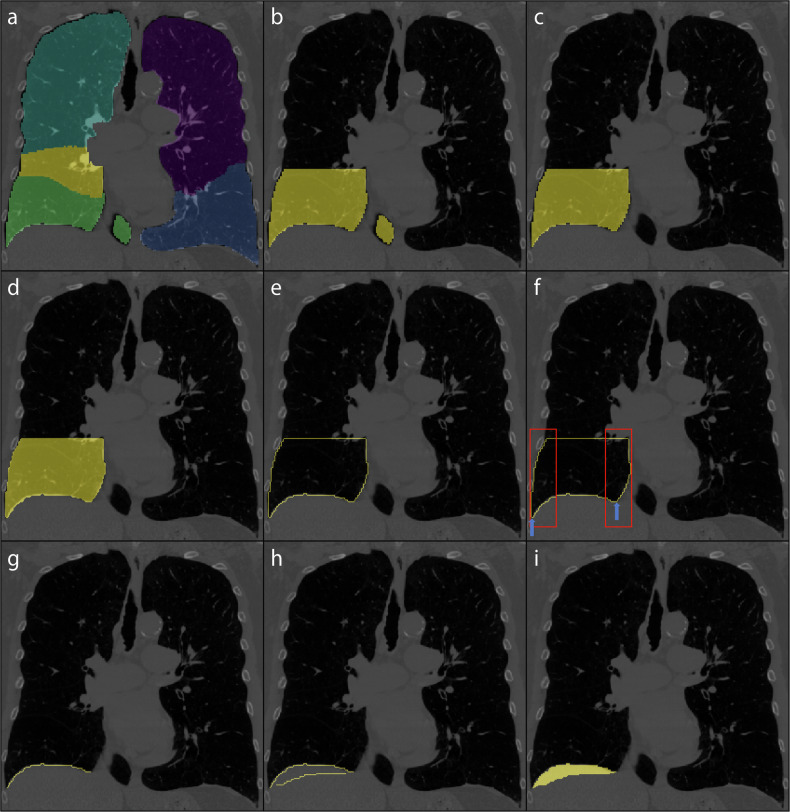
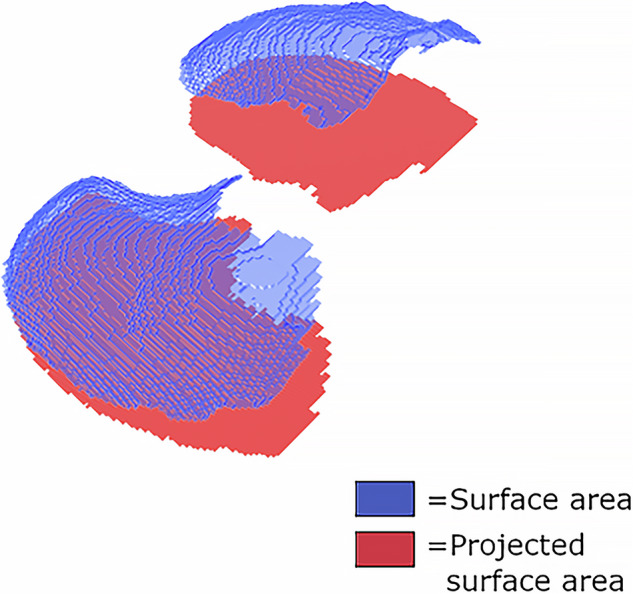
Methods: We used the LungQ platform to extract the lung-diaphragm intersection, as direct diaphragm segmentation is challenging. The tool computed the diaphragm index (surface area/projected surface area) as a measure of diaphragm configuration on inspiratory scans in a COPDGene subcohort. Visual inspection of 250 randomly selected segmentations served as a quality check. Associations between the diaphragm index, Global Initiative for Chronic Obstructive Lung Disease (GOLD) stages, forced expiratory volume in 1 s (FEV1) % predicted, and CT-derived emphysema scores were explored using analysis of variance and Pearson correlation.

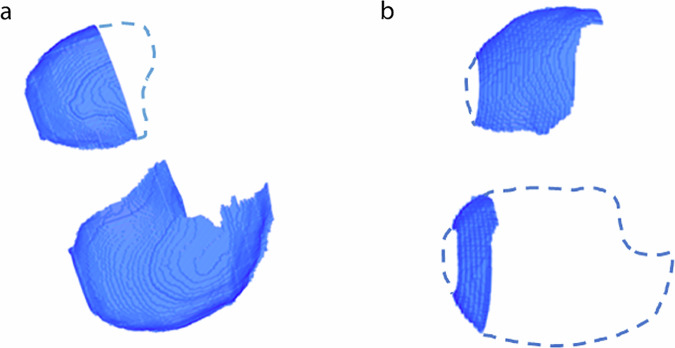
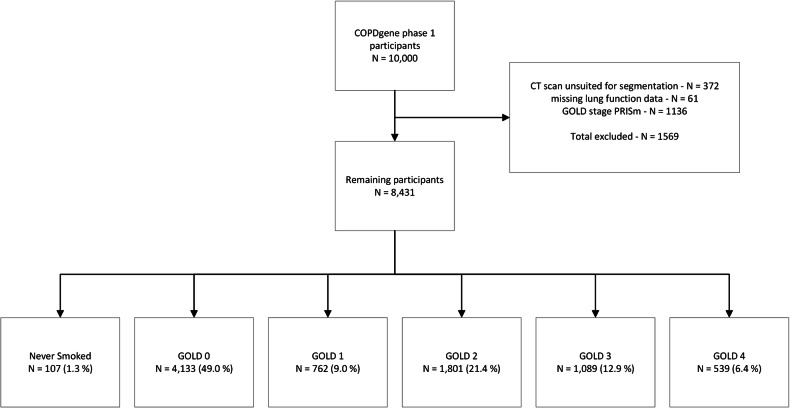
Results: The tool yielded incomplete segmentation in 9.2% (2.4% major defect, 6.8% minor defect) of 250 randomly selected cases. In 8431 COPDGene subjects (4240 healthy; 4191 COPD), the diaphragm index was increasingly lower with higher GOLD stages (never-smoked 1.83 ± 0.16; GOLD-0 1.79 ± 0.18; GOLD-1 1.71 ± 0.15; GOLD-2: 1.67 ± 0.16; GOLD-3 1.58 ± 0.14; GOLD-4 1.54 ± 0.11) (p < 0.001). Associations were found between the diaphragm index and both FEV1% predicted (r = 0.44, p < 0.001) and emphysema score (r = -0.36, p < 0.001).

Conclusion: We developed an automated tool to quantify the diaphragm configuration in chest CT. The diaphragm index was associated with COPD severity, FEV1%predicted, and emphysema score.

Relevance statement: Due to the hypothesized relationship between diaphragm dysfunction and diaphragm configuration in COPD patients, automatic quantification of diaphragm configuration may prove useful in evaluating treatment efficacy in terms of lung volume reduction.

Key points: Severe COPD changes diaphragm configuration to a flattened state, impeding function. An automated tool quantified diaphragm configuration on chest-CT providing a diaphragm index. The diaphragm index was correlated to COPD severity and may aid treatment assessment.

Keywords: Diaphragm; Lung pulmonary disease (chronic obstructive); Segmentation tool; Tomography (x-ray computed).


Conflict of interest statement

DJS is an advisor to Thirona, Nijmegen, NL. RV has received institutional research grants from Siemens Healthineers. MT is employed by Thirona, Nijmegen, NL. JPC is employed by Thirona, Nijmegen, NL, and is a shareholder of Thirona, Nijmegen, NL. All other authors have no competing interests to declare.

Figures

Fig. 1
Fig. 1
Diaphragm segmentation. For example, focusing on a single coronal slice of the right lung (each lung is processed separately and most steps are taken in the coronal slice. a Coronal slice of a lobe segmentation by LungQ (Thirona, Nijmegen, The Netherlands) that serves as the starting point to extract the lung-diaphragm intersection. b The lobe segmentation is converted into a lung segmentation and its most caudal third is retained for further processing. c, d, e For simplicity, the largest connected component (all the voxels within the segmentation touch each other) is kept for further processing. f Within the areas represented by the red boxes, the most caudal points are found, if multiple points are found at the same height the outermost is selected (signified by the blue arrows). These points are removed from the outline, separating it into two connected components. g The smallest component is retained, leaving the outline of the lung-diaphragm intersection. h The diaphragm segmentation (step g) from the previous slice is added to the current slice diaphragm segmentation. For visualization purposes only, instead of the previous slice, a slice from 27 slices before the current slice is chosen. i The ends of both diaphragm segmentations are connected and the empty space within the resulting segmentation is filled. This step ensures that the slices are connected in three dimensions, forming a fully connected object
Fig. 2
Fig. 2
Example of a three-dimensional view of a diaphragm segmentation (in blue). The projected surface area of this diaphragm segmentation is visible in red. The diaphragm index is the ratio of the diaphragm surface area divided by the projected surface area
Fig. 3
Fig. 3
a Top-down view of a three-dimensional (3D) segmentation is considered a minor defect. The dashed outline roughly indicates the area that should have been included in the segmentation. b Top-down view of a 3D segmentation is considered a major defect. The dashed outline roughly indicates the area that should have been included in the segmentation
Fig. 4
Fig. 4
Study flowchart
Fig. 5
Fig. 5
a Example of a coronal slice of a participant with GOLD-0. The red line represents the lung-diaphragm intersection segmentation for this particular coronal slice. b The entire lung-diaphragm segmentation for the same participant is depicted in a, with a diaphragm index of 2.25. c Example of a coronal slice of a participant with GOLD-4. The red line represents the lung-diaphragm intersection segmentation for this particular coronal slice. d The entire lung-diaphragm segmentation for the same participant is depicted in c, with a diaphragm index of 1.55
Fig. 6
Fig. 6
Boxplot of the diaphragm index in a group that has never smoked and groups according to the GOLD stage. The ANOVA proved significant with p < 0.001. The post-hoc Tukey test demonstrated a significant difference between all groups, with the exception of the Never-smoked group and the GOLD-0 group, which were not significantly different from each other
Fig. 7
Fig. 7
a Pearson’s correlation between the diaphragm index and the FEV1% predicted. b Pearson’s correlation between the diaphragm index and the log transformation of the -950 HU emphysema score (%)

References

    1. Regan EA, Hokanson JE, Murphy JR et al (2010) Genetic epidemiology of COPD (COPDGene) study design. COPD J Chronic Obstr Pulm Dis 7:32–43. 10.3109/1541255090349952210.3109/15412550903499522 - DOI - PMC - PubMed
    1. Kemp SV, Polkey MI, Shah PL (2009) The epidemiology, etiology, clinical features, and natural history of emphysema. Thorac Surg Clin 19:149–158. 10.1016/j.thorsurg.2009.03.003 10.1016/j.thorsurg.2009.03.003 - DOI - PubMed
    1. Laveneziana P, Guenette JA, Webb KA, O’Donnell DE (2012) New physiological insights into dyspnea and exercise intolerance in chronic obstructive pulmonary disease patients. Expert Rev Respir Med 6:651–662. 10.1586/ers.12.70 10.1586/ers.12.70 - DOI - PubMed
    1. De Troyer A, Boriek AM (2011) Mechanics of the respiratory muscles. Compr Physiol 1:1273–1300. 10.1002/cphy.c100009 10.1002/cphy.c100009 - DOI - PubMed
    1. Laghi F, Tobin MJ (2003) Disorders of the respiratory muscles. Am J Respir Crit Care Med 168:10–48. 10.1164/rccm.2206020 10.1164/rccm.2206020 - DOI - PubMed