. 2024 Aug 1;12(1):143.
doi: 10.1186/s40168-024-01860-7.

Genomic and induction evidence for bacteriophage contributions to sargassum-bacteria symbioses

Affiliations

Genomic and induction evidence for bacteriophage contributions to sargassum-bacteria symbioses

Alexandra K Stiffler et al. Microbiome. .

Abstract

Background: Symbioses between primary producers and bacteria are crucial for nutrient exchange that fosters host growth and niche adaptation. Yet, how viruses that infect bacteria (phages) influence these bacteria-eukaryote interactions is still largely unknown. Here, we investigate the role of viruses on the genomic diversity and functional adaptations of bacteria associated with pelagic sargassum. This brown alga has dramatically increased its distribution range in the Atlantic in the past decade and is predicted to continue expanding, imposing severe impacts on coastal ecosystems, economies, and human health.

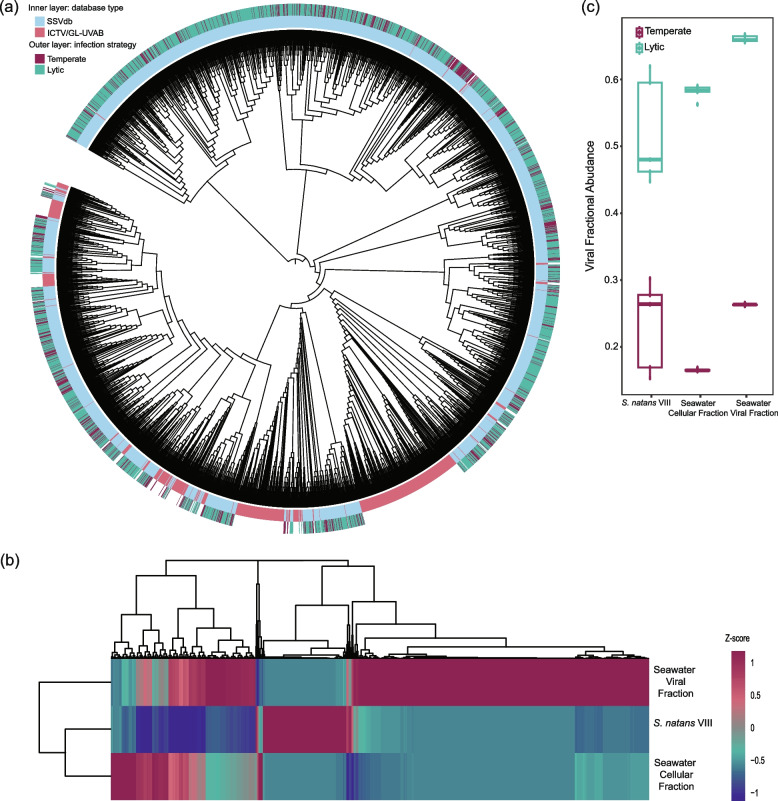
Results: We reconstructed 73 bacterial and 3963 viral metagenome-assembled genomes (bMAGs and vMAGs, respectively) from coastal Sargassum natans VIII and surrounding seawater. S. natans VIII bMAGs were enriched in prophages compared to seawater (28% and 0.02%, respectively). Rhodobacterales and Synechococcus bMAGs, abundant members of the S. natans VIII microbiome, were shared between the algae and seawater but were associated with distinct phages in each environment. Genes related to biofilm formation and quorum sensing were enriched in S. natans VIII phages, indicating their potential to influence algal association in their bacterial hosts. In-vitro assays with a bacterial community harvested from sargassum surface biofilms and depleted of free viruses demonstrated that these bacteria are protected from lytic infection by seawater viruses but contain intact and inducible prophages. These bacteria form thicker biofilms when growing on sargassum-supplemented seawater compared to seawater controls, and phage induction using mitomycin C was associated with a significant decrease in biofilm formation. The induced metagenomes were enriched in genomic sequences classified as temperate viruses compared to uninduced controls.

Conclusions: Our data shows that prophages contribute to the flexible genomes of S. natans VIII-associated bacteria. These prophages encode genes with symbiotic functions, and their induction decreases biofilm formation, an essential capacity for flexible symbioses between bacteria and the alga. These results indicate that prophage acquisition and induction contribute to genomic and functional diversification during sargassum-bacteria symbioses, with potential implications for algae growth. Video Abstract.

Keywords: Bacteriophage; Biofilm formation; Induction; Metagenome-assembled genome; Metagenomics; Primary producer.


Conflict of interest statement

The authors declare no competing interests.

Figures

Fig. 1
Fig. 1
Bacterial community composition. Mean abundance of S. natans VIII and seawater bacteria at a the phylum level (PERMANOVA, p value = 0.01). b The abundance of bMAGs in genomes per million reads normalized by sample type. Bars display the mean abundances, and the error bars indicate the standard error (S. natans VIII n = 25 and seawater n = 48)
Fig. 2
Fig. 2
Prophage enrichment in S. natans VIII bacterial communities. a bMAG genome relatedness based on average nucleotide identity, with the presence of viral contigs within the bMAG represented by a circle and confirmed prophages indicated by a star. The black boxes indicate S. natans VIII and seawater bMAG pairs. The grey bars indicate bMAG abundance in genomes per million reads. b Frequency of bMAGs containing viral contigs and confirmed prophages in S. natans VIII (n = 25) and seawater (n = 48). c Genome architecture of two confirmed prophages from S. natans VIII selected based on gene content
Fig. 3
Fig. 3
Viral community composition and infection strategies. a The viral proteomic tree was generated using an all-versus-all protein comparison and DICE distance using the viruses in the S. natans VIII and seawater database (SSVdb, light blue, this study) and reference viruses from the ICTV and GL-UVAB (pink) databases (databases indicated in the inner ring). b Viral fractional abundances in S. natans VIII, seawater cellular fraction, and seawater viral fractions (median values normalized by sample type using a z-score function, where magenta corresponds to highly abundant viruses and dark blue corresponds to rare viruses). c Abundances of temperate (magenta) or lytic (teal) viral fractional abundances per sample type (boxes display the median, first and third quartiles, and minimum and maximum values excluding outliers) (Lytic viruses: Welch’s T, p values = 1.098e-05 and 0.01734, for seawater cellular fraction and S. natans VIII, respectively) (Temperate viruses: Welch’s T, p value = 0.08697)
Fig. 4
Fig. 4
S. natans VIII-associated viruses encoding biofilm-related genes. a Abundance of viruses encoding genes involved in O-antigen biosynthesis (light blue), glycosphingolipid biosynthesis (pink), or biofilm formation pathways (black). The heatmap was normalized by gene using a z-score function. Abundances are displayed as the median (n = 5 for each sample type) of the sum of the fractional abundances of all viruses encoding that gene in a metagenome. b Genome plots of four S. natans VIII-associated viruses that encode genes related to O-antigen synthesis and biofilm formation
Fig. 5
Fig. 5
Planktonic prophage induction in sargassum-associated bacteria. a Growth and induction of bacterial enrichments obtained from sargassum. The vertical solid black line indicates the induction event. Standard error bars indicate the time points where samples were taken for microscopy (t = 15 h and t = 27 h) and the final growth reading at 48 h. (Control n = 5, UV n = 5, mitomycin C n = 5). b The abundance of bacterial cells (solid line) and viral-like particles (dashed line) at the beginning of the experiment, before induction (t = 15 h), and 12 h post-induction (t = 27 h) (ANOVA, p value = 4.01e-04 and 2.18e-08 for differences in cells and VLP abundances, respectively). Standard error bars are present before the induction event (t = 15 h) and the final time point (t = 48 h) (Control n = 3, UV n = 3, mitomycin C n = 3). c Virus-to-microbe ratio (VMR) before induction (teal) and post-induction (magenta) for each treatment group (ANOVA, p value = 1.36e-10; Tukey’s HSD, p value = 4.3e-12, for mitomycin C)
Fig. 6
Fig. 6
Biofilm prophage induction and resistance to external viral predation of sargassum bacteria. a Biofilm growth of the sargassum bacterial enrichment when grown in 10% sargassum-supplemented seawater or seawater (ANOVA, p value = 3.02e-06; Tukey’s HSD, p values = 5e-07) with and without the addition of free viruses concentrated from seawater (Tukey’s HSD, p value = 0.513) (all groups n = 5). b Fold change in biofilm formation by the sargassum bacterial enrichment when grown in 10% sargassum-supplemented seawater induced with mitomycin C (light blue) or not induced (magenta) (Control n = 5, mitomycin C n = 5) (ANOVA, p value = 1.69e-05; Tukey’s HSD, p value = 2.495e-04 for 12 h post-induction). c Percent of viruses that increased or decreased/did not experience a change post-induction when comparing mitomycin C and the control samples. d Fractional abundances for the 33% of viruses that increased post-induction, in mitomycin C (light blue) and the control samples (magenta) (Wilcoxon rank-sum p value = 2.2e-16). e Abundance of temperate phages post-induction in the control (magenta) and mitomycin C (light blue) between the total phages identified and the phages that increased with mitomycin C addition

References

    1. Wang M, Hu C, Barnes BB, Mitchum G, Lapointe B, Montoya JP. The great Atlantic Sargassum belt. Science. 2019;365:83–7. 10.1126/science.aaw7912 - DOI - PubMed
    1. Butler JN. Studies of sargassum and the Sargassum community. Bermuda: Bermuda Biological Station; 1983.
    1. Witherington B, Hirama S, Hardy R. Young sea turtles of the pelagic Sargassum-dominated drift community: habitat use, population density, and threats. Mar Ecol Prog Ser. 2012;463:1–22. 10.3354/meps09970 - DOI
    1. Borgesen F. The marine algae of the Danish West Indies. II. Phaeophyceae. Dansk Bot Arkiv. 1914;2:159–226.
    1. Pa E. Quantitative observations on the pelagic Sargassum vegetation of the western North Atlantic. Bull Bingham Oceanogr Coll. 1939;6:1–94.

LinkOut - more resources