. 2024 Aug 1;21(1):170.
doi: 10.1186/s12985-024-02446-3.

Analysis of host factor networks during hepatitis B virus infection in primary human hepatocytes

Affiliations

Analysis of host factor networks during hepatitis B virus infection in primary human hepatocytes

Suhyun Hwangbo et al. Virol J. .

Abstract

Background: Chronic hepatitis B virus (HBV) infection affects around 250 million people worldwide, causing approximately 887,000 deaths annually, primarily owing to cirrhosis and hepatocellular carcinoma (HCC). The current approved treatments for chronic HBV infection, such as interferon and nucleos(t)ide analogs, have certain limitations as they cannot completely eradicate covalently closed circular DNA (cccDNA). Considering that HBV replication relies on host transcription factors, focusing on host factors in the HBV genome may provide insights into new therapeutic targets against HBV. Therefore, understanding the mechanisms underlying viral persistence and hepatocyte pathogenesis, along with the associated host factors, is crucial. In this study, we investigated novel therapeutic targets for HBV infection by identifying gene and pathway networks involved in HBV replication in primary human hepatocytes (PHHs). Importantly, our study utilized cultured primary hepatocytes, allowing transcriptomic profiling in a biologically relevant context and enabling the investigation of early HBV-mediated effects.

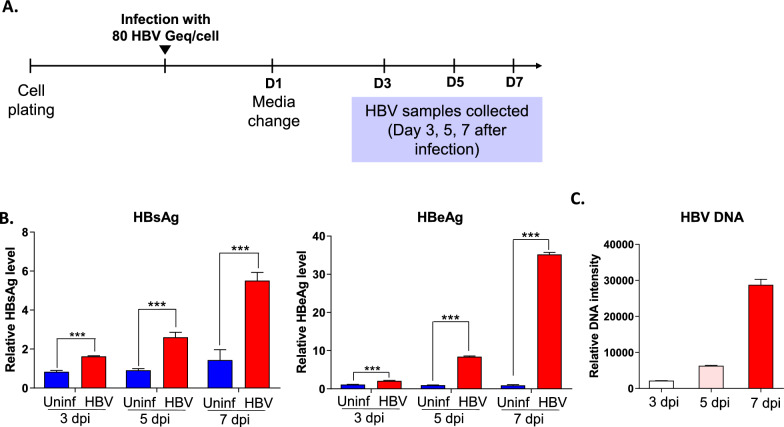
Methods: PHHs were infected with HBV virion particles derived from HepAD38 cells at 80 HBV genome equivalents per cell (Geq/cell). For transcriptomic sequencing, PHHs were harvested 1, 2-, 3-, 5-, and 7 days post-infection (dpi). After preparing the libraries, clustering and sequencing were conducted to generate RNA-sequencing data. This data was processed using Bioinformatics tools and software to analyze DEGs and obtain statistically significant results. Furthermore, qRT-PCR was performed to validate the RNA-sequencing results, ensuring consistent findings.

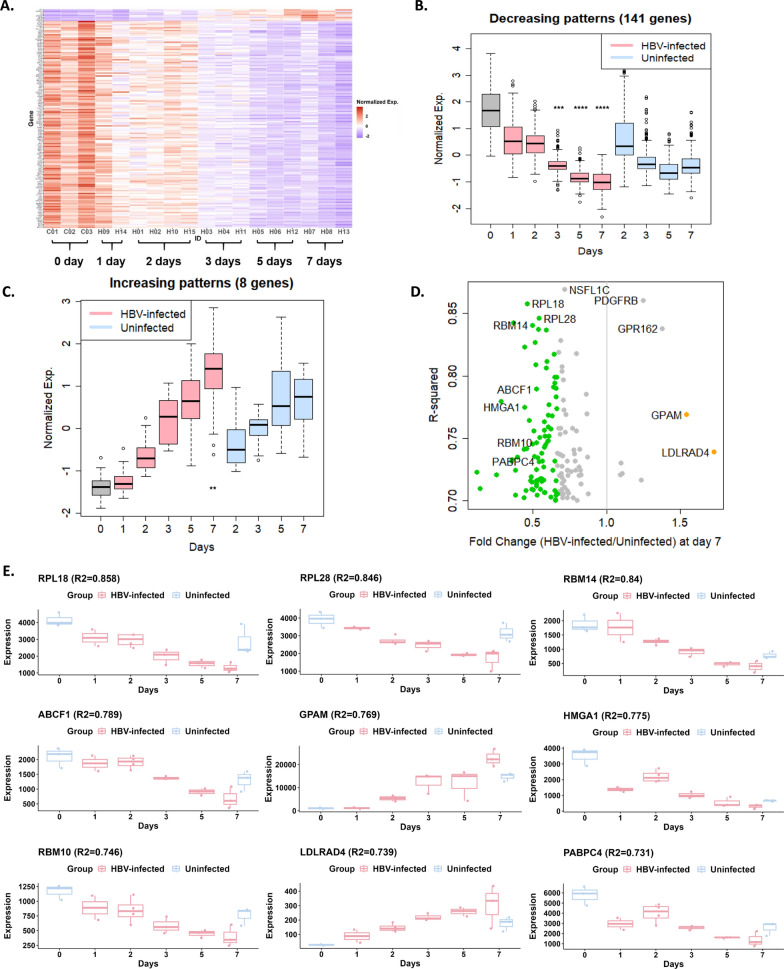
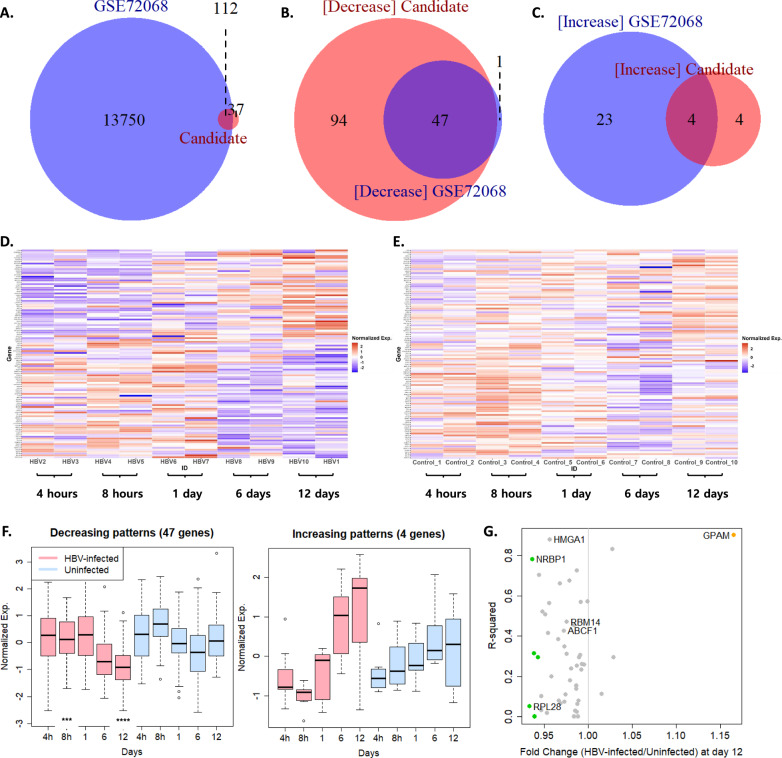
Results: We observed significant alterations in the expression patterns of 149 genes from days 1 to 7 following HBV infection (R2 > 0.7, q < 0.05). Functional analysis of these genes identified RNA-binding proteins involved in mRNA metabolism and the regulation of alternative splicing during HBV infection. Results from qRT-PCR experiments and the analysis of two validation datasets suggest that RBM14 and RPL28 may serve as potential biomarkers for HBV-associated HCC.

Conclusions: Transcriptome analysis of gene expression changes during HBV infection in PHHs provided valuable insights into chronic HBV infection. Additionally, understanding the functional involvement of host factor networks in the molecular mechanisms of HBV replication and transcription may facilitate the development of novel strategies for HBV treatment.

Keywords: Hepatitis B virus; Primary human hepatocytes; RNA-binding proteins; Transcriptome analysis.


Conflict of interest statement

The authors declare no competing interests.

Figures

Fig. 1
Fig. 1
A Workflow for HBV infection. B Levels of HBsAg and HBeAg were analyzed by ELISA at the indicated time points. The data compare the antigens secreted from HBV-infected cells (Red bar) and uninfected cells (Blue bar). Statistical significance is indicated (***: p-value < 0.001). ELISA data are presented as bar charts (n = 4). C Expression of HBV DNA detected by qRT-PCR
Fig. 2
Fig. 2
Expression patterns of 149 genes showing significant dynamic changes. A Expression patterns over time in HBV-infected cells. Expression levels were normalized for each gene and then used as input to the heatmap. B, C Boxplots showing the differences between HBV-infected and uninfected groups for patterns of decrease and increase. The expression patterns of the two groups were compared by date. D Scatter plot with R2 as the y-axis and the fold change at day 7 after infection as the x-axis. Fold change was defined as the average expression level in HBV-infected cells divided by the average expression level in uninfected cells. Green or orange indicates genes with 1.5-fold decreased or increased expression levels, respectively, in HBV-infected cells compared with those in uninfected cells. (E) Expression levels over time for representative genes exhibiting distinct patterns, as determined by RNA-seq data analysis. Genes shown display more than a 1.5-fold difference in expression levels between HBV-infected and uninfected groups at indicated time points
Fig. 3
Fig. 3
Expression patterns for 149 genes in the GSE72068 dataset. A Venn diagram showing the relationship between the 149 candidate genes in the main dataset and the designed genes in the GSE72068 dataset. B Venn diagram showing the number of genes with a decreasing pattern for each dataset around 112 candidate genes. C Venn diagram showing the number of genes with an increasing pattern for each dataset around 112 candidate genes. D, E Expression pattern over time for 112 genes in HBV-infected and uninfected cells in the GSE72068 dataset. Expression levels were normalized for each gene and then used as input for the heatmap. The order of the genes is the same. F Boxplots showing the differences between HBV-infected and uninfected groups for both patterns. We focused on 51 genes that showed common patterns with the main dataset. The expression patterns of the two groups were compared by date. G Scatter plot with R2 as the y-axis and the fold change at day 12 after infection as the x-axis. Fold change was defined as the average expression level in HBV-infected cells divided by the average expression level in uninfected cells. Green or orange indicates genes with 1.1-fold decreased or increased expression levels, respectively, in HBV-infected cells compared with those in uninfected cells
Fig. 4
Fig. 4
Functional enrichment analysis and qRT-PCR-based validation analysis. A All statistically significant enriched terms are displayed (q-value < 0.05). The count indicates the number of genes belonging to each term. B, C The quantitative analysis of genes identified by qRT-PCR. Relative expression levels were calculated by normalizing β-actin expression. Significant differences between uninfected and HBV-infected primary human hepatocytes at 7 dpi are represented (*p < 0.05, **p < 0.01). D Comparison of expression levels between two groups on the last day of measurement for each dataset. Fold change (FC) is defined as the average RNA expression level in the HBV group divided by that in the control (Ctrl) group. (E) Two genes validated in the GSE25097 dataset show downregulated expression levels in real HCC samples compared with those in healthy liver samples

References

    1. Lamontagne J, Mell JC, Bouchard MJ. Transcriptome-wide analysis of hepatitis B virus-mediated changes to normal hepatocyte gene expression. PLoS Pathog. 2016;12(2):e1005438. - PMC - PubMed
    1. Wong MCS, Huang JLW, George J, Huang J, Leung C, Eslam M, et al. The changing epidemiology of liver diseases in the Asia-Pacific region. Nat Rev Gastroenterol Hepatol. 2019;16(1):57–73. - PubMed
    1. Dandri M, Petersen J. cccDNA maintenance in chronic hepatitis B—targeting the matrix of viral replication. Infect Drug Resist. 2020;13:3873–86. - PMC - PubMed
    1. Bar-Yishay I, Shaul Y, Shlomai A. Hepatocyte metabolic signalling pathways and regulation of hepatitis B virus expression. Liver Int. 2011;31(3):282–90. - PubMed
    1. Ito N, Nakashima K, Sun S, Ito M, Suzuki T. Cell type diversity in hepatitis B virus RNA splicing and its regulation. Front Microbiol. 2019;10:207. - PMC - PubMed

Publication types

Associated data

LinkOut - more resources