

Osmotic gradient ektacytometry - a novel diagnostic approach for neuroacanthocytosis syndromes
- PMID: 39091345
- PMCID: PMC11292800
- DOI: 10.3389/fnins.2024.1406969
Osmotic gradient ektacytometry - a novel diagnostic approach for neuroacanthocytosis syndromes
Abstract
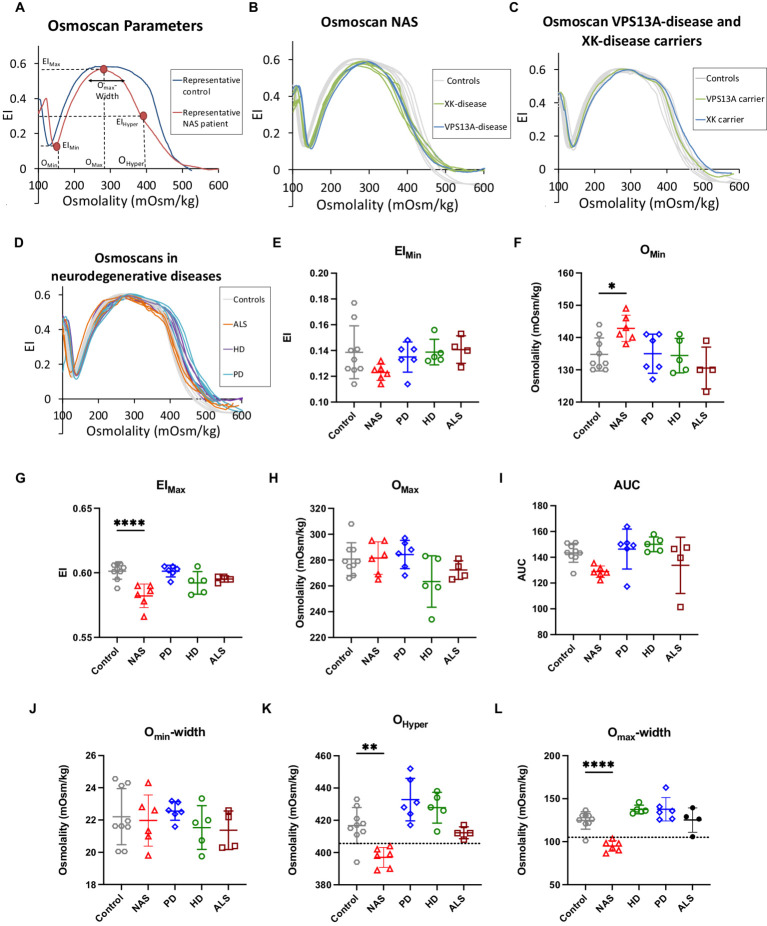
Introduction: The unique red blood cell (RBC) properties that characterize the rare neuroacanthocytosis syndromes (NAS) have prompted the exploration of osmotic gradient ektacytometry (Osmoscan) as a diagnostic tool for these disorders. In this exploratory study, we assessed if Osmoscans can discriminate NAS from other neurodegenerative diseases.
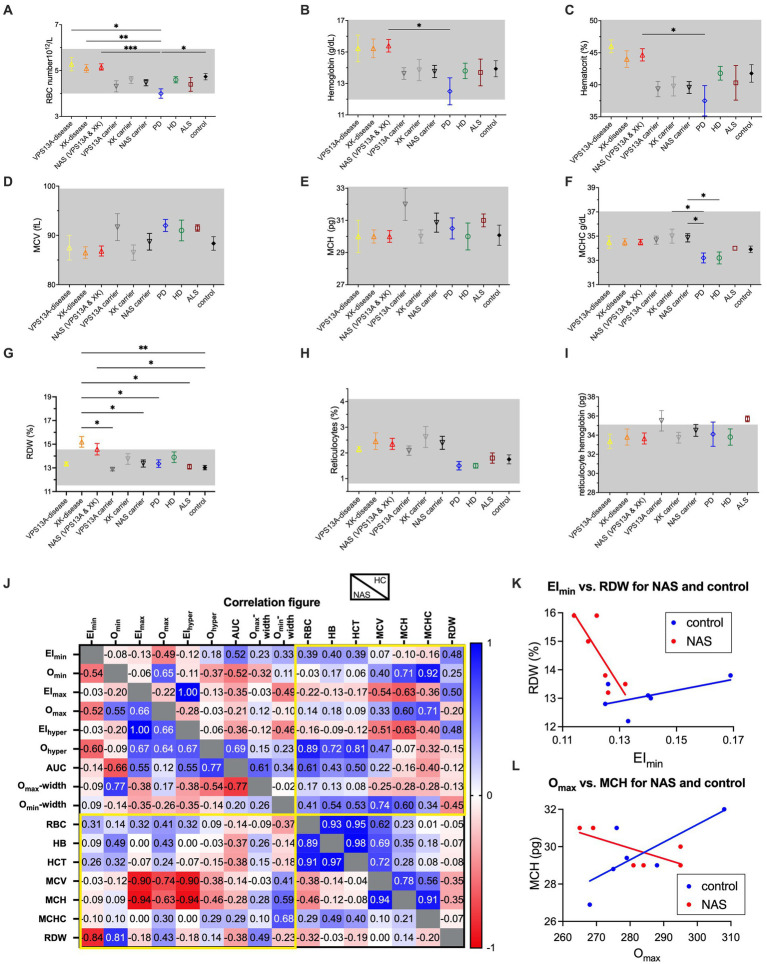
Methods: A comprehensive assessment was conducted using Osmoscan on a diverse group of patients, including healthy controls (n = 9), neuroacanthocytosis syndrome patients (n = 6, 2 VPS13A and 4 XK disease), Parkinson's disease patients (n = 6), Huntington's disease patients (n = 5), and amyotrophic lateral sclerosis patients (n = 4). Concurrently, we collected and analyzed RBC indices and patients' characteristics.
Results: Statistically significant changes were observed in NAS patients compared to healthy controls and other conditions, specifically in osmolality at minimal elongation index (Omin), maximal elongation index (EImax), the osmolality at half maximal elongation index in the hyperosmotic part of the curve (Ohyper), and the width of the curve close to the osmolality at maximal elongation index (Omax-width).
Discussion: This study represents an initial exploration of RBC properties from NAS patients using osmotic gradient ektacytometry. While specific parameters exhibited differences, only Ohyper and Omax-width yielded 100% specificity for other neurodegenerative diseases. Moreover, unique correlations between Osmoscan parameters and RBC indices in NAS versus controls were identified, such as osmolality at maximal elongation index (Omax) vs. mean cellular hemoglobin content (MCH) and minimal elongation index (EImin) vs. red blood cell distribution width (RDW). Given the limited sample size, further studies are essential to establish diagnostic guidelines based on these findings.
Keywords: Osmoscan; RBC deformability; VPS13A disease; XK disease; acanthocytes; ektacytometry; neurodegeneration.
Copyright © 2024 Hernández, Peikert, Qiao, Darras, de Wilde, Bos, Leibowitz, Galea, Wagner, Rab, Walker, Hermann, van Beers, van Wijk and Kaestner.
Conflict of interest statement
The authors declare that the research was conducted in the absence of any commercial or financial relationships that could be construed as a potential conflict of interest. The author(s) declared that they were an editorial board member of Frontiers, at the time of submission. This had no impact on the peer review process and the final decision.
Figures
References
-
- Barshtein G., Goldschmidt N., Pries A. R., Zelig O., Arbell D., Yedgar S. (2017). Deformability of transfused red blood cells is a potent effector of transfusion-induced hemoglobin increment: A study with β-thalassemia major patients. Am. J. Hematol. 92, E559–E560. doi: 10.1002/ajh.24821 - DOI - PubMed
-
- Bianchi P., Zaninoni A., Fermo E., Vercellati C., Paola M. A., Zanella A., et al. (2015). Diagnostic power of laser assisted optical rotational cell analyzer (LoRRca MaxSis) evaluated in 118 patients affected by hereditary hemolytic anemias. Blood 126:942. doi: 10.1182/blood.v126.23.942.942 - DOI
LinkOut - more resources
Full Text Sources