. 2024 Jul 6;27(8):110471.
doi: 10.1016/j.isci.2024.110471. eCollection 2024 Aug 16.

Multi-omic profiling of pathogen-stimulated primary immune cells

Affiliations

Multi-omic profiling of pathogen-stimulated primary immune cells

Renee Salz et al. iScience. .

Abstract

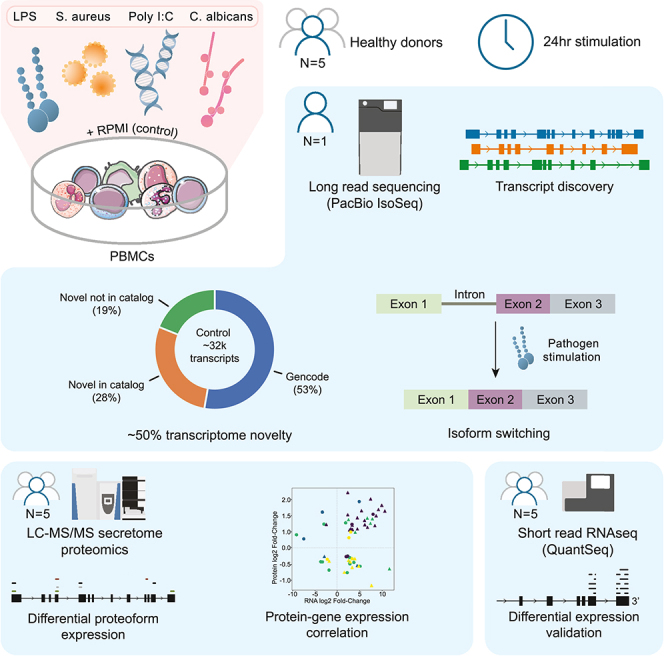
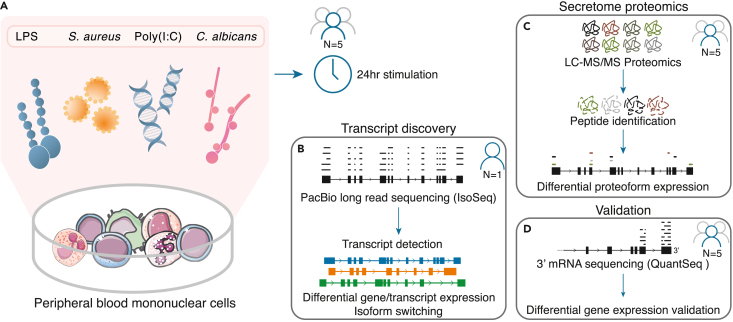
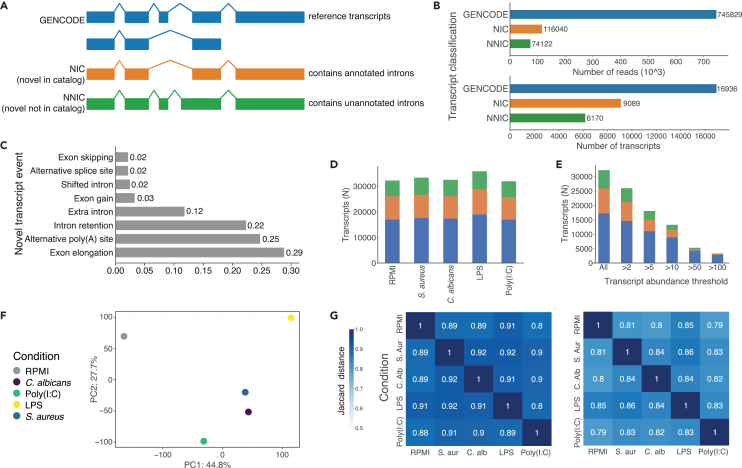
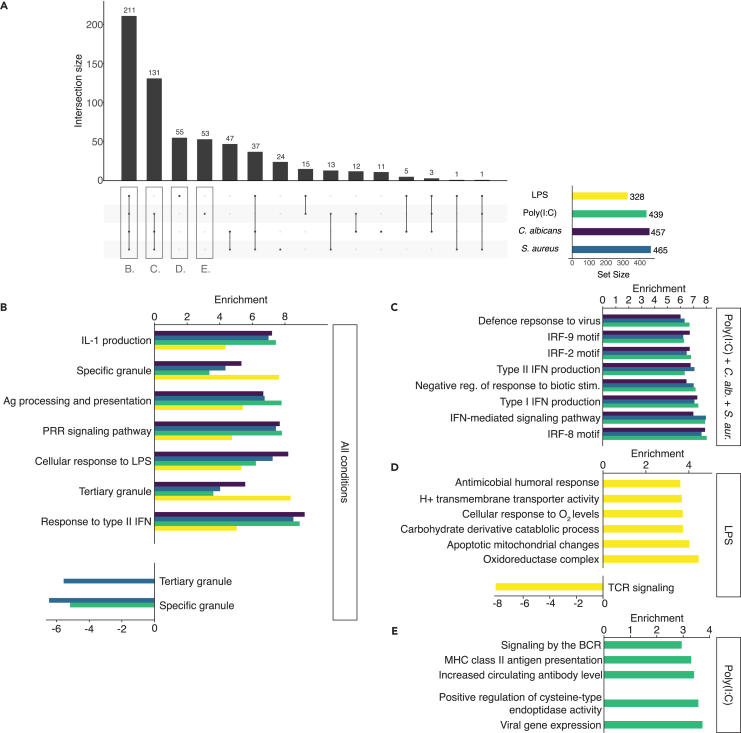
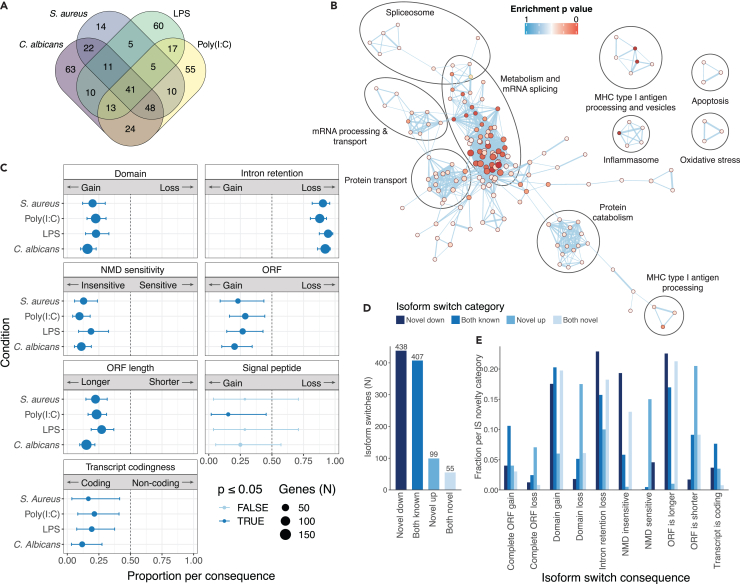
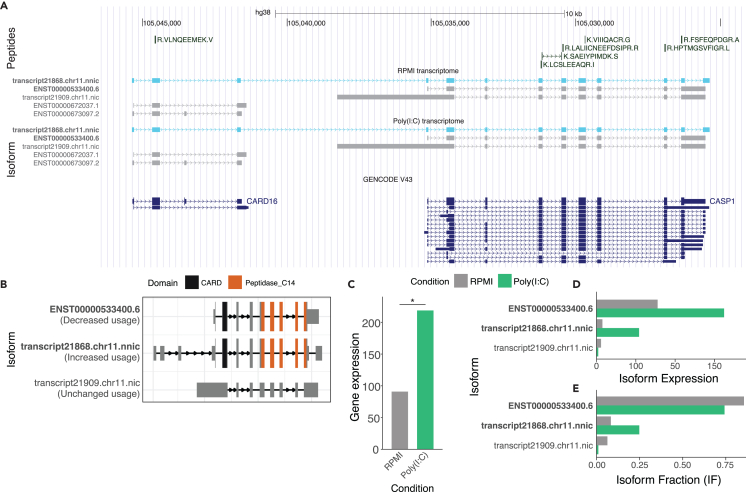
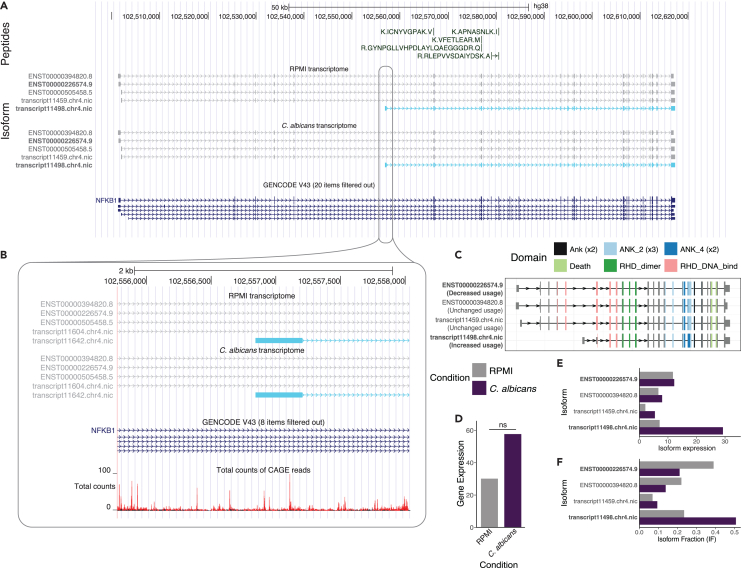
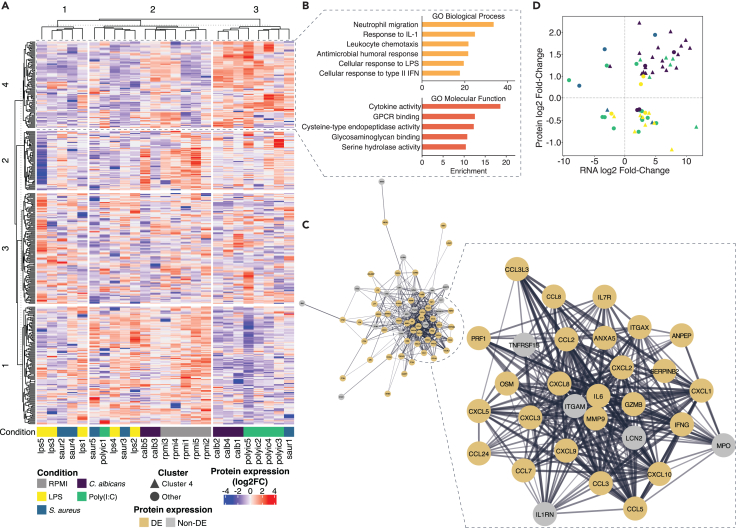
We performed long-read transcriptome and proteome profiling of pathogen-stimulated peripheral blood mononuclear cells (PBMCs) from healthy donors to discover new transcript and protein isoforms expressed during immune responses to diverse pathogens. Long-read transcriptome profiling reveals novel sequences and isoform switching induced upon pathogen stimulation, including transcripts that are difficult to detect using traditional short-read sequencing. Widespread loss of intron retention occurs as a common result of all pathogen stimulations. We highlight novel transcripts of NFKB1 and CASP1 that may indicate novel immunological mechanisms. RNA expression differences did not result in differences in the amounts of secreted proteins. Clustering analysis of secreted proteins revealed a correlation between chemokine (receptor) expression on the RNA and protein levels in C. albicans- and poly(I:C)-stimulated PBMCs. Isoform aware long-read sequencing of pathogen-stimulated immune cells highlights the potential of these methods to identify novel transcripts, revealing a more complex transcriptome landscape than previously appreciated.

Keywords: Immunology; Proteomics; Transcriptomics.


Conflict of interest statement

The authors declare no competing interests.

Figures

None
Graphical abstract
Figure 1
Figure 1
Experimental setup (A) Human peripheral blood mononuclear cells (PBMCs) isolated from five donors were exposed to four different pathogenic stimuli and analyzed after 24 h. (B) PacBio long read RNA-sequencing was performed on samples from one of the five donors. Long-reads were used to estimate differential transcript expression and isoform switching. (C) The supernatant from all samples (all donors) was collected and peptides were detected to quantify protein levels in the secretome. (D) Short read RNA sequencing (QuantSeq) was performed on all samples (all donors) and differential expression estimates were compared to those measured in long-read sequencing.
Figure 2
Figure 2
Transcriptome novelty in the control condition and comparison between stimuli transcriptomes in the five long-read samples (A) Transcript novelty categories. GENCODE (blue) is the set of all known reference transcripts. Novel in catalog (orange) contains a novel combination of annotated introns. Novel not in catalog (green) contains one or more unannotated introns. (B) Reads (top) and unique transcripts (bottom) of events in each pre-defined transcript novelty category in RPMI. (C) Novelty-inducing events occurring in the RPMI transcriptome. (D) Unique transcripts by novelty category for each of the stimulus conditions. (E) Unique transcripts by novelty category that remain at various transcript abundance thresholds in the C. albicans condition. (F) Transcriptomes of the samples plotted on the first two principal components of PCA. (G) Jaccard distances of genes (left) and known transcripts (right) of the transcriptomes, not considering transcript abundance. See also Figures S1 and S2.
Figure 3
Figure 3
Differential pathway analysis originating from differentially expressed genes on the RNA level (A) Overlap between enriched pathways generated from the differentially expressed genes from the four conditions. (B) Selected pathways found to be enriched for all conditions, (C) three of the four conditions (poly(I:C), C. albicans and S. aureus), (D) specifically for LPS and (E) specifically for poly(I:C). See also Figure S3.
Figure 4
Figure 4
Isoform switching induced by pathogen stimulation (A) Overlap of isoform switching genes between the four stimulus conditions. (B) Pathway network analysis derived from genes found to undergo isoform switching (IS) upon pathogen stimulation. Each pathway is colored by p value, where a darker red indicates a lower p value. (C) Proportions of total IS events in each stimulated condition per IS consequence. (D) Number of IS by category of switch pairs. Categories are defined by involvement of novel transcripts in a given IS. “Novel down” indicates that the isoform switched from a higher proportion of the novel transcript in control to a higher proportion of a known transcript in the stimulus condition. “Both known” indicates that the IS occurs between 2 reference transcripts. (E) Fraction of each transcript novelty combination per IS consequence. Normalized by total number of IS events per novelty category. See also Figures S5–S8.
Figure 5
Figure 5
A novel readthrough transcript of CASP1 (A) USCS genome browser track of the transcripts detected in the control condition (RPMI) and stimulated condition (poly(I:C)). The novel readthrough transcript containing both CASP1 and CARD16 is presented in light blue. Known transcripts in in GENCODE are presented below. (B) Representation of the domains in the novel CASP1 transcript, indicating that CARD16 is entirely included in the 5′ UTR of the transcript. (C) Gene and (D) transcript expression and (E) isoform fraction of the CASP1 transcripts that were detected (∗p < 0.05; ∗∗p < 0.01; ∗∗∗p < 0.001; ns, not significant).
Figure 6
Figure 6
A novel transcript of NFKB1 (A) UCSC genome browser track of the transcripts detected in the control condition (RPMI) and stimulated conditions. The novel transcript is presented in light blue. Known transcripts in GENCODE are presented below. (B) Zoomed view of the transcription start site of the novel transcript with CAGE peaks (monocyte) in this region. (C) Representation of the domains in the known and novel NFKB1 transcripts that were detected. (D) Gene and (E) transcript expression and (F) isoform fraction of the NFKB1 transcripts that were detected (∗p < 0.05; ∗∗p < 0.01; ∗∗∗p < 0.001; ns, not significant).
Figure 7
Figure 7
Protein expression in the secretome (A) Normalized protein expression detected from five donors in the five conditions. Donors are denoted with numbers 1 through 5. Clusters originating from kmeans clustering are shown in the heatmap. (B) Gene ontology Biological process (top) and molecular function (bottom) pathways of proteins found in cluster 4. (C) Clustering of genes found in cluster 4. Genes are found to be differentially expressed on the protein level are in color, others greyed. (D) Fold change of gene differential expression versus fold change of protein DE for genes that were differentially expressed on both levels, colored by stimulus. Triangle-shaped points correspond with cluster 4 genes from A. Genes with concordant protein and RNA expression are in the upper right and lower left quadrants. See also Figures S9–S12.

References

    1. Medzhitov R., Horng T. Transcriptional control of the inflammatory response. Nat. Rev. Immunol. 2009;9:692–703. doi: 10.1038/nri2634. - DOI - PubMed
    1. Carpenter S., Ricci E.P., Mercier B.C., Moore M.J., Fitzgerald K.A. Post-transcriptional regulation of gene expression in innate immunity. Nat. Rev. Immunol. 2014;14:361–376. doi: 10.1038/nri3682. - DOI - PubMed
    1. Wells C., Chalk A., Forrest A., Taylor D., Waddell N., Schroder K., Himes S.R., Faulkner G., Lo S., Kasukawa T., et al. Alternate transcription of the Toll-like receptor signaling cascade. Genome Biol. 2006;7 doi: 10.1186/gb-2006-7-2-r10. - DOI - PMC - PubMed
    1. Oosting M., Kerstholt M., ter Horst R., Li Y., Deelen P., Smeekens S., Jaeger M., Lachmandas E., Vrijmoeth H., Lupse M., et al. Functional and Genomic Architecture of Borrelia burgdorferi-Induced Cytokine Responses in Humans. Cell Host Microbe. 2016;20:822–833. doi: 10.1016/j.chom.2016.10.006. - DOI - PubMed
    1. Li Y., Oosting M., Smeekens S.P., Jaeger M., Aguirre-Gamboa R., Le K.T.T., Deelen P., Ricaño-Ponce I., Schoffelen T., Jansen A.F.M., et al. A Functional Genomics Approach to Understand Variation in Cytokine Production in Humans. Cell. 2016;167:1099–1110.e14. doi: 10.1016/j.cell.2016.10.017. - DOI - PubMed

LinkOut - more resources