. 2021 Apr;27(3):e2432.
doi: 10.1002/psp.2432. Epub 2021 Feb 16.

The form and evolution of international migration networks, 1990-2015

Affiliations

The form and evolution of international migration networks, 1990-2015

Guy J Abel et al. Popul Space Place. 2021 Apr.

Abstract

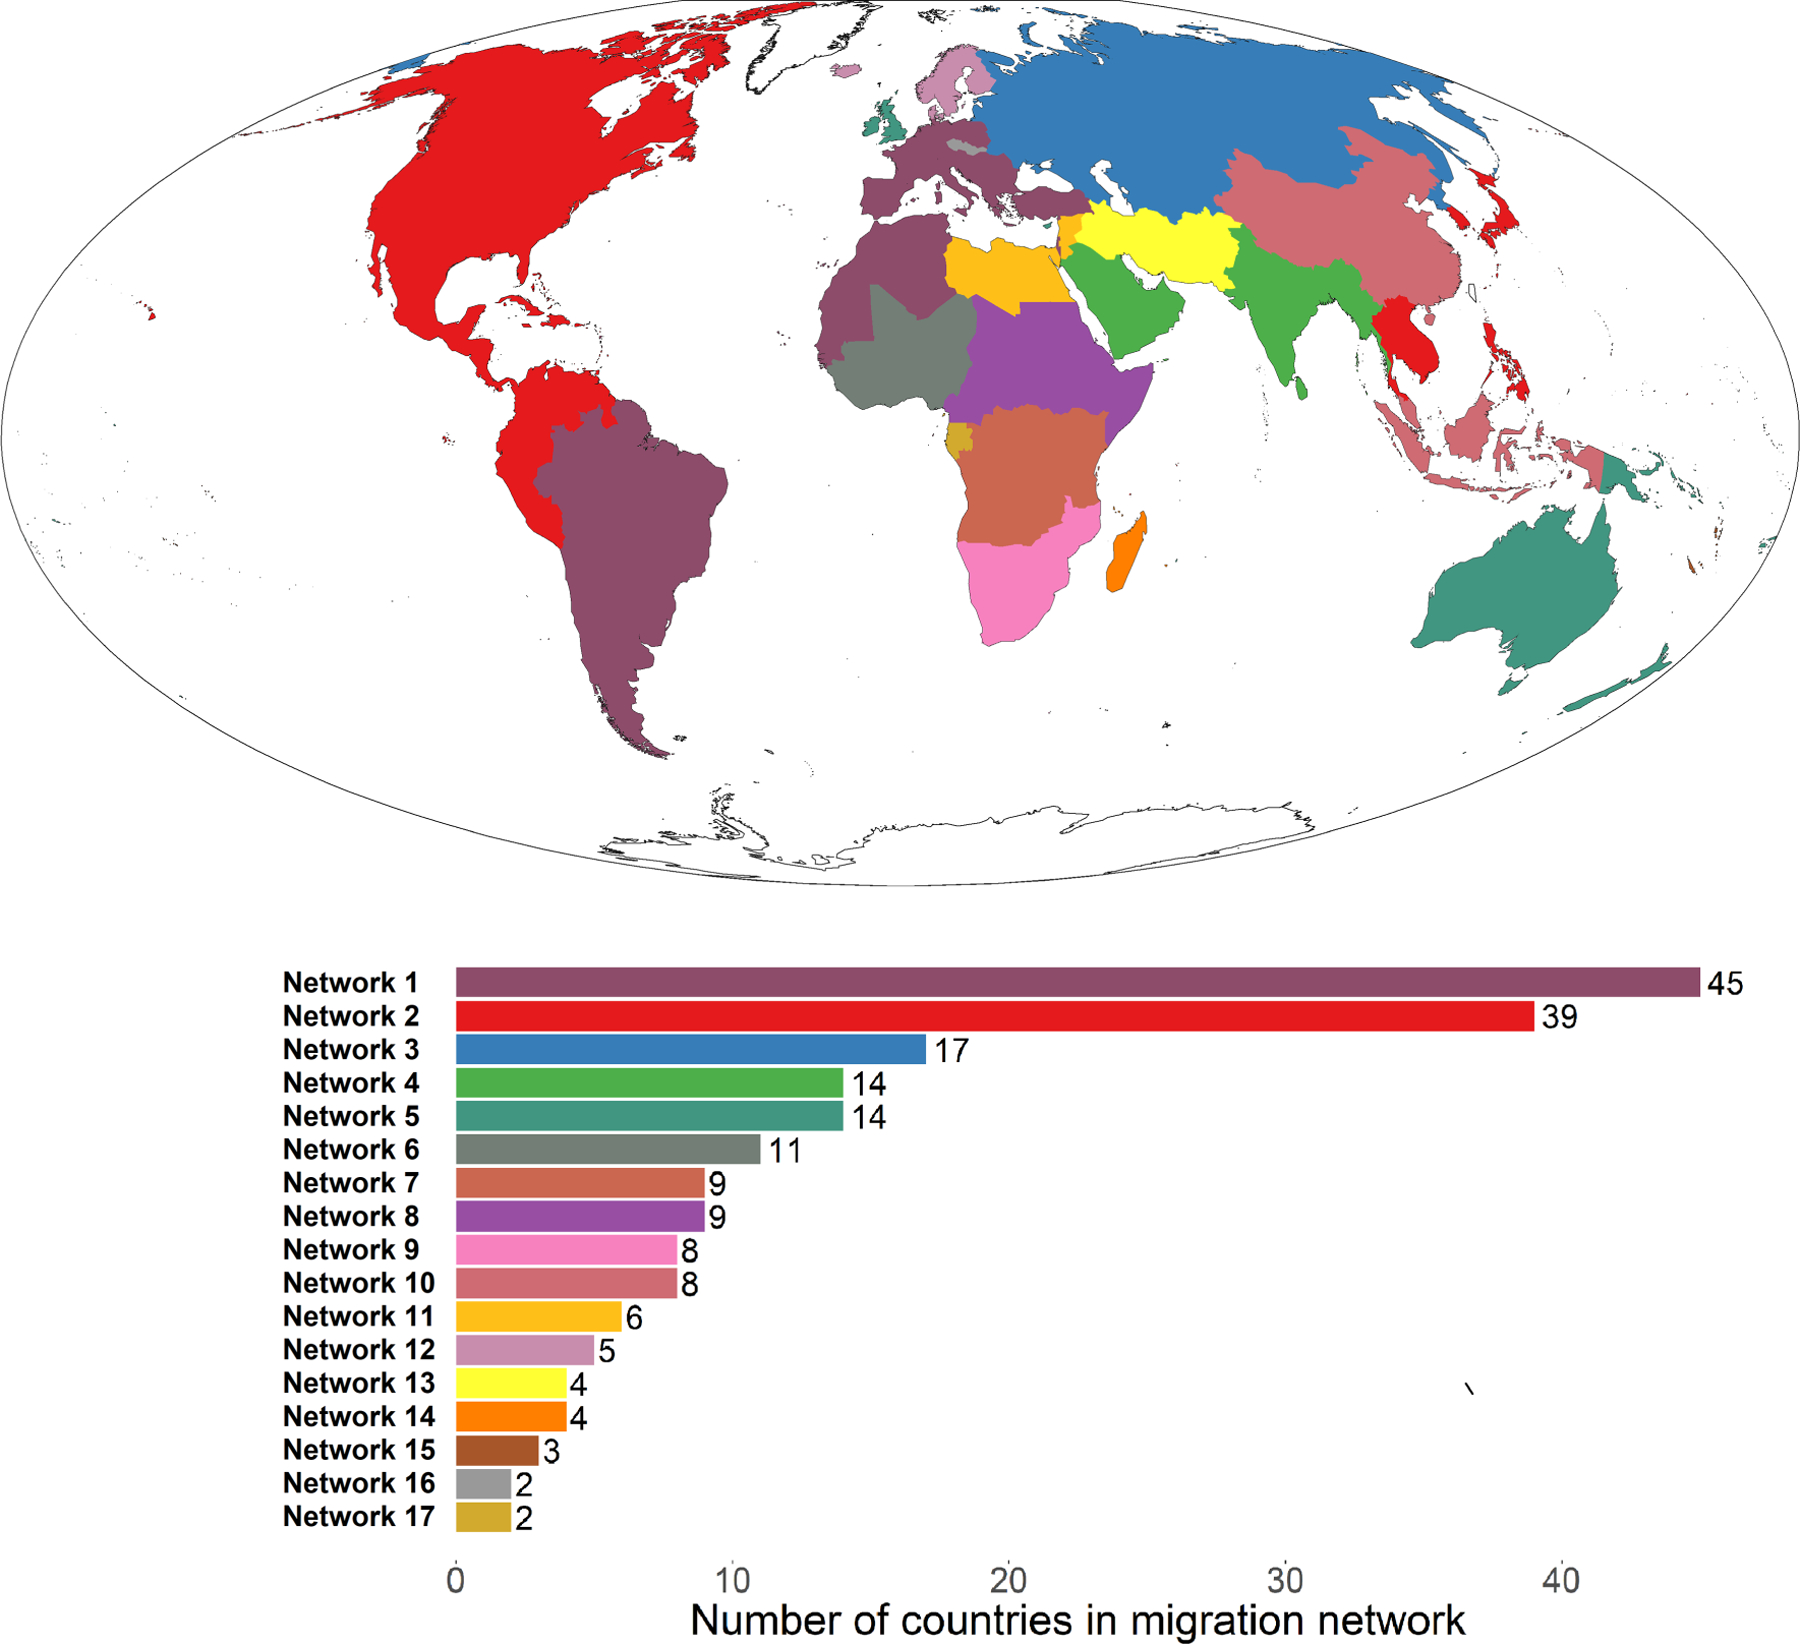
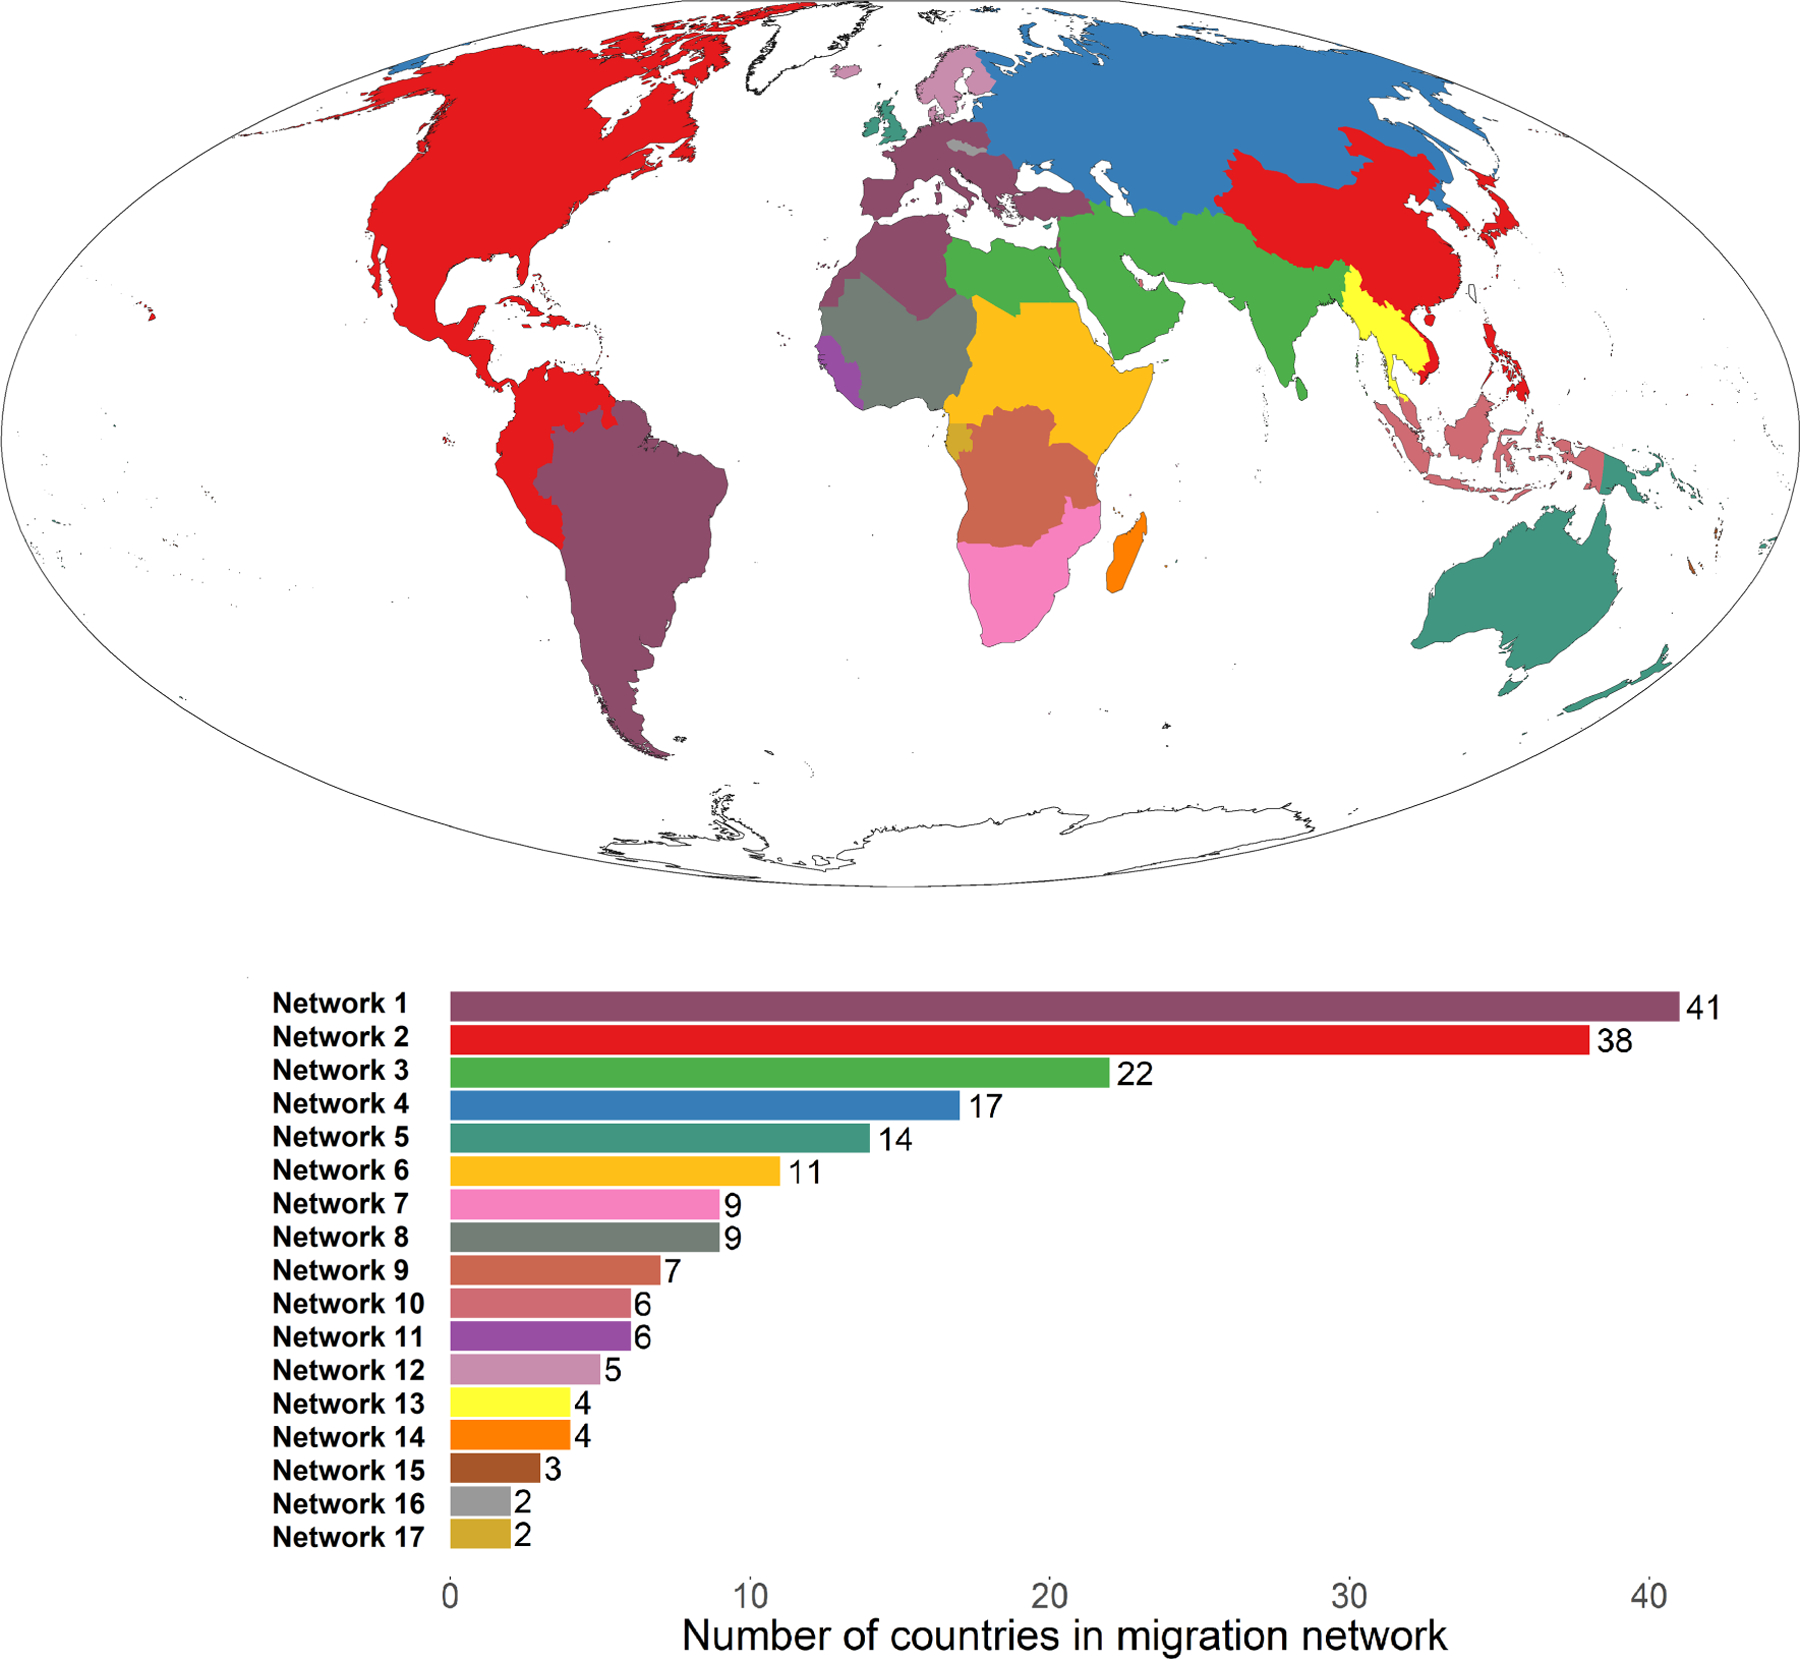
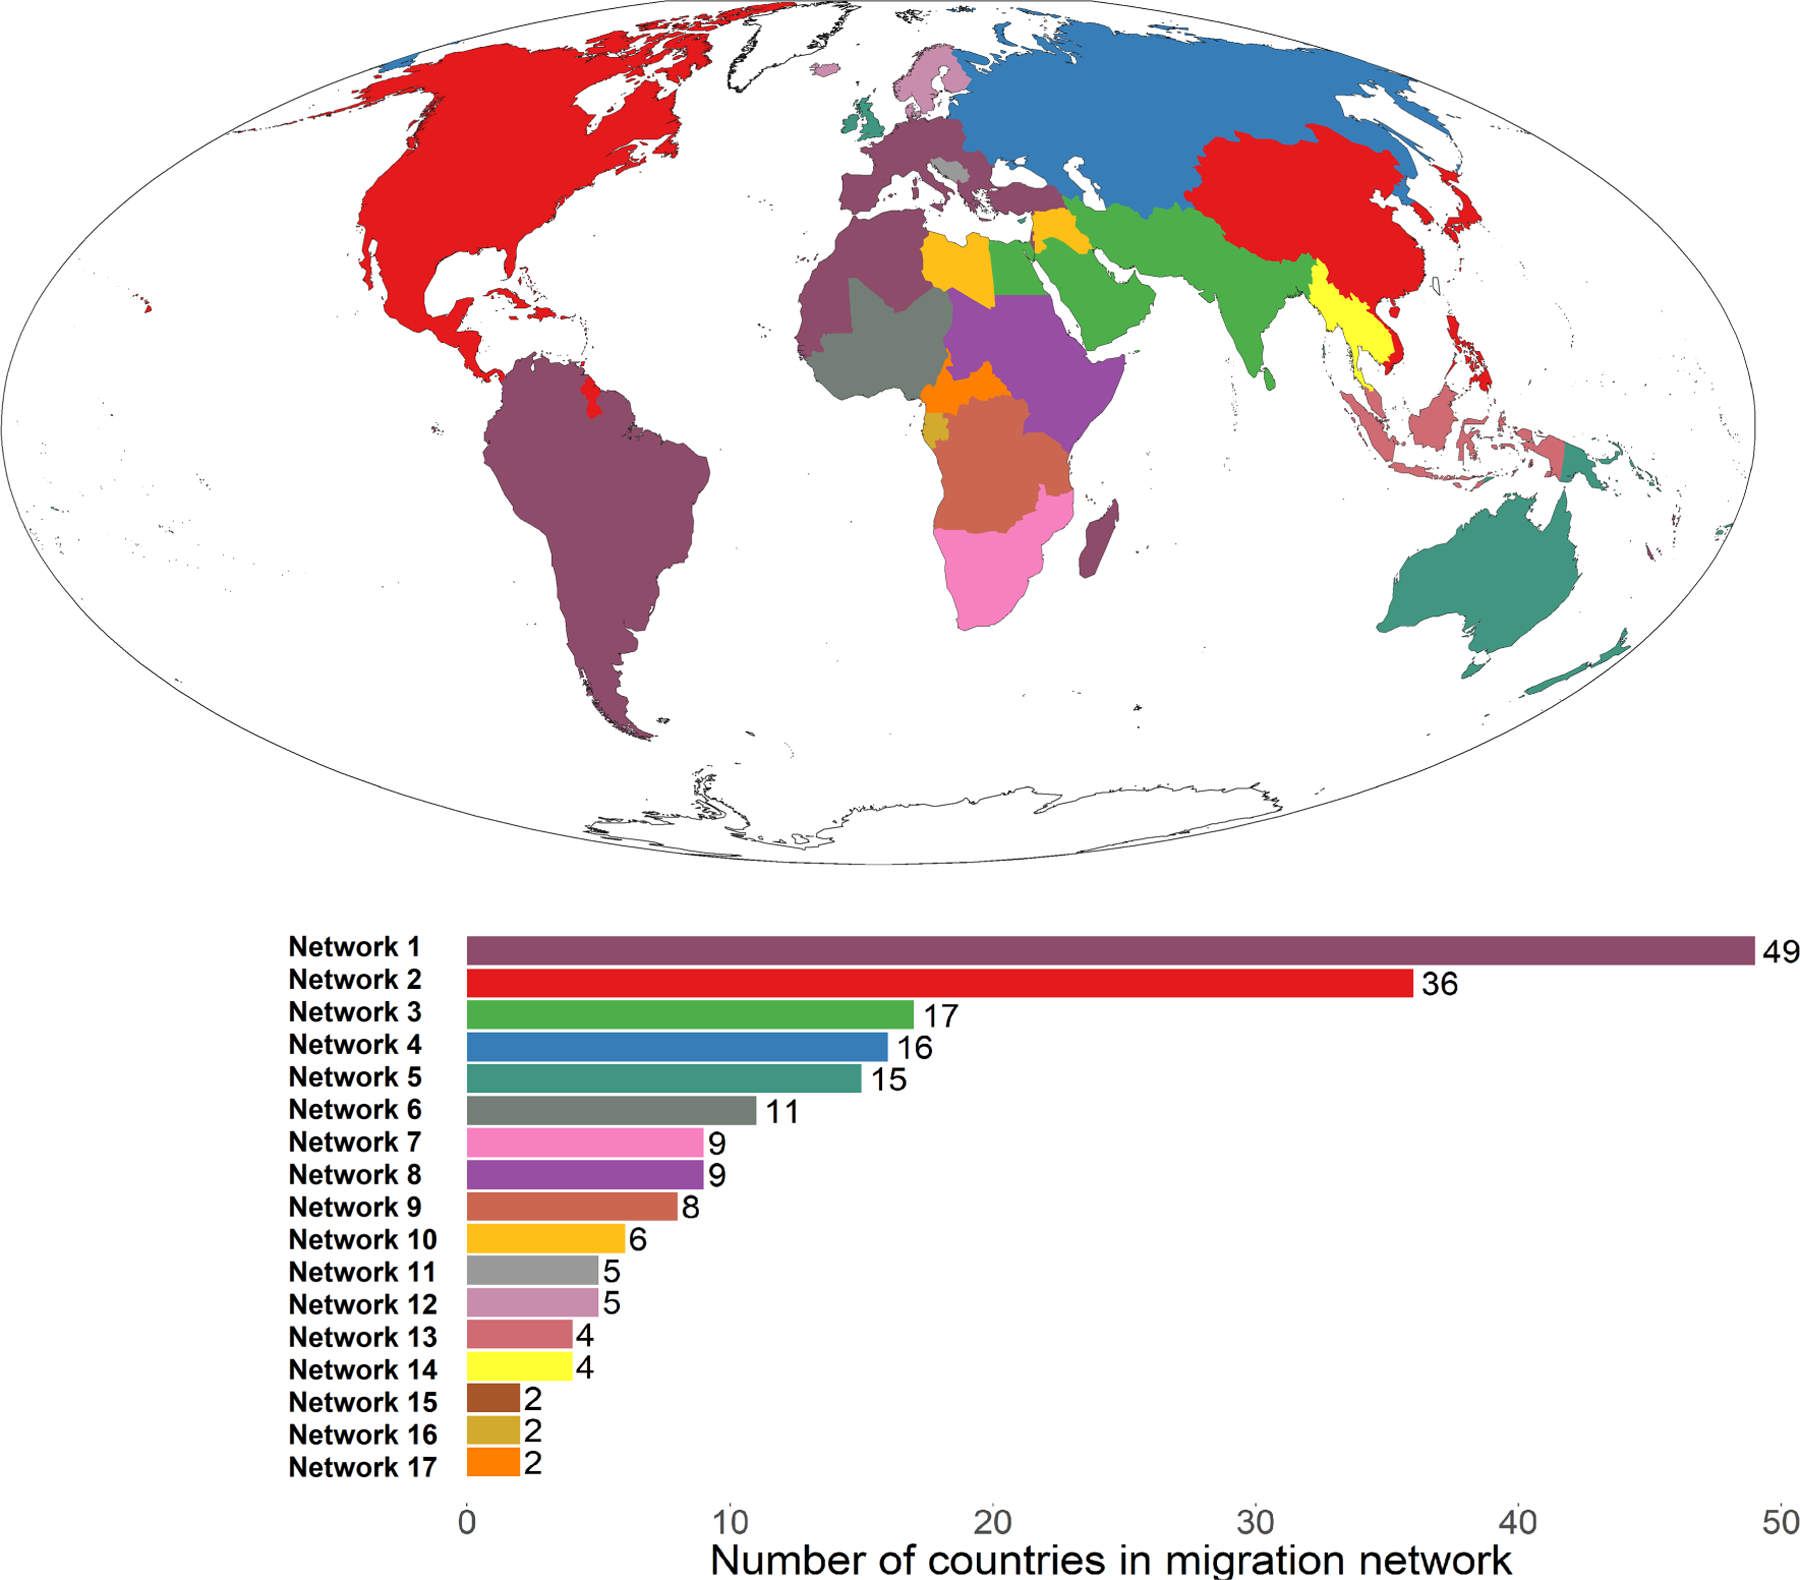
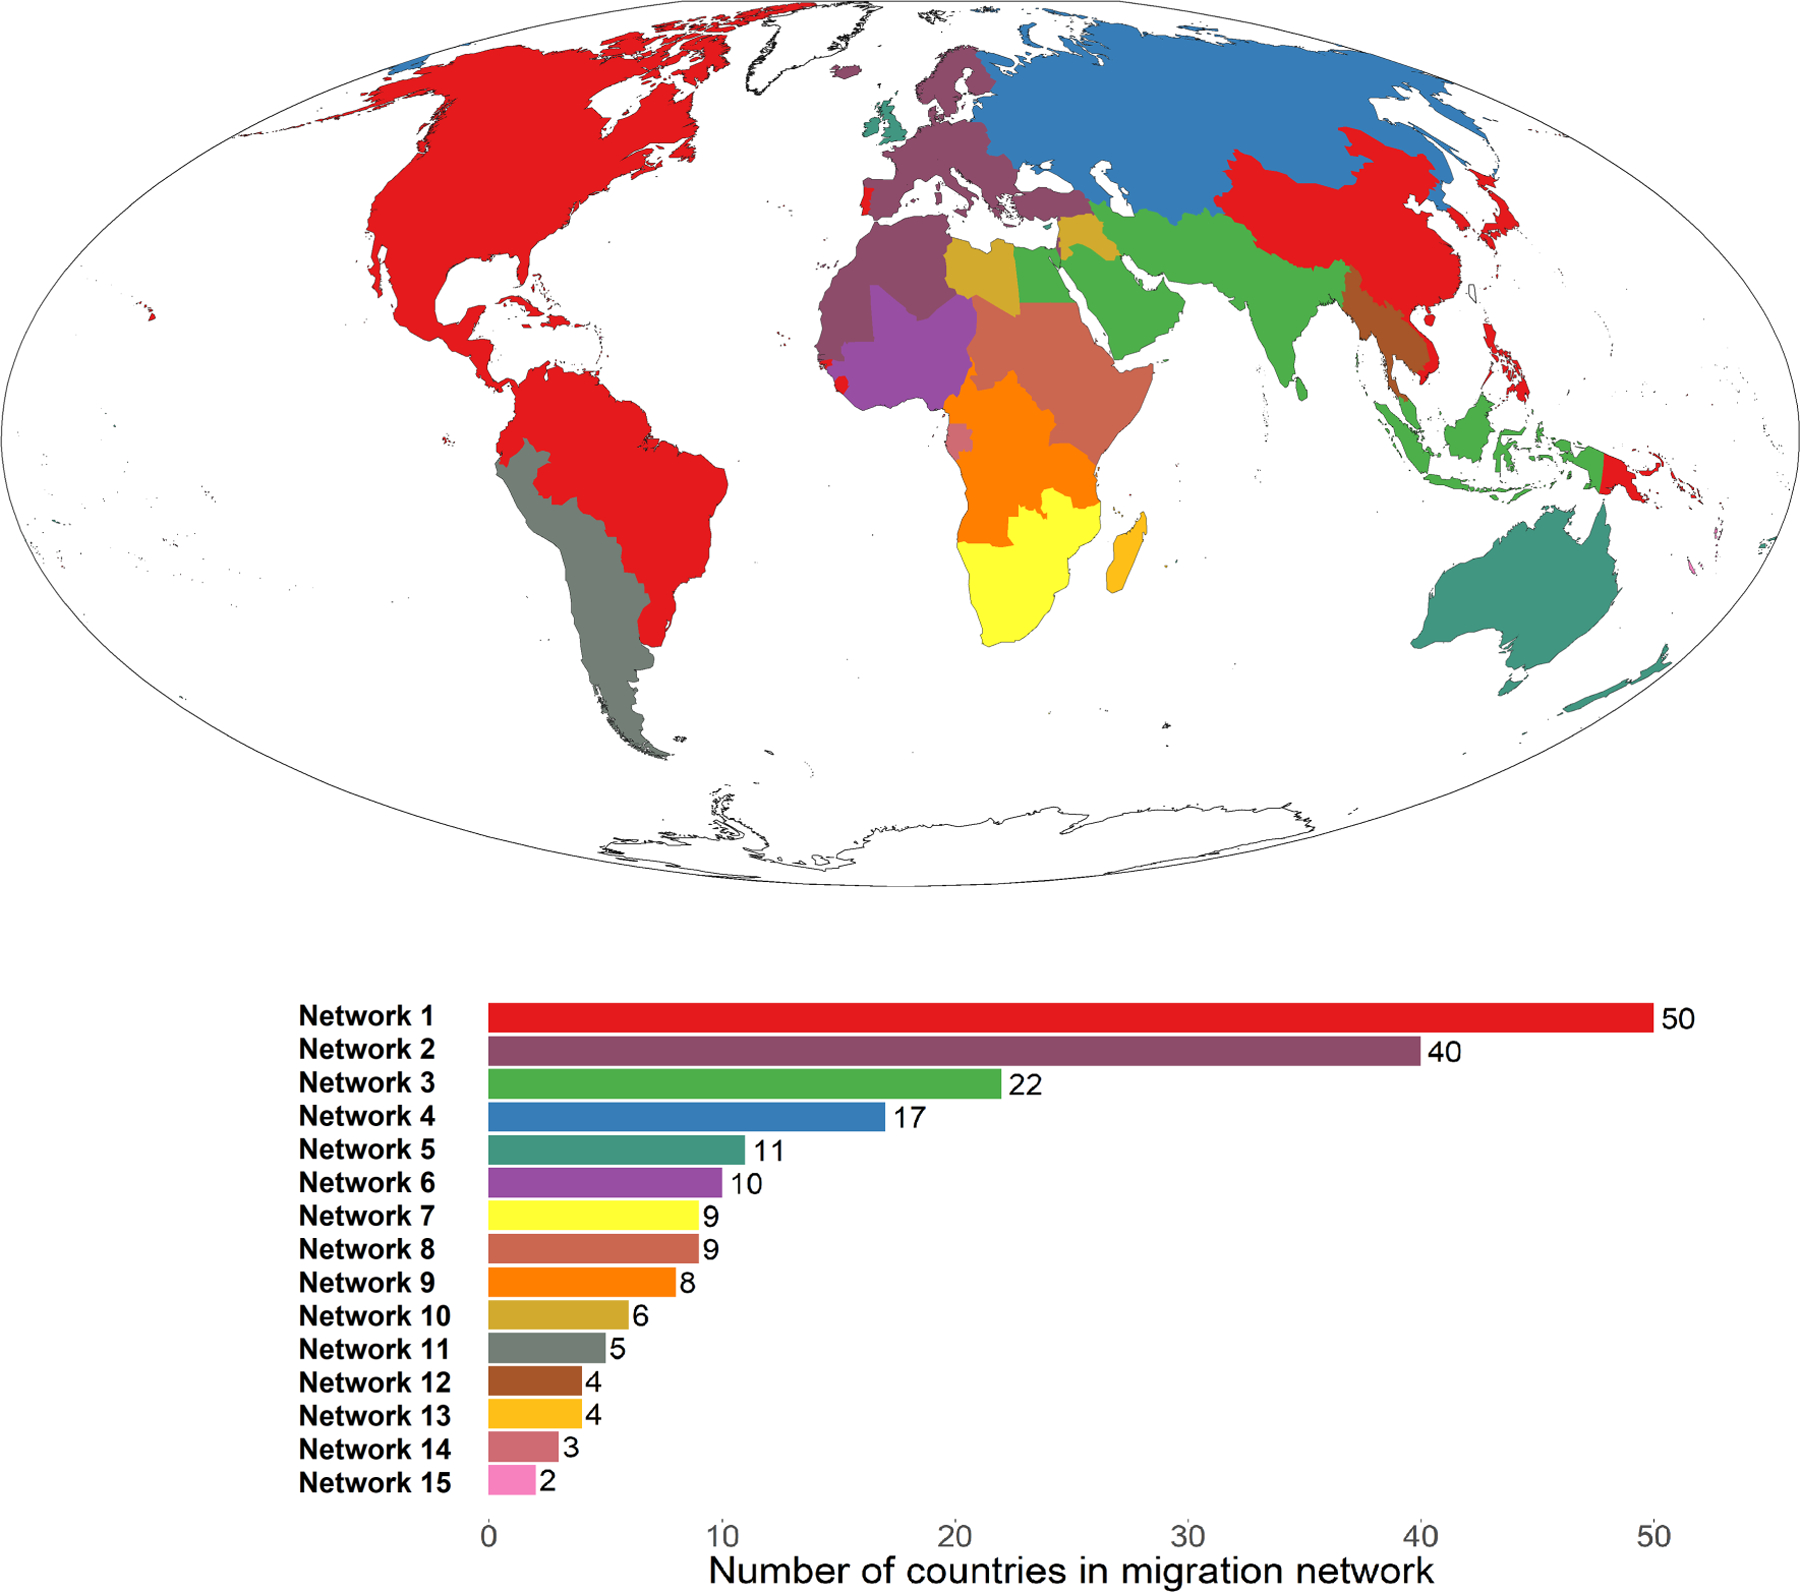
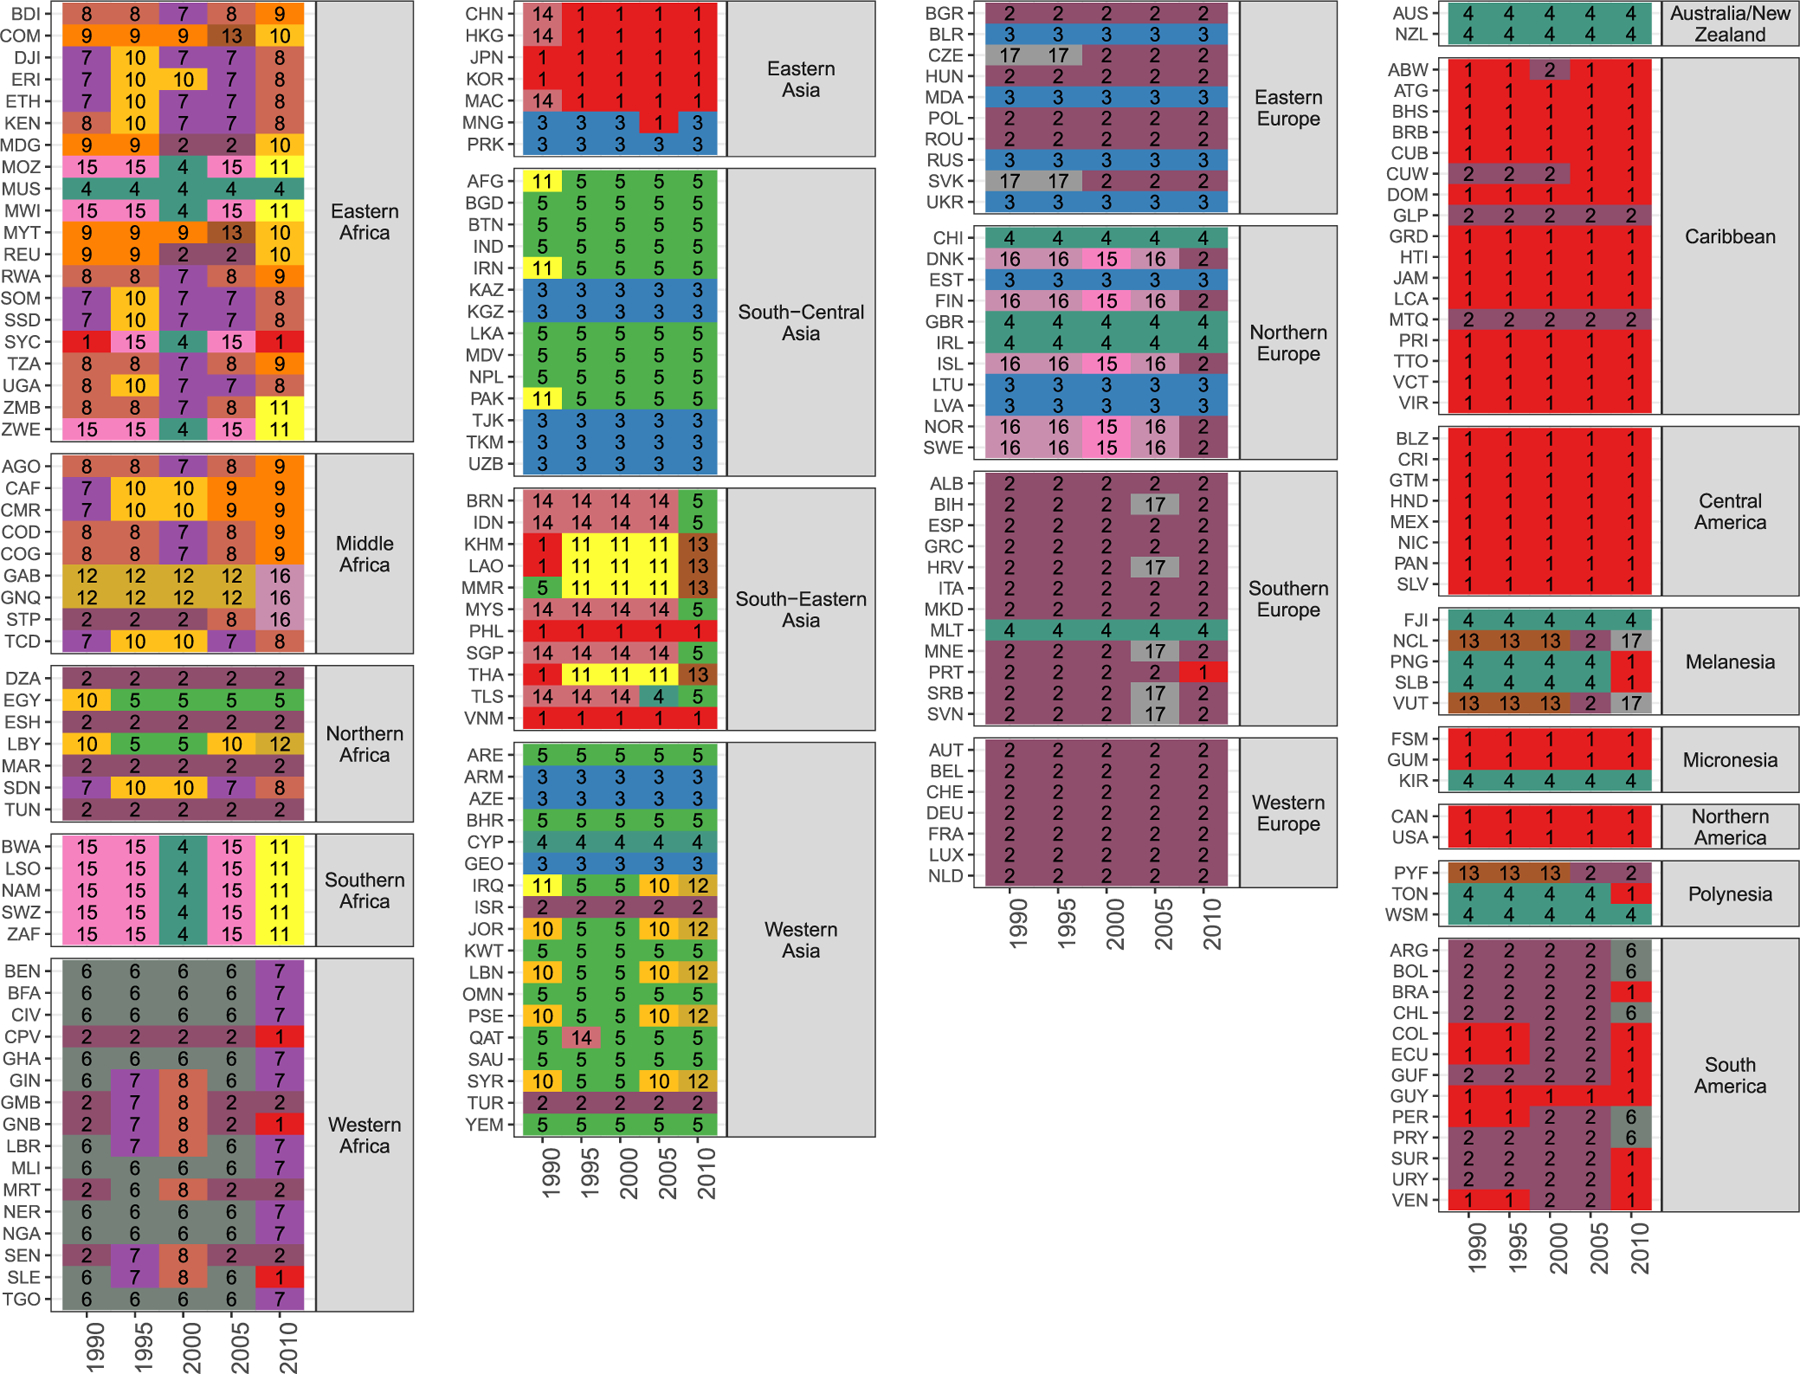
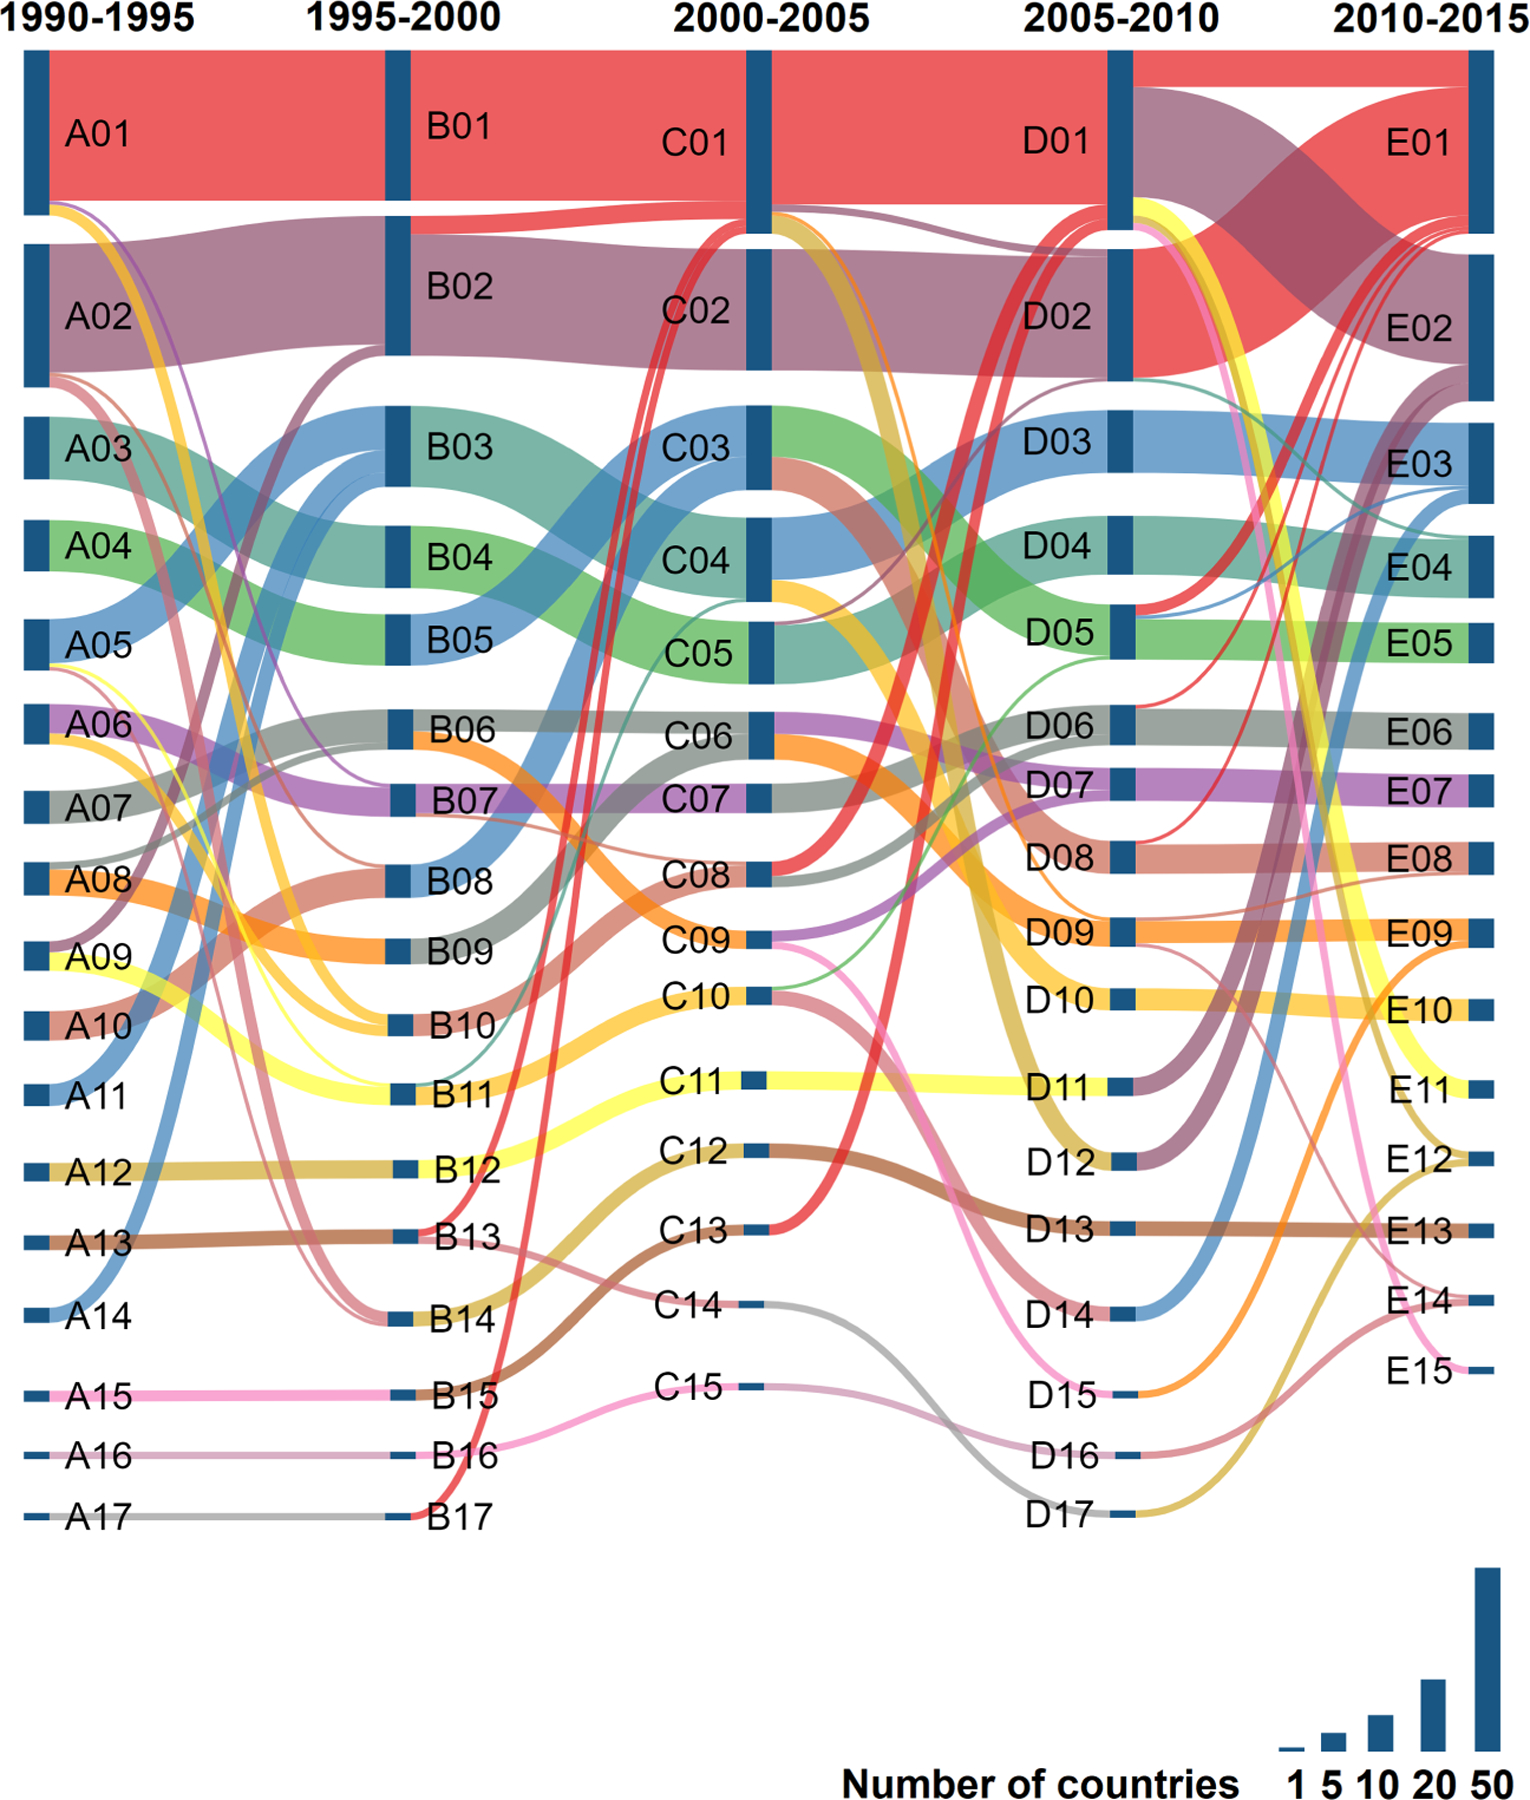
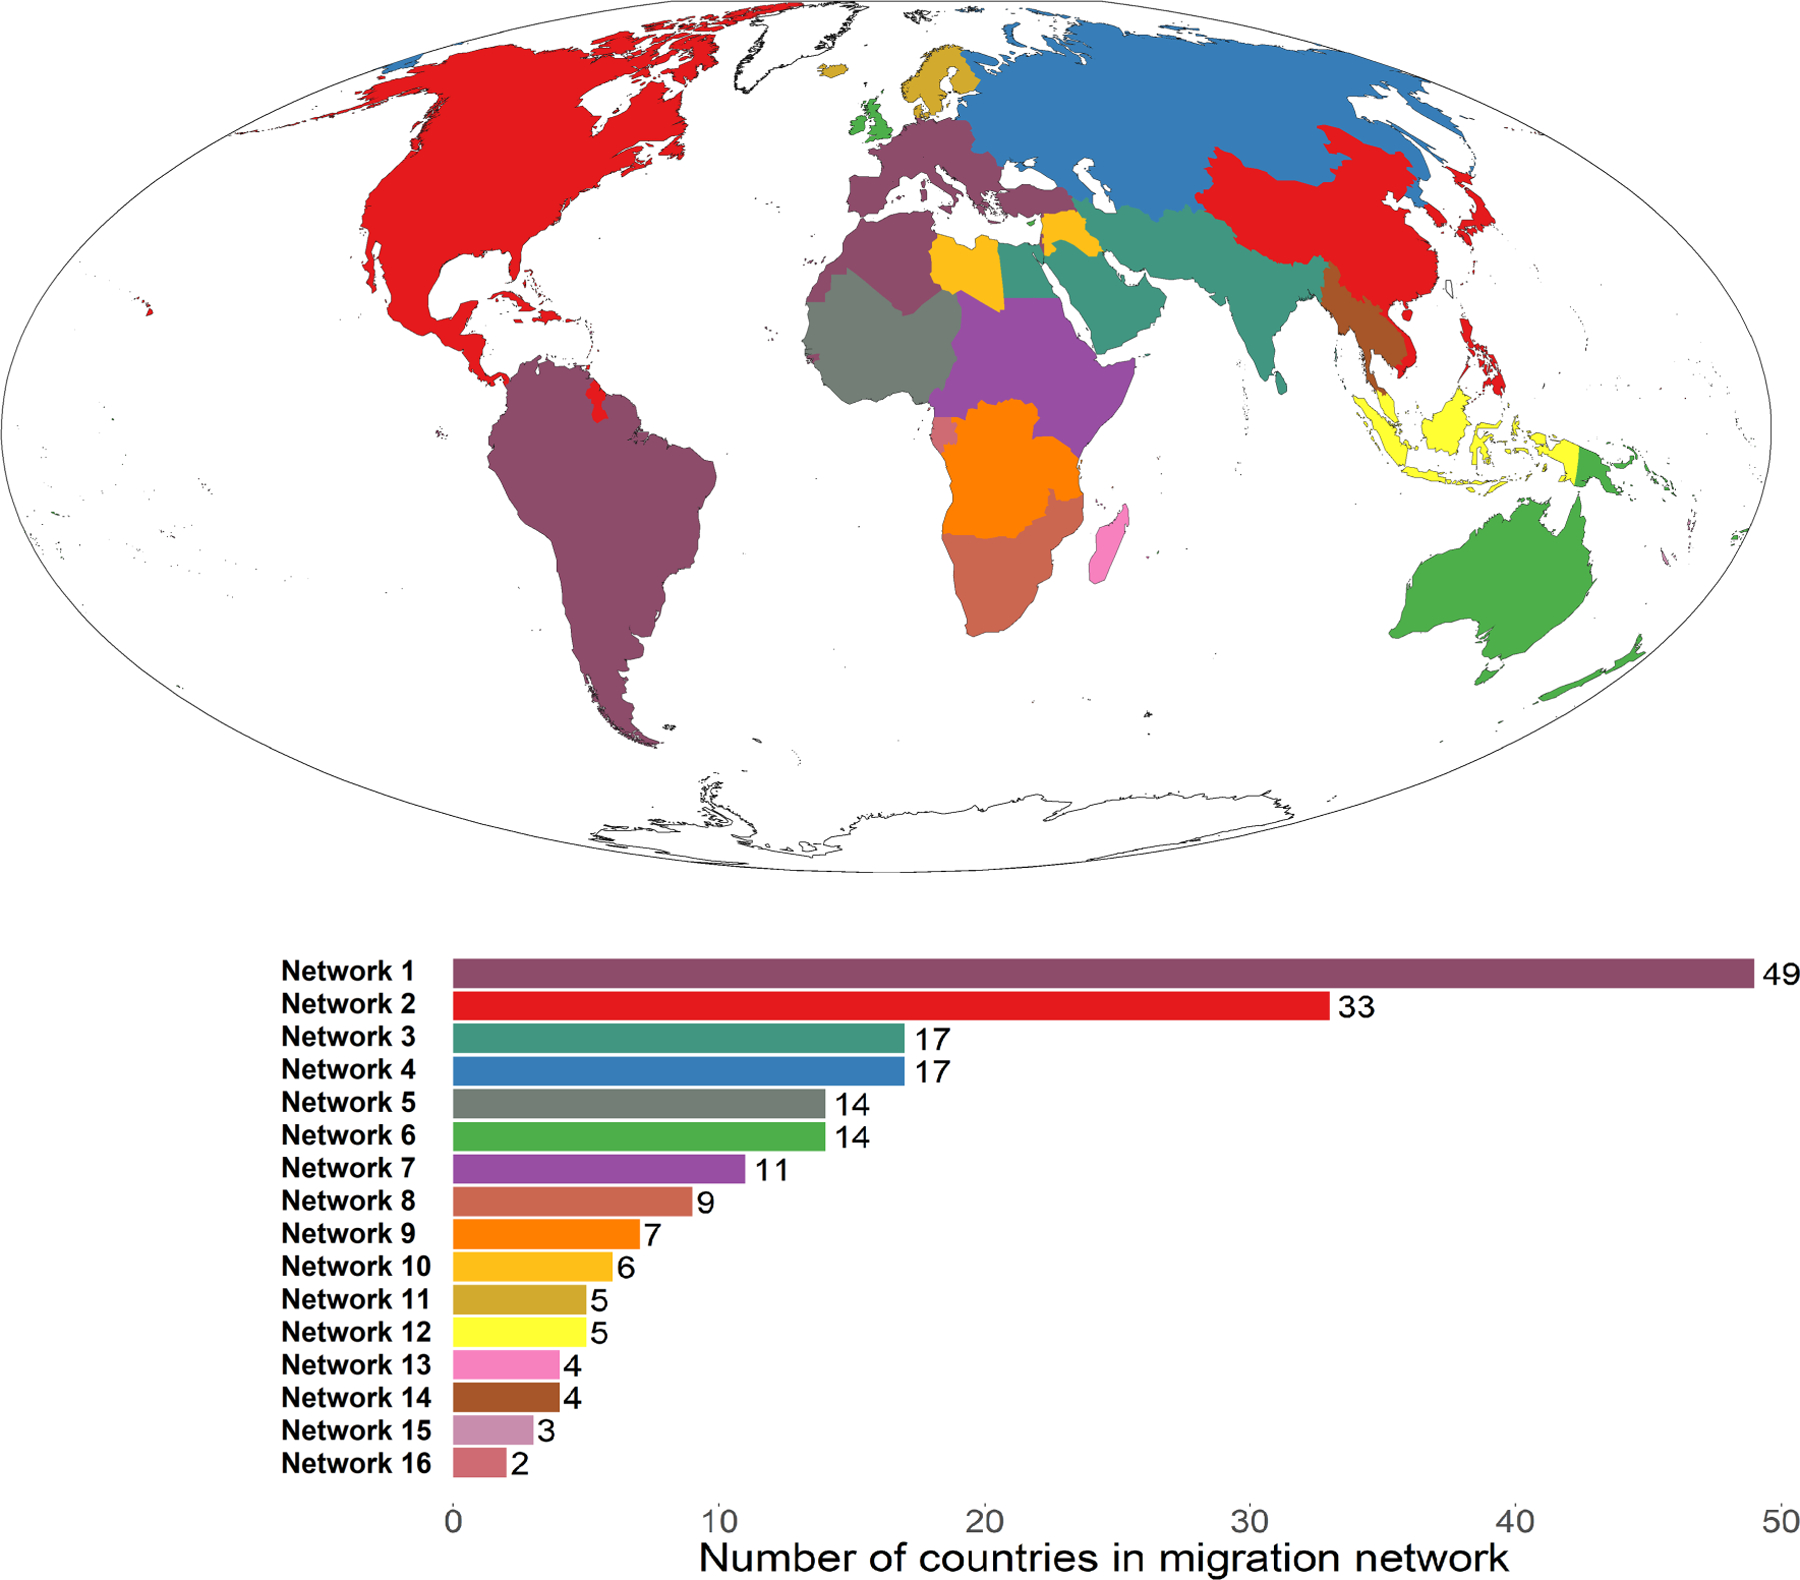
Presently, there is no agreed upon data-driven approach for identifying the geographic boundaries of migration networks that international migration systems are ultimately manifested in. Drawing from research on community detection methods, we introduce and apply the Information Theoretic Community Detection Algorithm for identifying and studying the geographic boundaries of migration networks. Using a new set of estimates of country-to-country migration flows every 5 years from 1990 to 1995 to 2010-2015, we trace the form and evolution of international migration networks over the past 25 years. Consistent with the concept of dynamic stability, we show that the number, size and internal country compositions of international migration networks have been remarkably stable over time; however, we also document many short-term fluctuations. We conclude by reflecting on the spirit of our work in this paper, which is to promote consensus around tools and best practices for identifying and studying international migration networks.

Keywords: community detection; directed networks; international migration; migration flows; migration networks; migration systems.


Conflict of interest statement

CONFLICT OF INTEREST The authors declare no conflict of interest.

Figures

FIGURE 1
FIGURE 1
International migration networks: 1990–1995. Source: Authors’ calculations using data from Abel and Cohen (2019). World map is graphed using the Mollweide projection
FIGURE 2
FIGURE 2
International migration networks: 1995–2000. Source: Authors’ calculations using data from Abel and Cohen (2019). World map is graphed using the Mollweide projection
FIGURE 3
FIGURE 3
International migration networks: 2000–2005. Source: Authors’ calculations using data from Abel and Cohen (2019). World map is graphed using the Mollweide projection
FIGURE 4
FIGURE 4
International migration networks: 2005–2010. Source: Authors’ calculations using data from Abel and Cohen (2019). World map is graphed using the Mollweide projection
FIGURE 5
FIGURE 5
International migration networks: 2010–2015. Source: Authors’ calculations using data from Abel and Cohen (2019). World map is graphed using the Mollweide projection
FIGURE 6
FIGURE 6
Country composition of international migration networks, 1990–1995 to 2010–2015. Please refer to online supporting information file country_codes.csv for corresponding full country names corresponding to the ISO-3 country codes used in the plot. Colors and numbers used to distinguish international migration networks
FIGURE 7
FIGURE 7
Change in international migration networks, 1990–1995 to 2010–2015. Darkened vertical bars indicate the number of international migration networks in each 5-year period. The size of each bar indicates the number of countries composing the migration network. Curved colored bars indicate transitions of countries from one migration network to another between consecutive periods. Please refer to online supporting information file country_membership. csv for corresponding network memberships of each county in each period
FIGURE 8
FIGURE 8
International migration networks: 1990–1995 to 2010–2015. Source: Authors’ calculations using data from Abel and Cohen (2019). Notes: Generating this map, which displays the number and size of international migration networks over the entire 25-year period, requires a constant number of countries in each 5-year period. Accordingly, the number of countries is constant in each 5-year period using 2010–15 country boundaries. World map is graphed using the Mollweide projection

Similar articles

Cited by

References

    1. Abel GJ (2013). Estimating global migration flow tables using place of birth data. Demographic Research, 28, 505–546. 10.4054/demres.2013.28.18 - DOI
    1. Abel GJ (2018). Estimates of global bilateral migration flows by gender between 1960 and 2015. International Migration Review, 52(3), 809–852. 10.1111/imre.12327 - DOI
    1. Abel GJ, & Cohen JE (2019). Bilateral international migration flow estimates for 200 countries. Scientific Data, 6, 82. 10.1038/s41597-019-0089-3 - DOI - PMC - PubMed
    1. Abel GJ, & Sander N (2014). Quantifying global international migration flows. Science, 343, 1520–1522. 10.1126/science.1248676 - DOI - PubMed
    1. Ali S, & Hartmann D (2015). Migration, incorporation, and change in an interconnected world. Routledge. 10.4324/9781315733036 - DOI

LinkOut - more resources