. 2024 Aug 1:7:0433.
doi: 10.34133/research.0433. eCollection 2024.

Mitophagy Promotes Hair Regeneration by Activating Glutathione Metabolism

Affiliations

Mitophagy Promotes Hair Regeneration by Activating Glutathione Metabolism

Dehuan Wang et al. Research (Wash D C). .

Abstract

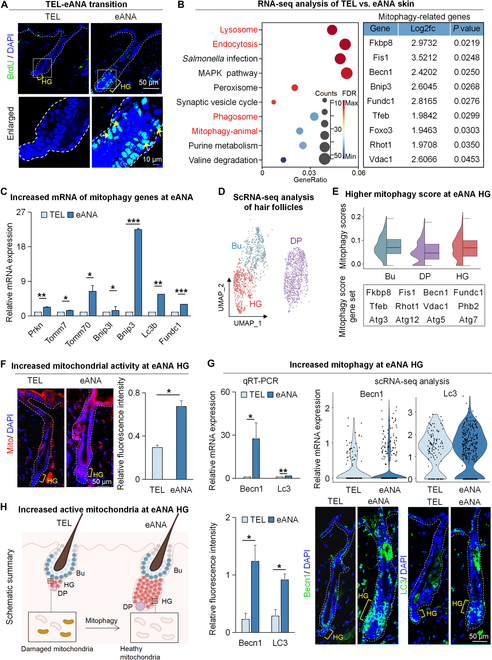
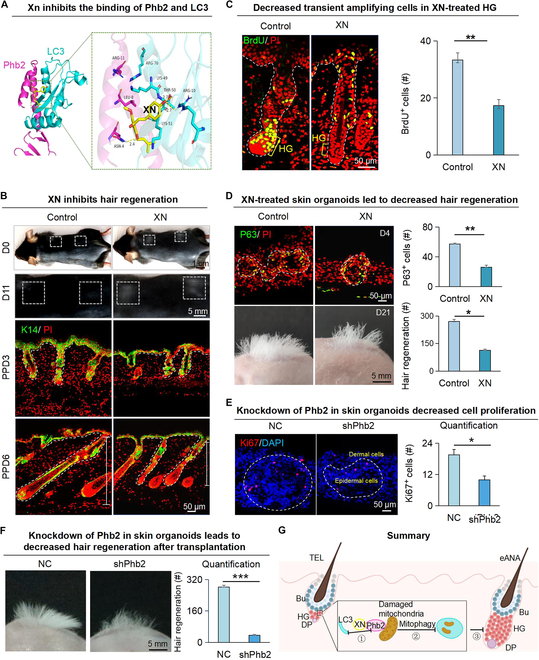
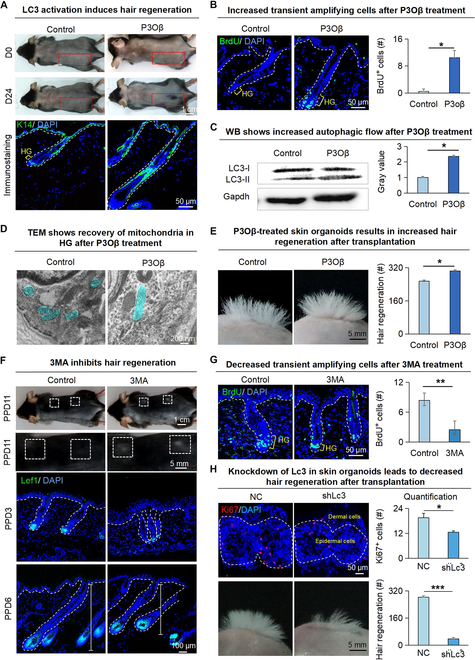
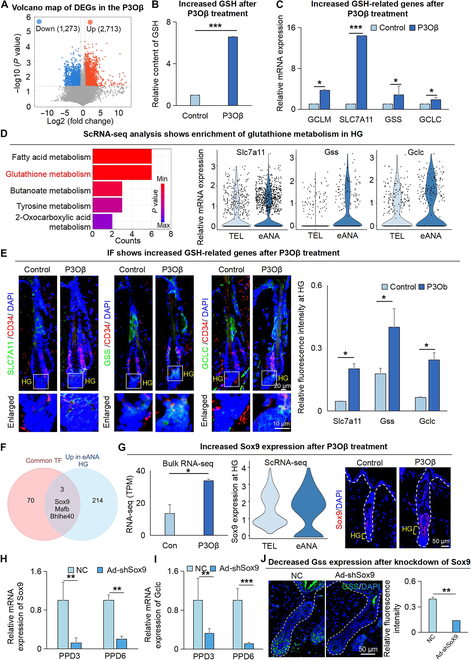
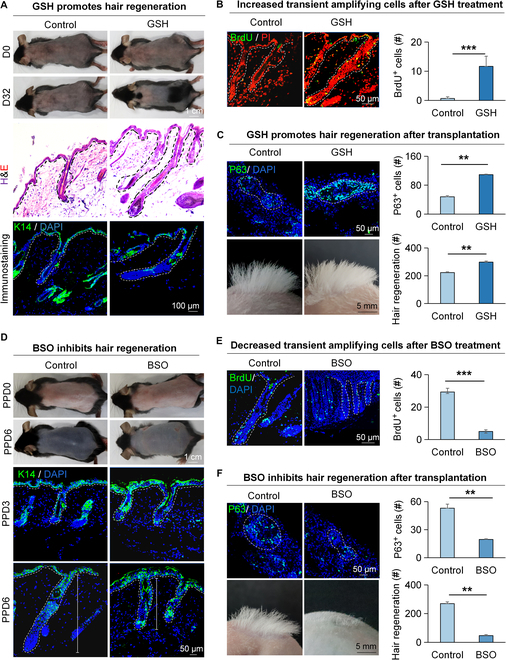
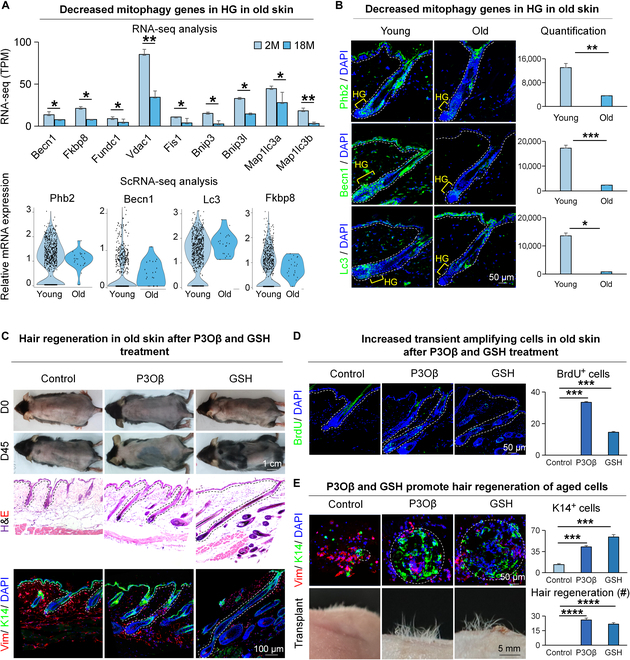
Mitophagy maintains tissue homeostasis by self-eliminating defective mitochondria through autophagy. How mitophagy regulates stem cell activity during hair regeneration remains unclear. Here, we found that mitophagy promotes the proliferation of hair germ (HG) cells by regulating glutathione (GSH) metabolism. First, single-cell RNA sequencing, mitochondrial probe, transmission electron microscopy, and immunofluorescence staining showed stronger mitochondrial activity and increased mitophagy-related gene especially Prohibitin 2 (Phb2) expression at early-anagen HG compared to the telogen HG. Mitochondrial inner membrane receptor protein PHB2 binds to LC3 to initiate mitophagy. Second, molecular docking and functional studies revealed that PHB2-LC3 activates mitophagy to eliminate the damaged mitochondria in HG. RNA-seq, single-cell metabolism, immunofluorescence staining, and functional validation discovered that LC3 promotes GSH metabolism to supply energy for promoting HG proliferation. Third, transcriptomics analysis and immunofluorescence staining indicated that mitophagy was down-regulated in the aged compared to young-mouse HG. Activating mitophagy and GSH pathways through small-molecule administration can reactivate HG cell proliferation followed by hair regeneration in aged hair follicles. Our findings open up a new avenue for exploring autophagy that promotes hair regeneration and emphasizes the role of the self-elimination effect of mitophagy in controlling the proliferation of HG cells by regulating GSH metabolism.


Conflict of interest statement

Competing interests: The authors declare that there is no conflict of interest regarding the publication of this article.

Figures

Fig. 1.
Fig. 1.
Increased mitophagy activity at early-anagen HG. (A) BrdU immunostaining for hair follicles during the transition from telogen to early anagen. Scale bars, 50 μm and 10 μm. (B) RNA-seq compares gene expression between telogen and early-anagen HFSCs. KEGG analysis shows the lysosome, endocytosis, phagosome, and mitophagy signaling pathways enriched in differentially expressed genes (DEGs) of telogen and early-anagen HFSCs (left). The table shows genes expressed in mitophagy pathways (right). (C) Quantitative RT-PCR shows mitophagy pathway genes that are differentially expressed at telogen (TEL) versus early anagen (eANA). N = 3, ***P < 0.001, **P < 0.01, *P < 0.05. (D) UMAP plots of Bu, HG, and DP clusters by unbiased clustering. (E) Half VlnPlot displays mitophagy scores of Bu, HG, and DP clusters. (F) Mitochondrial probe shows mitochondrial activity at telogen and early anagen. Scale bars, 50 μm. N = 3, *P < 0.05. (G) Quantitative RT-PCR, VlnPlot, and immunofluorescence staining show the expression of Becn1 and Lc3 in HG. Scale bars, 50 μm. N = 3, *P < 0.05. (H) Schematic of hair regeneration. During the transition from telogen to early anagen of the hair follicle, mitophagy activity is elevated in HG, which may drive hair regeneration.
Fig. 2.
Fig. 2.
Increased expression of Phb2 at early-anagen HG. (A) Dissection microscopy, H&E staining and K14 immunofluorescence staining of hair follicles show that KYP induces hair regeneration. D0 represents the 0th day after shaving. Scale bars, 1 cm and 50 μm. (B) BrdU immunofluorescence staining shows that KYP promotes the proliferation of HG cells. The white arrow represents the Brdu+ cell. Scale bars, 20 μm and 10 μm. N = 3, **P < 0.01. (C) TEM shows that KYP promotes the recovery of mitochondrial activity in hair follicles. Scale bars, 200 nm. (D) RNA-seq compares gene expression in hair follicles between control and KYP-treated groups. KEGG analysis shows the mitophagy signaling pathway enriched in DEGs of control and KYP-treated groups (left). The table displays the genes expressed in the mitophagy pathway (right). (E) Quantitative RT-PCR shows the mRNA expression of mitophagy pathway that are differentially expressed in control and KYP-treated groups. N = 3, *P < 0.05. (F) Quantitative RT-PCR, VlnPlot, and immunofluorescence staining show the expression of Phb2 in HG. Scale bars, 50 μm. N = 3, *P < 0.05. (G) Venn diagram shows the number of common TFs predicted by Phb2 and the genes up-regulated at early anagen HG (left). Potential binding sites for Bhlhe40 to the Phb2 promoter sequences (right). (H) Left: Representative immunofluorescence images show the expression of Phb2 from shBhlhe40 and NC groups. Right: Quantitative analysis of relative fluorescence intensity. n = 3, *P < 0.05.
Fig. 3.
Fig. 3.
Inhibition of PHB2 and LC3 binding by XN inhibits hair regeneration. (A) PyMOL displays the molecular docking results of XN with LC3 and Phb2. (B) Dissection microscopy and K14 immunofluorescence staining of hair follicles show that XN inhibits hair regeneration at PPD3, PPD6, and PPD11. Scale bars, 1 cm, 5 mm, and 50 μm. (C) BrdU immunofluorescence staining shows that XN inhibits the proliferation of HG cells at PPD3. Scale bars, 50 μm. N = 3, **P < 0.01. (D) XN in skin organoids inhibits hair regeneration after transplantation. P63 immunofluorescence staining of skin organoid cultures of newborn mice cells shows the epidermal stem cells. Dissection microscopy and statistical analysis show hair regeneration after transplantation. Scale bars, 50 μm and 5 mm. N = 3, **P < 0.01, *P < 0.05. (E) Left: Representative immunofluorescence images of Ki67 in skin organoids from shPhb2 and NC groups. Dashed lines indicate epidermal cell clusters inside and dermal cells outside. Right: Quantitative analysis of Ki67+ cell numbers. n = 3, *P < 0.05. (F) Left: Representative images illustrating hair regeneration after skin organoid transplantation from the NC and shPhb2 groups. Right: Quantitative analysis of the number of hair follicles regenerated. n = 3, ***P < 0.001. (G) Schematic of XN inhibiting the binding of Phb2 and LC3 and inhibiting hair regeneration.
Fig. 4.
Fig. 4.
Lc3 mediated mitophagy to promote the proliferation of HG cells and hair regeneration. (A) Dissection microscopy, H&E staining, and K14 immunofluorescence staining of hair follicles show that P3Oβ induces hair regeneration. Scale bars, 1 cm and 50 μm. (B) BrdU immunofluorescence staining shows that P3Oβ promotes the proliferation of HG cells. Scale bars, 50 μm. N = 3, *P < 0.05. (C) Western blot and statistical analysis show that P3Oβ promotes the formation of autophagic flow from LC3-I to LC3-II. N = 3, *P < 0.05. (D) TEM shows that P3Oβ promotes the recovery of mitochondrial activity in hair follicles. Scale bars, 200 nm. (E) Dissection microscopy and statistical analysis show hair regeneration after transplantation. Scale bars, 5 mm. N = 3, *P < 0.05. (F) Dissection microscopy and Lef1 immunofluorescence staining of hair follicles show that 3MA inhibits hair regeneration at PPD3, PPD6, and PPD11. Scale bars, 1 cm, 5 mm, and 50 μm. (G) BrdU immunofluorescence staining shows that 3MA inhibits the proliferation of HG cells at PPD3. Scale bars, 50 μm. N = 3, **P < 0.01. (H) Left: Representative image showing Ki67 expression in skin organoids upon KD of Lc3 (upper). Representative images illustrating hair regeneration after skin organoid transplantation from the NC and shLc3 groups (lower). Right: Quantitative analysis of Ki67+ cell numbers (upper); quantitative analysis of the number of hair follicles regenerated (lower). n = 3, *P < 0.05, ***P < 0.001.
Fig. 5.
Fig. 5.
Lc3 regulates the GSH metabolism pathway in HG cells. (A) Volcano map compares gene expression in hair follicles between control and P3Oβ-treated groups. (B) The GSH assay kit determined the GSH content of control and P3Oβ-treated groups. (C) Quantitative RT-PCR shows the mRNA expression of the GSH metabolism pathway that is differentially expressed in the control and P3Oβ-treated groups. (D) ScRNA-seq compares gene expression in hair follicles between telogen and early anagen. KEGG analysis shows the GSH metabolism enriched in HG (left). VlnPlot shows the mRNA expression of GSH metabolism pathways that are differentially expressed in HG between telogen and early anagen. (E) Immunofluorescence staining of Slc7a11, Gss, and Gclc show the expression of HG in the control group and P3Oβ-treated group. Scale bars, 50 μm and 10 μm. N = 3, *P < 0.05. (F) Venn diagram shows the number of common TFs predicted by 4 genes related to GSH synthesis and the gene up-regulated at early-anagen HG. (G) Quantitative RT-PCR, VlnPlot, and immunostaining show the expression of Sox9 in HG. Scale bars, 50 μm. N = 3, *P < 0.05. (H) Quantitative RT-PCR shows the expression level of Sox9 from NC and Ad-shSox9 group at PPD3 and PPD6. n = 3, **P < 0.01. (I) Quantitative RT-PCR shows the expression of Gclc from NC and Ad-shSox9 group at PPD3 and PPD6. n = 3, **P < 0.01, ***P < 0.001. (J) Representative immunofluorescence images show the expression of Gss from Ad-shSox9 and NC groups. Right: Quantitative analysis of relative fluorescence intensity. Scale bars, 50 μm. n = 3, **P < 0.01.
Fig. 6.
Fig. 6.
GSH promotes the proliferation of HG cells and hair regeneration. (A) Dissection microscopy, H&E staining, and K14 immunofluorescence staining of hair follicles show that GSH induces hair regeneration. Scale bars, 1 cm and 50 μm. (B) BrdU immunofluorescence staining shows that GSH promotes the proliferation of HG cells. Scale bars, 50 μm. N = 3, ***P < 0.001. (C) GSH in skin organoids promotes hair regeneration after transplantation. P63 immunofluorescence staining of skin organoid cultures of newborn mice cells shows the epidermal stem cells. Dissection microscopy and statistical analysis show hair regeneration after transplantation. Scale bars, 50 μm and 5 mm. N = 3, **P < 0.01. (D) Dissection microscopy and K14 immunofluorescence staining of hair follicles show that BSO Inhibits hair regeneration at PPD3 and PPD6. PPD0 represents the 0th day after plucking. Scale bars, 1 cm, 5 mm, and 50 μm. (E) BrdU immunofluorescence staining shows that BSO inhibits the proliferation of HG cells at PPD3. Scale bars, 50 μm. N = 3, ***P < 0.001. (F) BSO in skin organoids inhibits hair regeneration after transplantation. P63 immunofluorescence staining of skin organoid cultures of newborn mice cells shows the epidermal stem cells. Dissection microscopy and statistical analysis show hair regeneration after transplantation. Scale bars, 50 μm and 5 mm. N = 3, **P < 0.01.
Fig. 7.
Fig. 7.
P3Oβ and GSH promote hair regeneration in aged mice. (A) RNA-seq shows the mRNA expression of the mitophagy pathway that is differentially expressed in young and aged mice. VlnPlot shows the mRNA expression of the mitophagy pathway that is differentially expressed in young and aged mice. N = 3, **P < 0.01, *P < 0.05. (B) Immunofluorescence of Phb2, Becn1, and Lc3 shows the expression of HG in young and aged mice. Scale bars, 50 μm. N = 3, ***P < 0.001, **P < 0.01, *P < 0.05. (C) Dissection microscopy, H&E staining, and K14 immunofluorescence staining of hair follicles show that P3Oβ and GSH induce hair regeneration in aged mice. Scale bars, 1 cm and 50 μm. (D) BrdU immunofluorescence staining shows that P3Oβ and GSH induce the proliferation of HG cells in aged mice. Scale bars, 50 μm. N = 3, ***P < 0.001. (E) P3Oβ and GSH in skin organoids induce hair regeneration after transplantation. K14 and Vimentin immunofluorescence staining of skin organoid cultures of adult mice cells shows the formation of aggregates. Dissection microscopy and statistical analysis show hair regeneration after transplantation. Scale bars, 50 μm and 5 mm. N = 3, ****P < 0.0001, ***P < 0.001.

References

    1. Lei M, Chuong C-M. Aging, alopecia, and stem cells. Science. 2016;351(6273):559–560. - PubMed
    1. Greco V, Chen T, Rendl M, Schober M, Pasolli HA, Stokes N, dela Cruz-Racelis J, Fuchs E. A two-step mechanism for stem cell activation during hair regeneration. Cell Stem Cell. 2009;4(2):155–169. - PMC - PubMed
    1. Zhang M, Wang M, Jiang J, Liu W, Zhou S, Wang D, Wang M, Zhao Z, Xu Z, Wu W, et al. . COX2-ATP synthase regulates spine follicle size in hedgehogs. Int J Biol Sci. 2023;19(15):4763–4777. - PMC - PubMed
    1. Flores A, Schell J, Krall AS, Jelinek D, Miranda M, Grigorian M, Braas D, White AC, Zhou JL, Graham NA, et al. . Lactate dehydrogenase activity drives hair follicle stem cell activation. Nat Cell Biol. 2017;19(9):1017–1026. - PMC - PubMed
    1. Kim CS, Ding X, Allmeroth K, Biggs LC, Kolenc OI, L’Hoest N, Chacón-Martínez CA, Edlich-Muth C, Giavalisco P, Quinn KP, et al. . Glutamine metabolism controls stem cell fate reversibility and long-term maintenance in the hair follicle. Cell Metab. 2020;32(4):629–642.e8. - PubMed

LinkOut - more resources