. 2024 Jul 28;30(28):3428-3446.
doi: 10.3748/wjg.v30.i28.3428.

Effects of elafibranor on liver fibrosis and gut barrier function in a mouse model of alcohol-associated liver disease

Affiliations

Effects of elafibranor on liver fibrosis and gut barrier function in a mouse model of alcohol-associated liver disease

Aritoshi Koizumi et al. World J Gastroenterol. .

Abstract

Background: Alcohol-associated liver disease (ALD) is a leading cause of liver-related morbidity and mortality, but there are no therapeutic targets and modalities to prevent ALD-related liver fibrosis. Peroxisome proliferator activated receptor (PPAR) α and δ play a key role in lipid metabolism and intestinal barrier homeostasis, which are major contributors to the pathological progression of ALD. Meanwhile, elafibranor (EFN), which is a dual PPARα and PPARδ agonist, has reached a phase III clinical trial for the treatment of metabolic dysfunction-associated steatotic liver disease and primary biliary cholangitis. However, the benefits of EFN for ALD treatment is unknown.

Aim: To evaluate the inhibitory effects of EFN on liver fibrosis and gut-intestinal barrier dysfunction in an ALD mouse model.

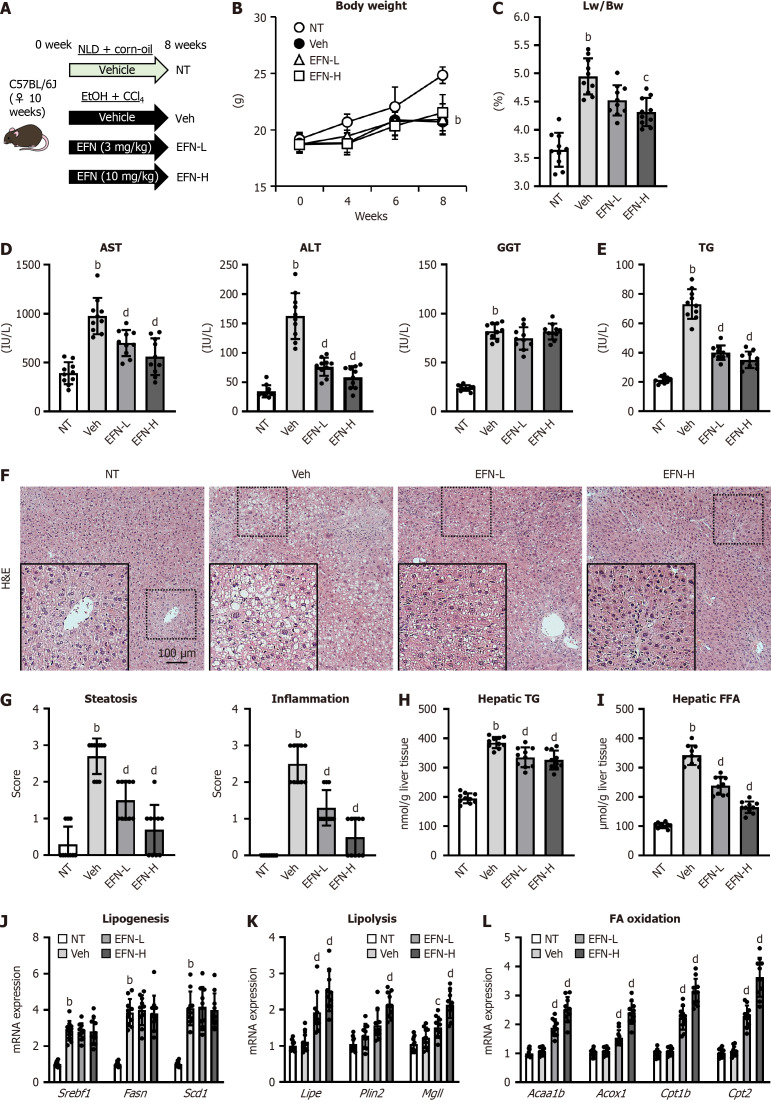
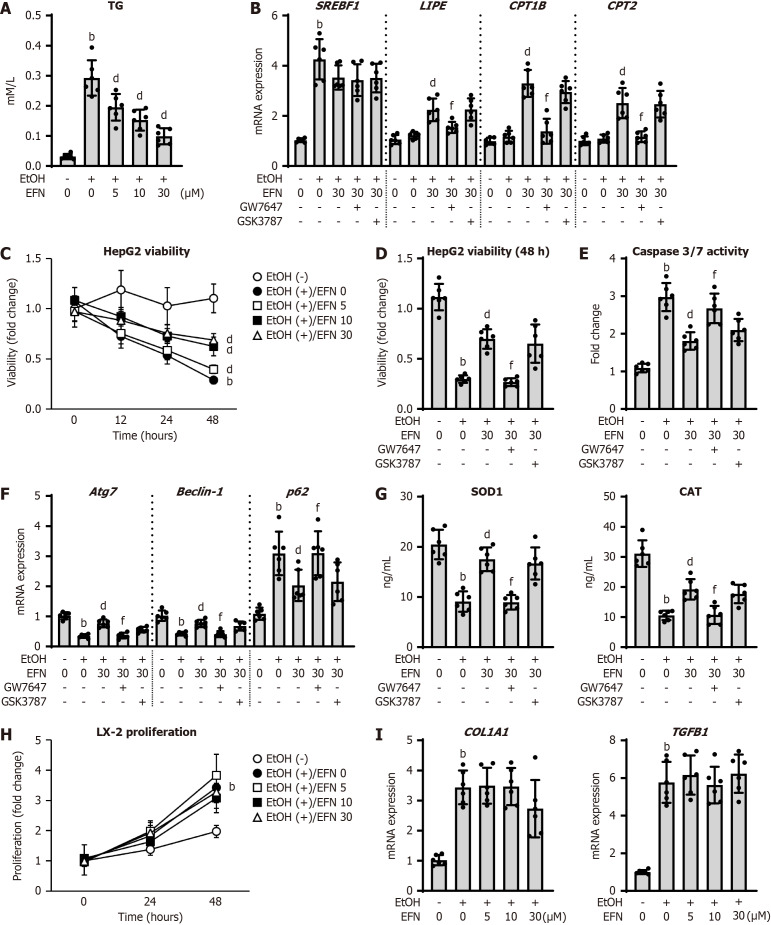
Methods: ALD-related liver fibrosis was induced in female C57BL/6J mice by feeding a 2.5% ethanol (EtOH)-containing Lieber-DeCarli liquid diet and intraperitoneally injecting carbon tetrachloride thrice weekly (1 mL/kg) for 8 weeks. EFN (3 and 10 mg/kg/day) was orally administered during the experimental period. Histological and molecular analyses were performed to assess the effect of EFN on steatohepatitis, fibrosis, and intestinal barrier integrity. The EFN effects on HepG2 lipotoxicity and Caco-2 barrier function were evaluated by cell-based assays.

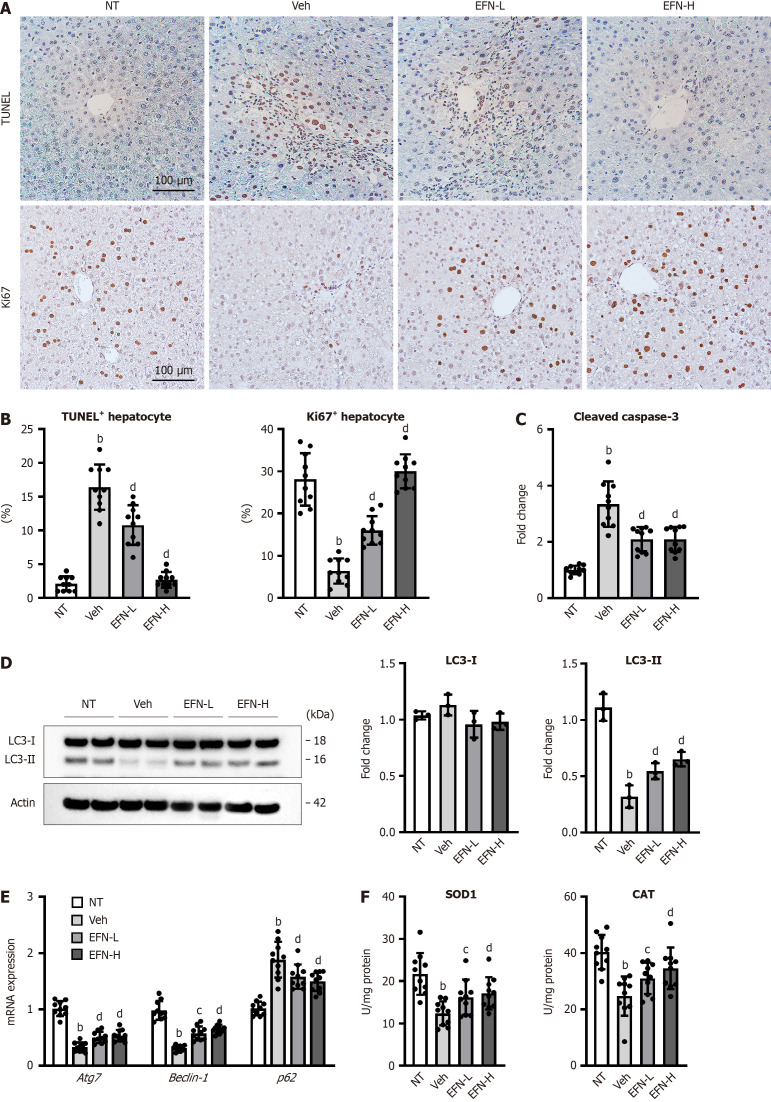
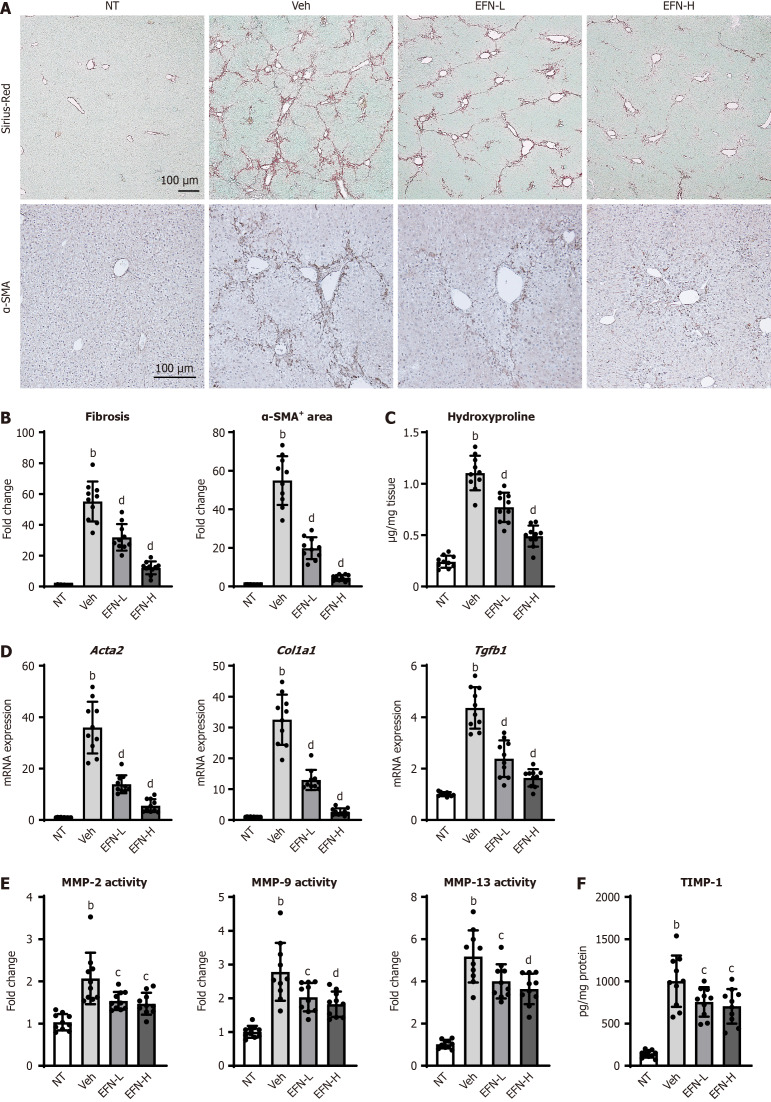
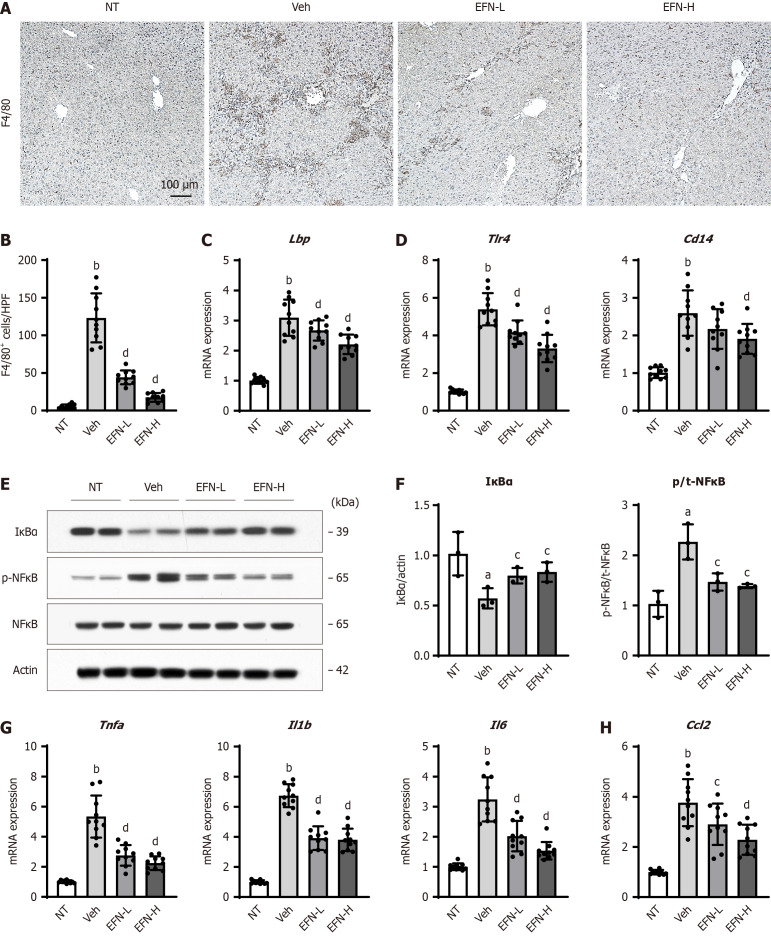
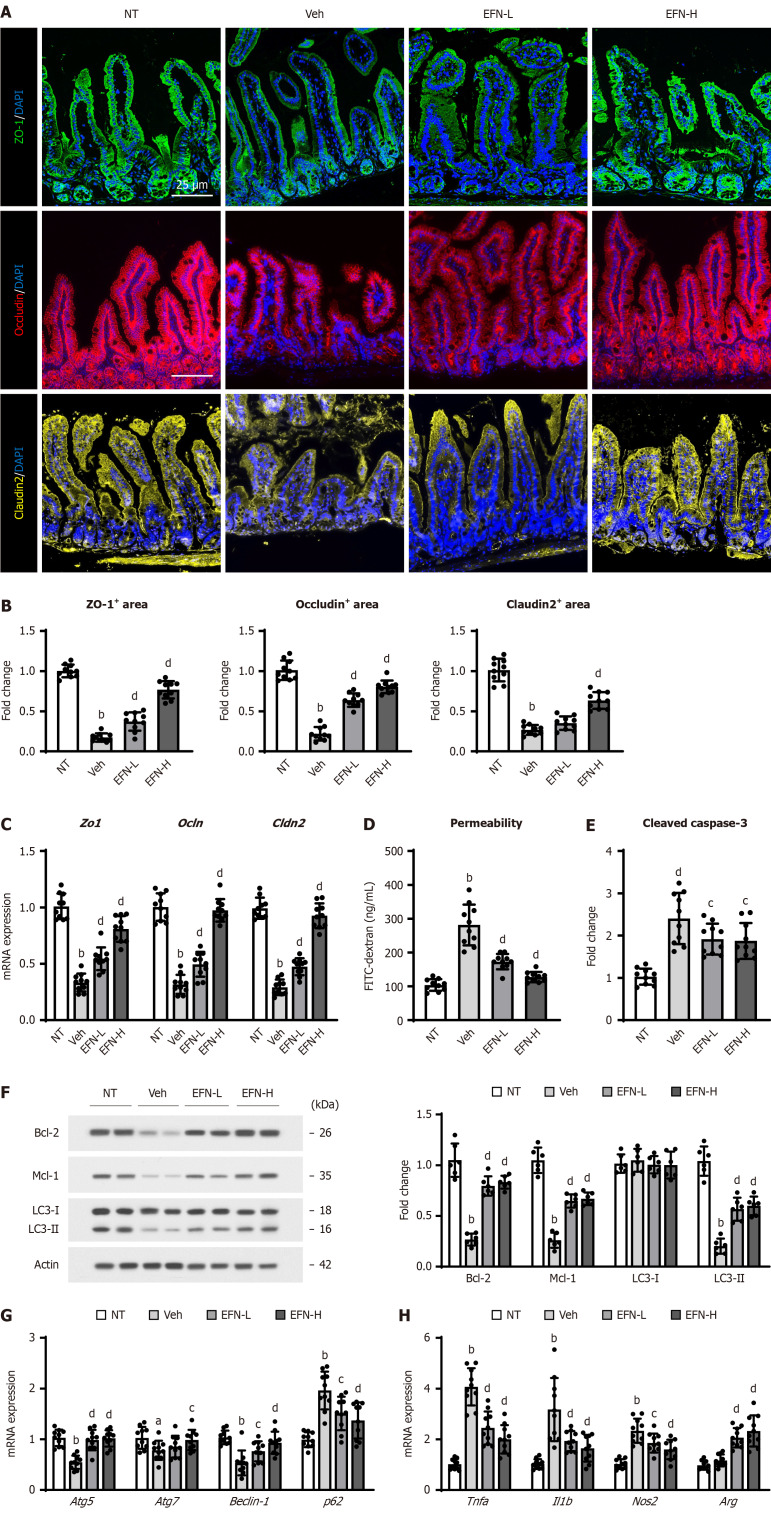
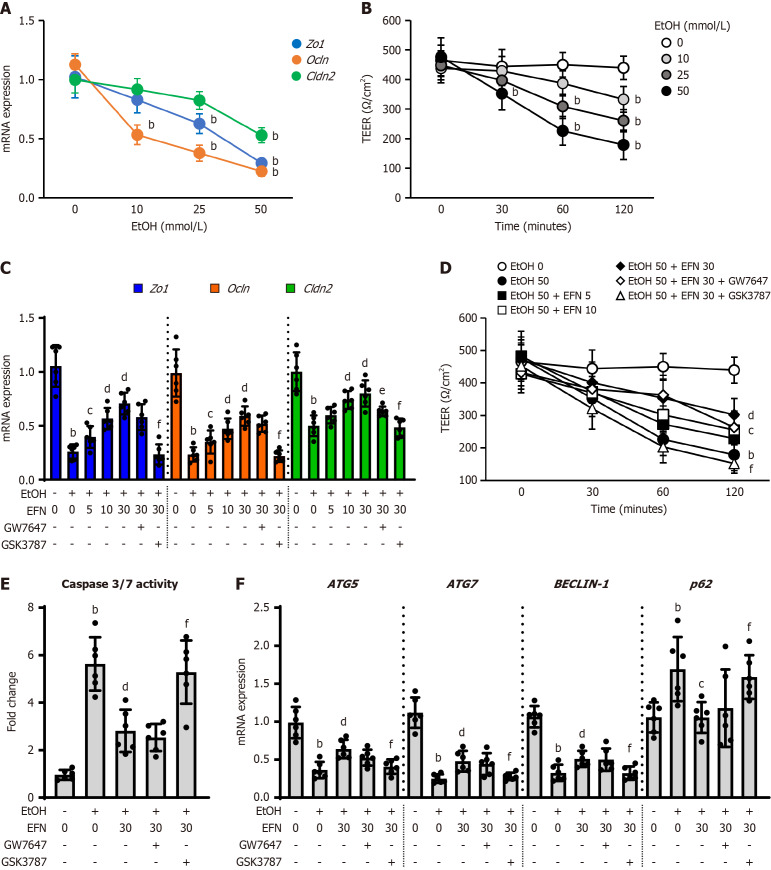
Results: The hepatic steatosis, apoptosis, and fibrosis in the ALD mice model were significantly attenuated by EFN treatment. EFN promoted lipolysis and β-oxidation and enhanced autophagic and antioxidant capacities in EtOH-stimulated HepG2 cells, primarily through PPARα activation. Moreover, EFN inhibited the Kupffer cell-mediated inflammatory response, with blunted hepatic exposure to lipopolysaccharide (LPS) and toll like receptor 4 (TLR4)/nuclear factor kappa B (NF-κB) signaling. EFN improved intestinal hyperpermeability by restoring tight junction proteins and autophagy and by inhibiting apoptosis and proinflammatory responses. The protective effect on intestinal barrier function in the EtOH-stimulated Caco-2 cells was predominantly mediated by PPARδ activation.

Conclusion: EFN reduced ALD-related fibrosis by inhibiting lipid accumulation and apoptosis, enhancing hepatocyte autophagic and antioxidant capacities, and suppressing LPS/TLR4/NF-κB-mediated inflammatory responses by restoring intestinal barrier function.

Keywords: Apoptosis; Autophagy; Ethanol; Gut barrier function; Liver fibrosis; Peroxisome proliferator activated receptor.


Conflict of interest statement

Conflict-of-interest statement: All the authors report no relevant conflicts of interest for this article.

Figures

Figure 1
Figure 1
Elafibranor on steatohepatitis and lipid accumulation in the alcohol-associated liver disease mice. A: In vivo experimental design; B: Changes in the body weights during the experimental period (n = 10); C: Liver/body weight at the end of experiment (n = 10); D: Serum levels of aspartate aminotransferase, alanine aminotransferase and gamma glutamyl transferase (n = 10); E: Serum triglyceride level (n = 10); F: Representative microphotographs of hematoxylin and eosin of the livers in the experimental mice; G: Hepatic pathological scores for steatosis and inflammation. Localized magnified images in the lower left corner of each picture (n = 10); H: Hepatic triglyceride content; I: Hepatic free fatty acid concentration (n = 10); J-L: Hepatic mRNA level of the markers related to lipogenesis (J), lipolysis (K), fatty acid oxidation (L) (n = 10). Glyceraldehyde-3-phosphate dehydrogenase was used as an internal control for real-time quantitative polymerase chain reaction. Quantitative values are indicated as fold changes to the values of non-therapeutic group. Data are the mean ± SD. bP < 0.01 vs non-therapeutic group; cP < 0.05 vs vehicle-treated alcohol-associated liver disease group; dP < 0.01 vs vehicle-treated alcohol-associated liver disease group, significant difference between groups by Student’s t-test. NT: Non-therapeutic group; Veh: Vehicle-treated alcohol-associated liver disease group; EFN-L: Elafiblanor (3 mg/kg/day)-treated alcohol-associated liver disease group; EFN-H: Elafibranor (10 mg/kg/day)-treated alcohol-associated liver disease group; NLD: Normal liquid diet; EtOH: Ethanol; CCL4: Carbon tetrachloride; EFN: Elafiblanor; Lw: Liver weight; Bw: Body weight; AST: Aspartate aminotransferase; ALT: Alanine aminotransferase; GGT: Gamma glutamyl transferase; TG: Triglyceride; H&E: Hematoxylin and eosin; FFA: Free fatty acid; FA: Fatty acid.
Figure 2
Figure 2
Elafibranor on hepatocyte cell death, autophagy and oxidative stress in the alcohol-associated liver disease mice. A: Representative microphotographs of TdT-mediated dUTP Nick End Labeling (TUNEL) and Ki67 staining of the livers in the experimental mice; B: Quantification of TUNEL-positive hepatocytes and Ki67-positive hepatocytes in high-power field (n = 10); C: Cleaved caspase-3 level in the liver tissue (n = 10); D: Western blot for LC3-1 and 2 protein level in the liver tissue. Actin was used as an internal control (n = 3); E: Hepatic mRNA level of the markers related to autophagy (n = 10); F: Hepatic level of antioxidant enzymes, superoxide dismutase 1 and catalase (n = 10). Glyceraldehyde-3-phosphate dehydrogenase was used as an internal control for real-time quantitative polymerase chain reaction (E and F). Quantitative values are indicated as fold changes to the values of non-therapeutic group (C-E). Data are the mean ± SD. bP < 0.01 vs non-therapeutic group; cP < 0.05 vs vehicle-treated alcohol-associated liver disease group; dP < 0.01 vs vehicle-treated alcohol-associated liver disease group, significant difference between groups by Student’s t-test. NT: Non-therapeutic group; Veh: Vehicle-treated alcohol-associated liver disease group; EFN-L: Elafiblanor (3 mg/kg/day)-treated alcohol-associated liver disease group; EFN-H: Elafibranor (10 mg/kg/day)-treated alcohol-associated liver disease group; TUNEL: TdT-mediated dUTP Nick End Labeling; SOD: Superoxide dismutase; CAT: Catalase.
Figure 3
Figure 3
Elafibranor on hepatic fibrosis development in the alcohol-associated liver disease mice. A: Representative microphotographs of sirius-red and α-smooth muscle actin (SMA) staining of the livers in the experimental mice; B: Quantification of sirius-red stained fibrotic area and α-SMA-positive area in high-power field (n = 10); C: Hepatic concentration of hydroxyproline (n = 10); D: Hepatic mRNA level of profibrotic markers (n = 10); E: Hepatic activity of matrix metalloproteinases (MMP)-2, MMP-9, and MMP-13 (n = 10); F: Hepatic level of tissue inhibitor of metalloproteinase 1 (n = 10). Glyceraldehyde-3-phosphate dehydrogenase was used as an internal control for real-time quantitative polymerase chain reaction (D). Quantitative values are indicated as fold changes to the values of non-therapeutic group (B, D and E). Data are the mean ± SD. bP < 0.01 vs non-therapeutic group; cP < 0.05 vs vehicle-treated alcohol-associated liver disease group; dP < 0.01 vs vehicle-treated alcohol-associated liver disease group, significant difference between groups by Student’s t-test. NT: Non-therapeutic group; Veh: Vehicle-treated alcohol-associated liver disease group; EFN-L: Elafiblanor (3 mg/kg/day)-treated alcohol-associated liver disease group; EFN-H: Elafibranor (10 mg/kg/day)-treated alcohol-associated liver disease group; α-SMA: α-smooth muscle actin; MMP: Matrix metalloproteinases; TIMP1: Tissue inhibitor of metalloproteinase 1.
Figure 4
Figure 4
Elafibranor on the ethanol-stimulated human hepatocytes and human hepatic stellate cells. A: Intracellular triglyceride content in HepG2 cells (n = 6); B: Intracellular mRNA level of the markers related to lipid metabolism in HepG2 cells (n = 6); C: Chronological change in HepG2 cell viability by treatment with ethanol (EtOH) and/or elafibtanor (EFN) (n = 6); D: Effect of a selective antagonists of peroxisome proliferator activated receptor (PPAR)α (GW7647) or PPARδ (GSK3787) on EtOH and EFN-treated HepG2 cell viability (incubation for 48 hours) (n = 6); E: Intracellular caspase 3/7 activity in HepG2 cells (n = 6); F: Intracellular mRNA level of the markers related to autophagy in HepG2 cells (n = 6); G: Intracellular levels of superoxide dismutase 1 and catalase in HepG2 cells (n = 6). HepG2 cells were incubated with (A and C) EtOH (0 or 50 mmol/L) and EFN (0, 5, 10, 30 μM) for 24 hours (A) or 0, 12, 24, and 48 hours (C), EtOH (0 or 50 mmol/L) and EFN (0 or 30 μM) for 48 hour following pretreatment with GW7647 (10 μM) or GSK3787 (10 μM) for 6 hours (B, D-G); H: Chronological change in LX-2 cell proliferation by treatment with EtOH and/or EFN (n = 6); I: Intracellular mRNA level of the profibrotic markers in LX-2 cells (n = 6). LX-2 cells were incubated with EtOH (0 or 50 mmol/L) and EFN (0, 5, 10, and 30 μM) for 0, 24, 48 hours (H) or 24 hours (I). Glyceraldehyde-3-phosphate dehydrogenase was used as an internal control for real-time quantitative polymerase chain reaction (B, F and I). Quantitative values are indicated as fold changes to the values of EtOH (-)/EFN (0 μM)-treated group (B-F, H and I). Data are the mean ± SD. bP < 0.01 vs ethanol (-)/elafibtanor (0 μM)-treated group; dP < 0.01 vs ethanol (+)/elafibtanor (0 μM)-treated group; fP < 0.01 vs ethanol (+)/elafibtanor (30 μM)-treated group. EtOH: Ethanol; EFN: Elafibtanor; SOD: Superoxide dismutase; CAT: Catalase; TG: Triglyceride.
Figure 5
Figure 5
Elafibranor on Kupffer cell-mediated inflammatory response in the alcohol-associated liver disease mice. A: Representative microphotographs of F4/80 staining of the livers in the experimental mice; B: Quantification of F4/80-positive cells in high-power field (n = 10); C and D: Hepatic mRNA level of lipopolysaccharide-binding protein (C), toll like receptor 4 and CD14 (D) (n = 10); E: Western blot for the protein expression of IκBα, p-nuclear factor kappa B (NFκB) and NF-κB in the liver tissue. Actin was used as an internal control; F: Quantification of the protein level of IκBα and the ratio of NF-κB phosphorylation based on western blotting (n = 10); G and H: Hepatic mRNA level of tumor necrosis factor-alpha, interleukin 1β (Il1b), and Il6 (G), and Ccl2 (H) (n = 10). Glyceraldehyde-3-phosphate dehydrogenase was used as an internal control for real-time quantitative polymerase chain reaction (C, D, G and H). Quantitative values are indicated as fold changes to the values of non-therapeutic group. Data are the mean ± SD. aP < 0.05 vs non-therapeutic group; bP < 0.01 vs non-therapeutic group; cP < 0.05 vs vehicle-treated alcohol-associated liver disease group; dP < 0.01 vs vehicle-treated alcohol-associated liver disease group, significant difference between groups by Student’s t-test. NT: Non-therapeutic group; Veh: Vehicle-treated alcohol-associated liver disease group; EFN-L: Elafiblanor (3 mg/kg/day)-treated alcohol-associated liver disease group; EFN-H: Elafibranor (10 mg/kg/day)-treated alcohol-associated liver disease group; NF-κB: Nuclear factor kappa B; Lbp: Lipopolysaccharide-binding protein; TLR: Toll like receptor; TNF: Tumor necrosis factor; IL: Interleukin.
Figure 6
Figure 6
Elafibranor on intestinal barrier function in the alcohol-associated liver disease mice. A: Representative microphotographs of ileum sections immunofluorescent stained with tight junction proteins (TJPs) including zonula occludens-1 (ZO-1), occludin and claudin-2; B: Quantitation of ZO-1, occludin and claudin-2 immunopositive area in high-power field (n = 10); C: Intestinal mRNA levels of TJPs (n = 10); D: Blood levels of fluorescein isothiocyanate-dextran (4 kDa) 4 hours after oral administration (n = 3); E: Cleaved caspase-3 level in the ileum tissue (n = 10); F: Western blot for the protein expression of Bcl-2, Mcl-1 and LC3-1 and 2 in the ileum tissue. Actin was used as an internal control; G and H: Intestinal mRNA level of the markers related to autophagy (G) and macrophage activation (H) (n = 10). Glyceraldehyde-3-phosphate dehydrogenase was used as an internal control for real-time quantitative polymerase chain reaction (C, G, and H). Quantitative values are indicated as fold changes to the values of non-therapeutic group (B, C, E-H). Data are the mean ± SD. aP < 0.05 vs non-therapeutic group; bP < 0.01 vs non-therapeutic group; cP < 0.05 vs vehicle-treated alcohol-associated liver disease group; dP < 0.01 vs vehicle-treated alcohol-associated liver disease group, significant difference between groups by Student’s t-test. NT: Non-therapeutic group; Veh: Vehicle-treated alcohol-associated liver disease group; EFN-L: Elafiblanor (3 mg/kg/day)-treated alcohol-associated liver disease group; EFN-H: Elafibranor (10 mg/kg/day)-treated alcohol-associated liver disease group; ZO-1: Zonula occludens-1; TNF: Tumor necrosis factor; IL: Interleukin; FITC: Fluorescein isothiocyanate.
Figure 7
Figure 7
Elafibranor on the ethanol-stimulated human intestinal epithelial cells. A: Intracellular mRNA levels of tight junction proteins (TJPs) including zonula occludens-1 (ZO-1), Ocln, and Cldn2 in ethanol (EtOH)-stimulated Caco-2 cells (n = 6); B: Integrity of the epithelial cellular barrier in EtOH-stimulated Caco-2 cells determined as transepithelial electrical resistance (TEER) (n = 6). Cells were incubated with different concentration of EtOH (0, 10, 25, and 50 mmol/L) for 120 minutes (A) and 0, 30, 60, and 120 minutes (B); C: Effect of elafibranor (EFN) on the TJPs mRNA expression in the EtOH-stimulated Caco-2 cells (n = 6); D: Effect of EFN on the TEER in the EtOH-stimulated Caco-2 cells (n = 6). Cells were incubated with EtOH (0 or 50 mmol/L) and EFN (0, 5, 10, 30 μM) for 120 minutes (C) or 0, 30, 60, and 120 minutes (D) following pretreatment with GW7647 (10 μM) or GSK3787 (10 μM) for 15 minutes; E: Effect of EFN on the intracellular caspase 3/7 activity in the EtOH-stimulated Caco-2 cells (n = 6); F: Effect of EFN on mRNA expression of the markers related to autophagy in the EtOH-stimulated Caco-2 cells (n = 6). Cells were incubated with EtOH (0 or 50 mmol/L) and EFN (0 or 30 μM) for 48 hours following pretreatment with a peroxisome proliferator activated receptor (PPAR)α antagonist, GW7647 (10 μM) or a PPARδ antagonist, GSK3787 (10 μM) for 6 hours (E and F). Glyceraldehyde-3-phosphate dehydrogenase was used as an internal control for real-time quantitative polymerase chain reaction (A, C, and F). Quantitative values are indicated as fold changes to the values of EtOH (-)/EFN (0 μM)-treated group (A, C, E, and F). Data are the mean ± SD. bP < 0.01 vs ethanol (-)/elafibranor (0 μM)-treated group; cP < 0.05 vs ethanol (+)/elafibranor (0 μM)-treated group; dP < 0.01 vs ethanol (+)/elafibranor (0 μM)-treated group; eP < 0.05 vs ethanol (+)/elafibranor (30 μM)-treated group; fP < 0.01 vs ethanol (+)/elafibranor (30 μM)-treated group. EtOH: Ethanol; EFN: Elafibtanor; TEER: Transepithelial electrical resistance; ZO-1: Zonula occludens-1.

Similar articles

Cited by

References

    1. Julien J, Ayer T, Bethea ED, Tapper EB, Chhatwal J. Projected prevalence and mortality associated with alcohol-related liver disease in the USA, 2019-40: a modelling study. Lancet Public Health. 2020;5:e316–e323. - PubMed
    1. Asrani SK, Mellinger J, Arab JP, Shah VH. Reducing the Global Burden of Alcohol-Associated Liver Disease: A Blueprint for Action. Hepatology. 2021;73:2039–2050. - PMC - PubMed
    1. Devarbhavi H, Asrani SK, Arab JP, Nartey YA, Pose E, Kamath PS. Global burden of liver disease: 2023 update. J Hepatol. 2023;79:516–537. - PubMed
    1. Mackowiak B, Fu Y, Maccioni L, Gao B. Alcohol-associated liver disease. J Clin Invest. 2024;134 - PMC - PubMed
    1. Gao B, Bataller R. Alcoholic liver disease: pathogenesis and new therapeutic targets. Gastroenterology. 2011;141:1572–1585. - PMC - PubMed

MeSH terms