[Preprint]. 2024 Jul 23:2024.07.21.604518.
doi: 10.1101/2024.07.21.604518.

Manipulating the EphB4-ephrinB2 axis to reduce metastasis in HNSCC

Affiliations

Manipulating the EphB4-ephrinB2 axis to reduce metastasis in HNSCC

Khalid N M Abdelazeem et al. bioRxiv. .

Update in

  • Manipulating the EphB4-ephrinB2 axis to reduce metastasis in HNSCC.
    Abdelazeem KNM, Nguyen D, Corbo S, Darragh LB, Matsumoto MW, Van Court B, Neupert B, Yu J, Olimpo NA, Osborne DG, Gadwa J, Ross RB, Nguyen A, Bhatia S, Kapoor M, Friedman RS, Jacobelli J, Saviola AJ, Knitz MW, Pasquale EB, Karam SD. Abdelazeem KNM, et al. Oncogene. 2025 Feb;44(3):130-146. doi: 10.1038/s41388-024-03208-9. Epub 2024 Nov 3. Oncogene. 2025. PMID: 39489818 Free PMC article.

Abstract

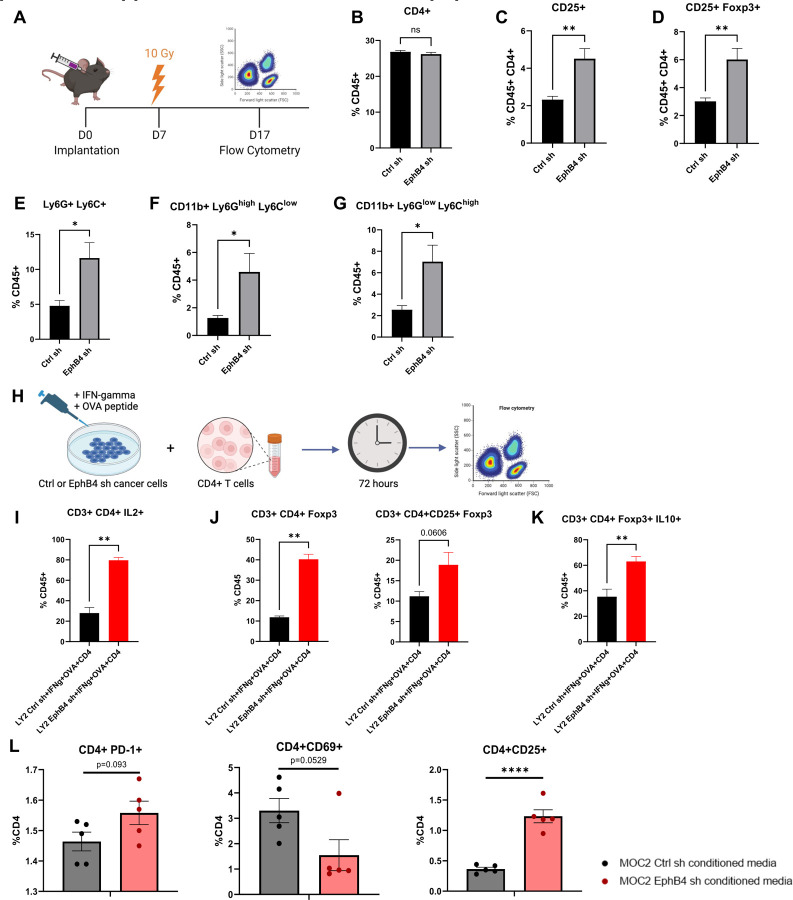
The EphB4-ephrinB2 signaling axis has been heavily implicated in metastasis across numerous cancer types. Our emerging understanding of the dichotomous roles that EphB4 and ephrinB2 play in head and neck squamous cell carcinoma (HNSCC) poses a significant challenge to rational drug design. We find that EphB4 knockdown in cancer cells enhances metastasis in preclinical HNSCC models by augmenting immunosuppressive cells like T regulatory cells (Tregs) within the tumor microenvironment. EphB4 inhibition in cancer cells also amplifies their ability to metastasize through increased expression of genes associated with epithelial mesenchymal transition and hallmark pathways of metastasis. In contrast, vascular ephrinB2 knockout coupled with radiation therapy (RT) enhances anti-tumor immunity, reduces Treg accumulation into the tumor, and decreases metastasis. Notably, targeting the EphB4-ephrinB2 signaling axis with the engineered EphB4 ligands EFNB2-Fc-His and Fc-TNYL-RAW-GS reduces local tumor growth and distant metastasis in a preclinical model of HNSCC. Our data suggest that targeted inhibition of vascular ephrinB2 while avoiding inhibition of EphB4 in cancer cells could be a promising strategy to mitigate HNSCC metastasis.


Conflict of interest statement

Dr. Karam receives clinical funding from Genentech that does not relate to this work. She receives clinical trial funding from AstraZeneca, a part of which is included in this manuscript. She also receives preclinical research funding from Roche and Amgen, neither one of which is related to this manuscript. The remaining authors declare no competing interests.

Figures

Figure 1:
Figure 1:. Knockdown of EphB4 in HNSCC cancer cells promotes distant metastasis.
(A) Schematic showing experimental design for C57BL/6J mice implanted with 100k MOC2 cancer cells. 3 fractions of 8 Gray (Gy) radiation therapy (RT) were given as indicated. (B) Kaplan-Meier curves showing lung metastasis free survival of MOC2 control (Ctrl) shRNA (sh) versus EphB4 shRNA tumors implanted in C57BL/6J mice. Numbers at risk indicate mice that were alive without metastases at specified timepoints. (C) Contingency table quantifying the incidence of lung metastasis detected by computed tomography (CT) scans in C57BL/6 mice implanted with MOC2 cancer cells by 36 days post-implantation (DPI). (D) Schematic showing experimental design for BALB/c mice implanted with 100k LY2 cancer cells. 3 fractions of 8 Gy RT were given as indicated. (E) Kaplan-Meier curves showing distant metastasis free survival of LY2 Ctrl shRNA vs LY2 EphB4 shRNA tumors implanted in BALB/c mice. Numbers at risk indicate mice that were alive without metastases at specified timepoints. (F) Contingency table quantifying the incidence of distant metastases detected by CT scans in BALB/c mice implanted with LY2 Ctrl shRNA or EphB4 shRNA tumors by 37 DPI. For Kaplan-Meier survival curves, significance was determined by a log-rank Mantel-Cox test. For contingency tables indicating the incidence of metastases, significance was determined by a Chi-square test. Significance was determined if the p-value was <0.05*, <0.01**, <0.001***, and <0.0001****. p-values are indicated for the figures B ***p = 0.0009, C **p = 0.0044, E *p = 0.0200, F **p = 0.0073.
Figure 2:
Figure 2:. Loss of EphB4 in cancer cells induces protein dysregulation concomitant with increased metastatic capacity.
(A) Expression of genes quantified using RNA-sequencing of MOC2 control, EphB4, and ephrinB2 (EFNB2) CRISPR knockout (KO) cell lines. (B) Hallmark pathways generated from RNA-sequencing of MOC2 control versus EphB4 shRNA cell lines. (C) Representative images and quantification for Boyden chamber invasion assay conducted on MOC2 control or EphB4 KO cell lines. (C) Variable importance in projection (VIP) score plots of mass spectrometry proteomics data conducted on MOC2 EphB4 KO vs Ctrl tumors displaying upregulation of BCCIP and Ube2v1 proteins in EphB4 KO tumors compared to control tumors. (E) GO and Reactome pathway enrichment analysis of EphB4 KO vs Ctrl MOC2 cancer cells. (F) Expression of genes associated with intermediate filament cytoskeleton quantified using RNA-sequencing of MOC2 control, EphB4, and ephrinB2 CRISPR knockout cell lines. For Boyden chamber quantification, comparison of invaded cells between the control and experimental group was done using a two-sided student’s t-test. Significance was determined if the p-value was <0.05*, <0.01**, <0.001***, and <0.0001****. p-values are indicated for the figures C ***p = 0.0002.
Figure 3:
Figure 3:. Knockdown of EphB4 in cancer cells combined with radiation treatment promotes suppressive intratumoral immune populations.
(A) Experimental design for C57BL/6J mice implanted with MOC2 cancer cells. The buccal tumor received single dose of radiation treatment (10Gy) on day 7 after implantation. (B-G) Flow cytometric quantification of CD4+ T cells (B), regulatory T cells (Tregs) defined by CD4+ CD25+ (C) and CD4+ CD25+ Foxp3+ expression (D), myeloid-derived suppressor cells (MDSCs) defined by CD45+ Ly6G+ Ly6C+ (E), CD45+ Ly6G+ CD11b+ (F), and CD45+ Ly6C+ CD11b+ (G) in the tumor microenvironment (TME). H) Experimental design for coculture of LY2 Ctrl or EphB4 shRNA cancer cells with CD4+ T cells. Cancer cells were incubated with interferon-gamma (IFNg) for 48 hours, then OVA peptide overnight. CD4+ T cells from DO11.10 BALB/c mice were then cocultured with the cancer cells for 72 hours and subsequently harvested for flow cytometry. (I) Flow cytometry analysis displaying the quantification of IL2+ expressing CD4+ T cells. (J) Flow cytometry quantification of Tregs defined by CD4+ Foxp3+ and CD4+ CD25+ Foxp3+ expression. (K) Flow cytometry quantification of Treg immunosuppressive function defined by IL-10 expression. (L) Flow cytometry quantification of CD4+ T cells treated with conditioned media from MOC2 control or EphB4 shRNA cells showing PD-1, CD69, and CD25 expression. Comparison between control and experimental groups was done using a two-sided student’s t-test. Significance was determined if the p-value was <0.05*, <0.01**, <0.001***, and <0.0001****. p-values are indicated for the figures C ns p = 0.3636, D CD25+ **p = 0.0025; CD25+Foxp3+ **p = 0.0051, E *p = 0.0177, F *p = 0.0101, G *p = 0.0102, I **p = 0.0022, J **p = 0.0020, K **p = 0.0087, L ****p < 0.0001.
Figure 4:
Figure 4:. Knockout of ephrinB2 in the vasculature significantly reduces distant metastases.
(A) Breeding strategy for creating mice with ephrinB2 (EFNB2) KO on vascular endothelial cells. (B) Average tumor volume curve and dot plot showing significantly smaller average tumor volume at 34 DPI in ephrinB2fl/flTie2Cre mice implanted with MOC2 WT tumors compared to WT hosts. (C) Kaplan-Meier curves showing lung metastasis free survival of WT hosts and ephrinB2 KO mice. Numbers at risk indicate mice that were alive without metastases at specified timepoints. (D) Contingency table showing incidence of lung metastases detected by CT scans in ephrinB2 KO mice versus WT hosts by 36 DPI. Comparison of tumor volume between the control and experimental group was done using a two-sided student’s t-test. For Kaplan-Meier survival curves, significance was determined by a log-rank Mantel-Cox test. For contingency tables indicating the incidence of metastases, significance was determined by a Chi-square test. Significance was determined if the p-value was <0.05*, <0.01**, <0.001***, and <0.0001****. p-values are indicated for the figures B ****p < 0.0001, C *p = 0.0172.
Figure 5:
Figure 5:. Knockout of ephrinB2 in vascular endothelial cells enhances anti-tumor immune cell populations in the TME.
(A) UMAP plots showing expression of ephrinB2, SELP, and SELE in endothelial cells from human HNSCC single-cell sequencing. (B) Volcano plot showing differential gene expression of endothelial cells that do (red) or do not (blue) express ephrinB2 from human HNSCC single-cell sequencing. (C) Experimental design for flow cytometric analysis of MOC2 WT tumors implanted in ephrinB2 KO mice and littermate controls. (D-J) Flow cytometry analysis displaying quantification of PD-1 expressing CD8+ T cells (D), PD-1- Granzyme B+ expressing CD8+ T cells (E), Tregs in the TME defined by Foxp3 expression (F), immunosuppressive Tregs defined by the addition of CTLA-4 expression (G), proliferating CD4+ T cells defined by Ki-67 expression in the draining lymph nodes (DLNs) (H), proliferating CD8+ T cells defined by Ki-67 expression in the DLNs (I), and IL-2 expressing CD4+ T cells in the DLNs (J). Comparison of differences between the control and experimental group was done using a two-sided student’s t-test. Significance was determined if the p-value was <0.05*, <0.01**, <0.001***, and <0.0001****. p-values are indicated for the figures D *p = 0.0466, F *p = 0.0358, H *p = 0.0247, J *p = 0.0177.
Figure 6:
Figure 6:. EFNB2-Fc-His and Fc-TNYL-RAW-GS reduce local tumor growth and distant metastasis in C57BL/6 mice implanted with MOC2 cells.
(A) Experimental design for C57BL/6J mice implanted with MOC2 WT cancer cells. Hydrodynamic tail vein injections (HTVI) and radiation therapy (8 Gy) were administered as indicated. Mice treated with RT alone or Sleeping Beauty (SB) + RT served as controls. (B) Average tumor volume curve comparing effects of different plasmids on local tumor growth. (C) Dot plot showing the effects of different plasmids on tumor volume 30 DPI. (D-E) Kaplan-Meier curves showing therapeutic effects of different plasmids on overall survival (D) and lung metastasis free survival (E) in MOC2 WT implanted C57BL/6 mice. For Kaplan-Meier curves showing lung metastasis free survival, numbers at risk indicate mice that were alive without metastases at specified timepoints. (F) Contingency table quantifying the incidence of lung metastasis detected by CT scans in MOC2 WT implanted mice by 35 DPI. Comparison of tumor volume between the control and experimental groups was done using a Dunnett post hoc test after one-way ANOVA was performed. For Kaplan-Meier survival curves, significance was determined by a log-rank Mantel-Cox test. For contingency tables indicating the incidence of metastases, significance was determined by a Chi-square test. Significance was determined if the p-value was <0.05*, <0.01**, <0.001***, and <0.0001****. p-values are indicated for the figures C RT vs EFNB2-Fc-His ***p = 0.0003; RT vs Fc-TNYL-RAW-GS ***p = 0.0002; RT vs SB+RT ns p = 0.3757, D *p = 0.0485, E RT vs EFNB2-Fc-His **p = 0.0075; RT vs Fc-TNYL-RAW-GS *p = 0.0488, F **p = 0.0098.
Figure 7:
Figure 7:. EphrinB2-Fc-His activates EphB4 without concurrent activation of EFNB2 while Fc-TNYL-RAW-GS activates both EphB4 and EFNB2.
(A) Experimental design for C57BL/6J mice implanted with MOC2 WT cancer cells. Hydrodynamic tail vein injections (HTVI) and radiation therapy (8 Gy) were administered as indicated. Mice treated with RT alone served as controls. (B) Average tumor volume curve comparing effects of different plasmids on local tumor growth. (C) Dot plot showing the effects of different plasmids on tumor volume 28 DPI. (D) Kaplan-Meier curves showing therapeutic effects of different plasmids on overall survival in MOC2 WT implanted C57BL/6 mice. (E) Western blots showing protein expression of EphB4, phospho-EphB4 (pEphB4), EFNB2, phospho-EFNB2 (pEFNB2), and beta-actin in control and experimental tumors. (F) Dot plots showing ratios of protein expression of pEphB4/EphB4 and pEFNB2/EFNB2 in control and experimental tumors. Protein bands were quantified using Image lab and ImageJ software. Comparison of tumor volume and relative protein expression between the control and experimental groups was done using Mann-Whitney tests. Significance was determined if the p-value was <0.05*, <0.01**, <0.001***, and <0.0001****. p-values are indicated for the figures C RT vs EphrinB2-Fc ***p = 0.0002; RT vs EFNB2-Fc-His ****p < 0.0001; RT vs Fc-TNYL-RAW-GS **p = 0.0044, D *p = 0.0389.

References

    1. Alam S. M., Fujimoto J., Jahan I., Sato E., & Tamaya T. (2008). Coexpression of EphB4 and ephrinB2 in tumour advancement of ovarian cancers. Br J Cancer, 98(4), 845–851. 10.1038/sj.bjc.6604216 - DOI - PMC - PubMed
    1. Anderson K. G., Mayer-Barber K., Sung H., Beura L., James B. R., Taylor J. J., Ǫunaj L., GriZith T. S., Vezys V., Barber D. L., & Masopust D. (2014). Intravascular staining for discrimination of vascular and tissue leukocytes. Nat Protoc, 9(1), 209–222. 10.1038/nprot.2014.005 - DOI - PMC - PubMed
    1. Aronovich E. L., Bell J. B., Belur L. R., Gunther R., Koniar B., Erickson D. C. C., Schachern P. A., Matise I., McIvor R. S., Whitley C. B., & Hackett P. B. (2007). Prolonged expression of a lysosomal enzyme in mouse liver after Sleeping Beauty transposon-mediated gene delivery: implications for non-viral gene therapy of mucopolysaccharidoses. The Journal of Gene Medicine, 9(5), 403–415. 10.1002/jgm.1028 - DOI - PMC - PubMed
    1. Barquilla A., Lamberto I., Noberini R., Heynen-Genel S., Brill L. M., & Pasquale E. B. (2016). Protein kinase A can block EphA2 receptor–mediated cell repulsion by increasing EphA2 S897 phosphorylation. Molecular Biology of the Cell, 27(17), 2757–2770. 10.1091/mbc.e16-01-0048 - DOI - PMC - PubMed
    1. Bhatia S., Hirsch K., Sharma J., Oweida A., Griego A., Keysar S., Jimeno A., Raben D., Krasnoperov V., & Gill P. S. (2016). Enhancing radiosensitization in EphB4 receptor-expressing head and neck squamous cell carcinomas. Scientific Reports, 6(1), 1–13. - PMC - PubMed

Publication types