[Preprint]. 2024 Jul 23:2024.07.22.604655.
doi: 10.1101/2024.07.22.604655.

Computationally designed mRNA-launched protein nanoparticle vaccines

Affiliations

Computationally designed mRNA-launched protein nanoparticle vaccines

Grace G Hendricks et al. bioRxiv. .

Abstract

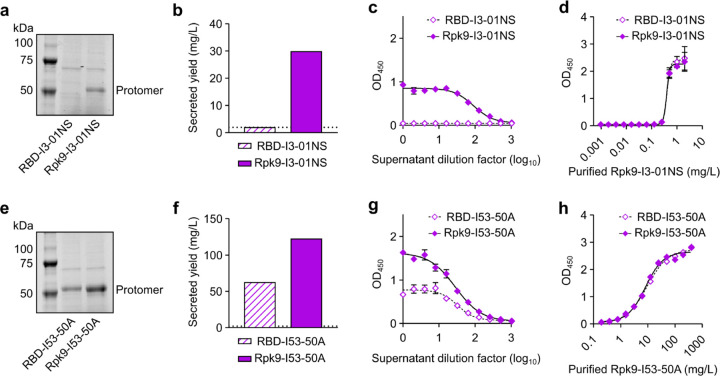
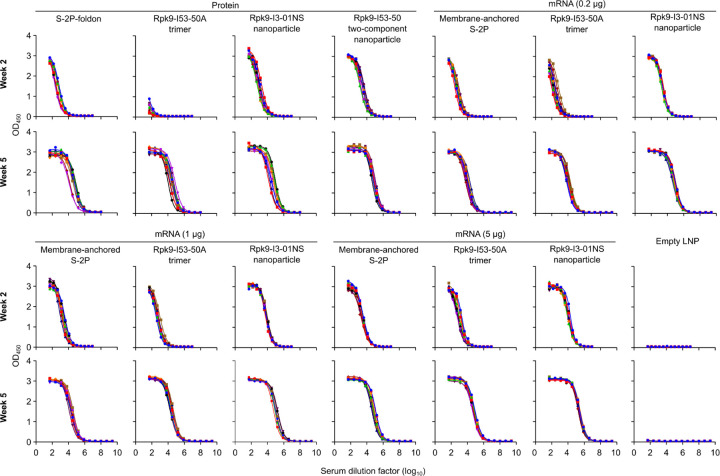
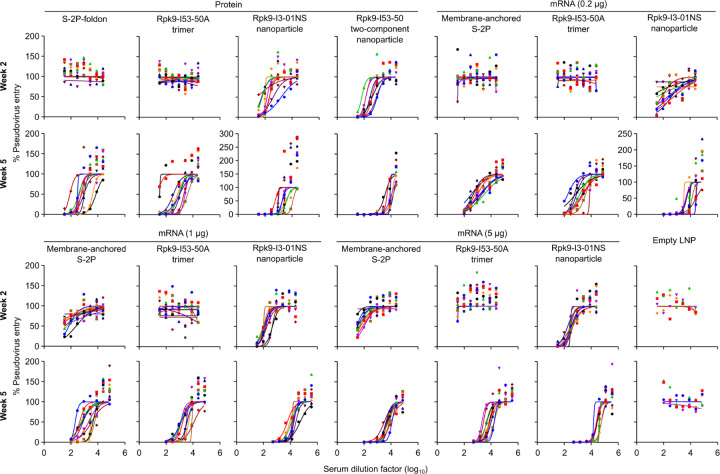
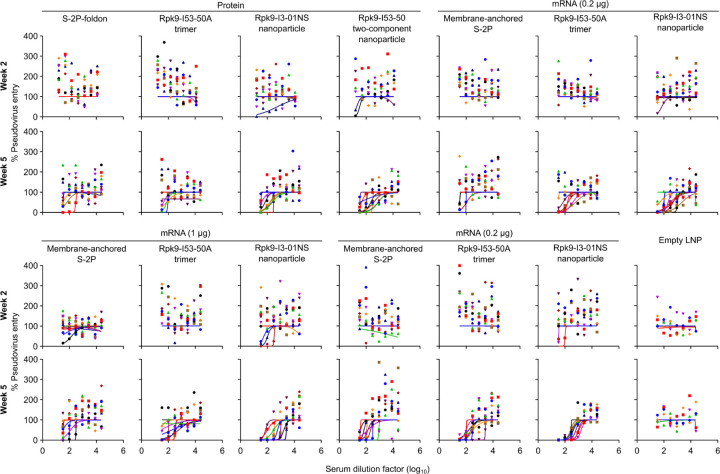
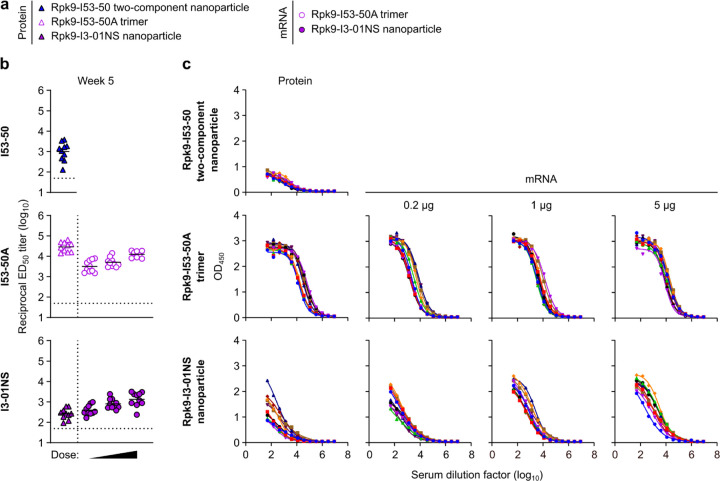
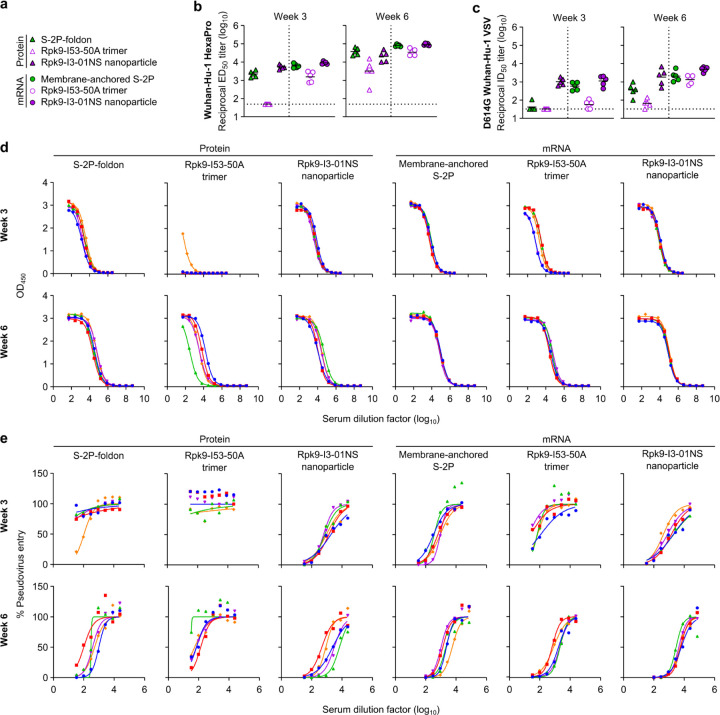
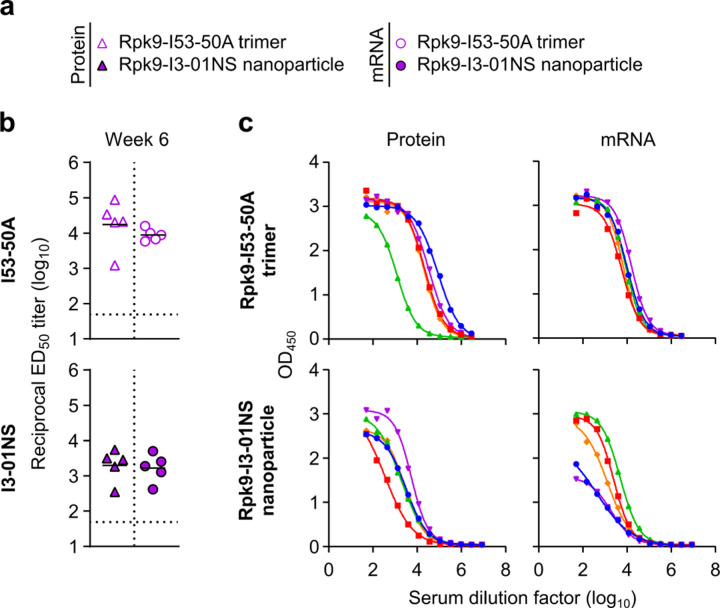
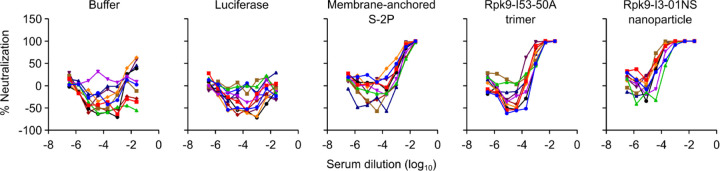
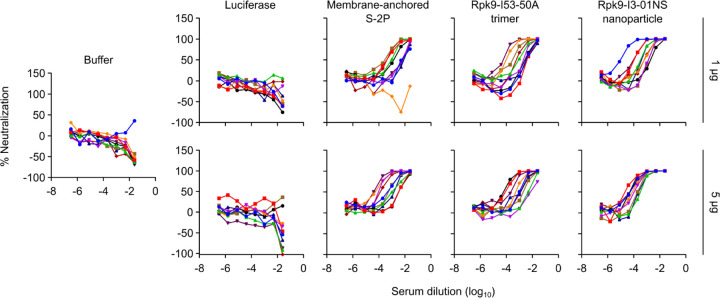
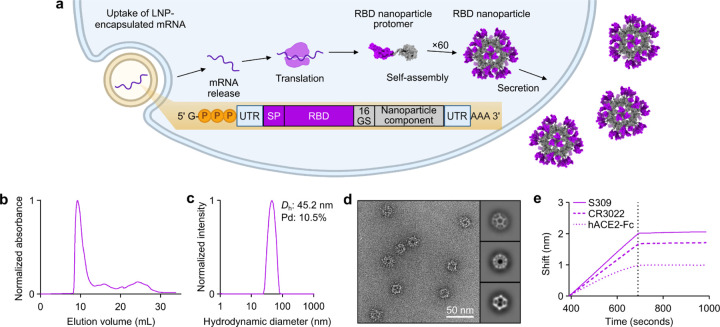
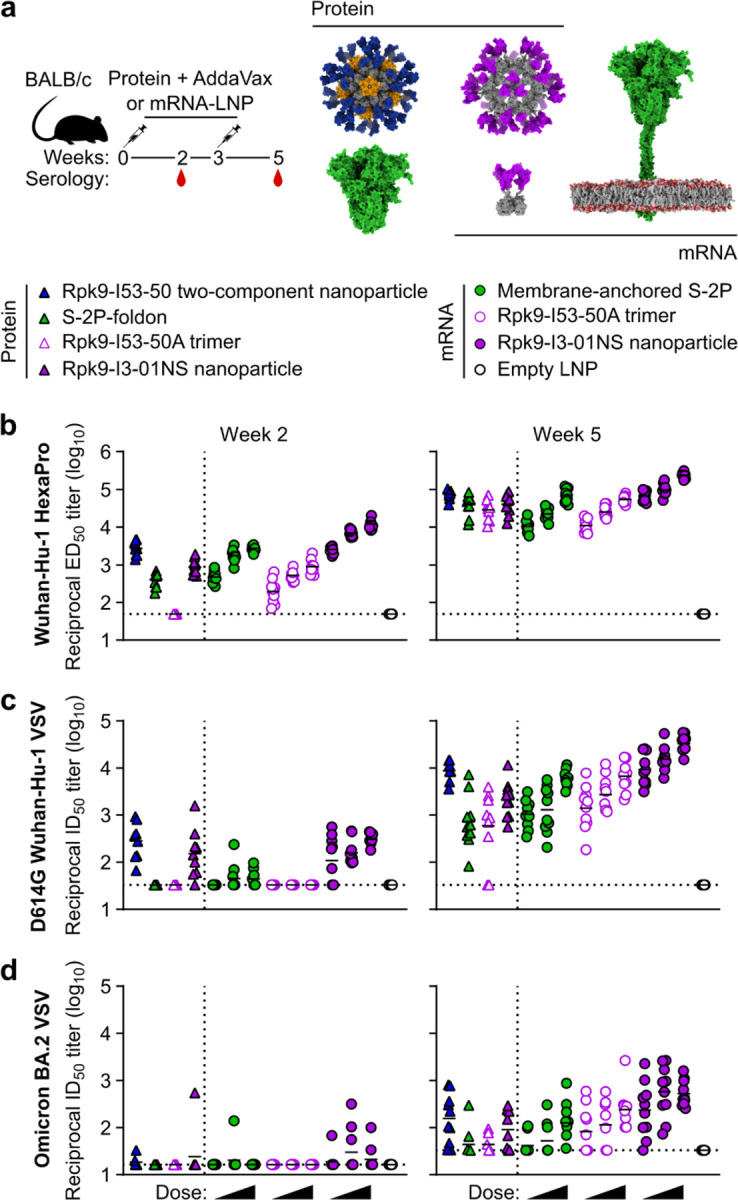
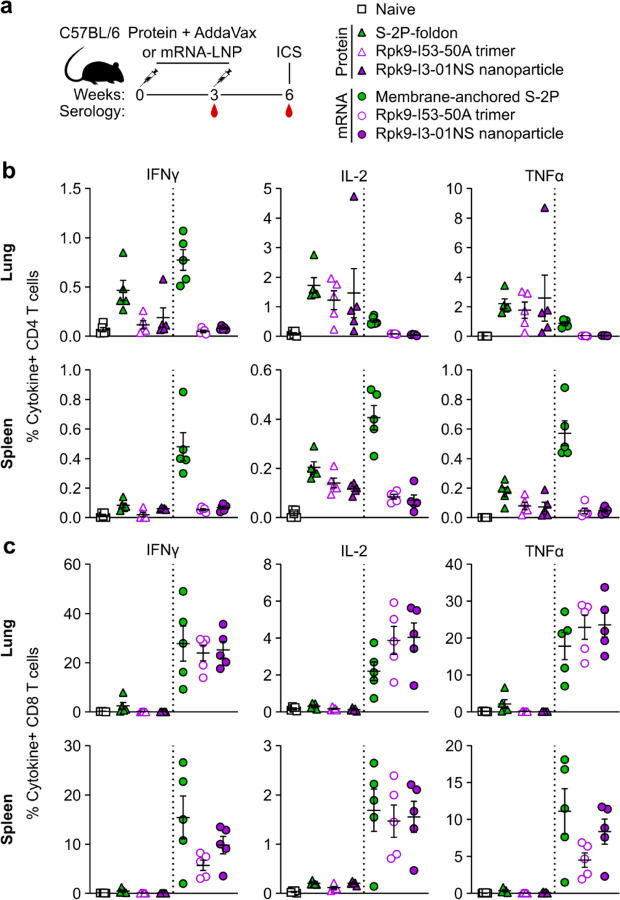
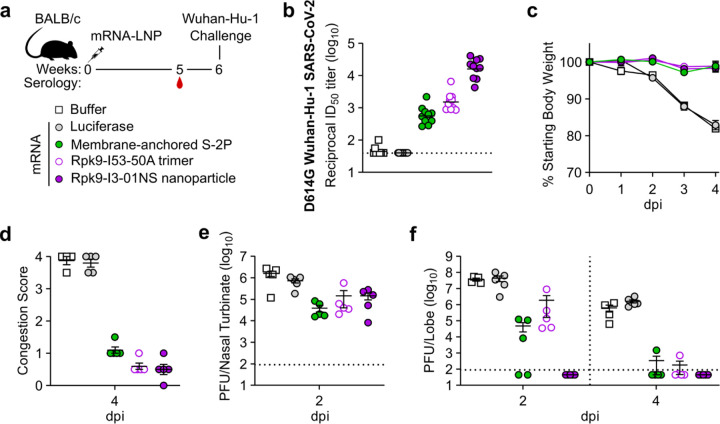
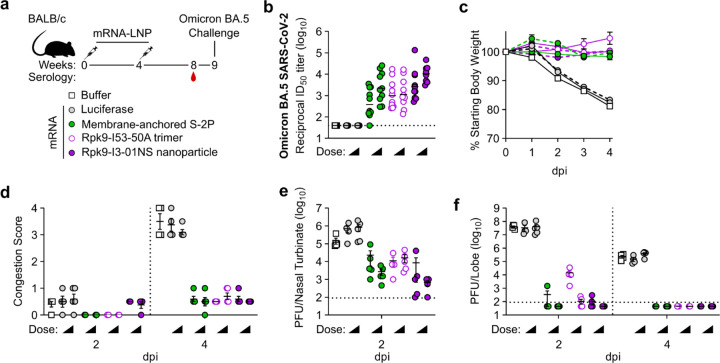
Both protein nanoparticle and mRNA vaccines were clinically de-risked during the COVID-19 pandemic1-6. These vaccine modalities have complementary strengths: antigen display on protein nanoparticles can enhance the magnitude, quality, and durability of antibody responses7-10, while mRNA vaccines can be rapidly manufactured11 and elicit antigen-specific CD4 and CD8 T cells12,13. Here we leverage a computationally designed icosahedral protein nanoparticle that was redesigned for optimal secretion from eukaryotic cells14 to develop an mRNA-launched nanoparticle vaccine for SARS-CoV-2. The nanoparticle, which displays 60 copies of a stabilized variant of the Wuhan-Hu-1 Spike receptor binding domain (RBD)15, formed monodisperse, antigenically intact assemblies upon secretion from transfected cells. An mRNA vaccine encoding the secreted RBD nanoparticle elicited 5- to 28-fold higher levels of neutralizing antibodies than an mRNA vaccine encoding membrane-anchored Spike, induced higher levels of CD8 T cells than the same immunogen when delivered as an adjuvanted protein nanoparticle, and protected mice from vaccine-matched and -mismatched SARS-CoV-2 challenge. Our data establish that delivering protein nanoparticle immunogens via mRNA vaccines can combine the benefits of each modality and, more broadly, highlight the utility of computational protein design in genetic immunization strategies.


Conflict of interest statement

Declaration of Interests G.G.H., A.C.W., D.E., J.Y.J.W., M.C.M., D.V., and N.P.K. are named on patents describing designed antigens and nanoparticle immunogens for SARS-CoV-2 and other coronaviruses. The King lab has received unrelated sponsored research agreements from Pfizer and GlaxoSmithKline. N.P. is named on patents describing the use of nucleoside-modified mRNA in lipid nanoparticles as a vaccine platform. N.P. has disclosed those interests fully to the University of Pennsylvania, and he has in place an approved plan for managing any potential conflicts arising from licensing of those patents. N.P. served on the mRNA strategic advisory board of Sanofi Pasteur in 2022 and Pfizer in 2023–2024. N.P. is a member of the Scientific Advisory Board of AldexChem and BioNet, and has consulted for Vaccine Company Inc and Pasture Bio. P.J.C.L., M.M.H.S., and Y.K.T. are employees of Acuitas Therapeutics, a company developing LNP for delivery of mRNA-based therapeutics. Y.K.T. is named on patents describing the use of nucleoside-modified mRNA in lipid nanoparticles as a vaccine platform. The other authors declare no competing interests.

Figures

Extended Data Fig. 1.
Extended Data Fig. 1.. Quantification of secreted RBD nanoparticles and RBD trimers.
a, Reducing SDS-PAGE of supernatants from Expi293F cells after expression of RBD nanoparticles. b, Secreted yield of RBD nanoparticles, as determined by cell supernatant ELISAs. c, RBD nanoparticle supernatant binding against CV30. d, Purified Rpk9-I3-01NS binding against CV30 was used to quantify the secreted yield of both supernatants. The standard curves generated for analysis are shown for each supernatant. e, Reducing SDS-PAGE of supernatants from Expi293F cells after expression of RBD trimers. f, Secreted yield of RBD trimers, as determined by supernatant ELISAs. g, RBD trimer supernatant binding against CV30. h, Purified Rpk9-I53-50A binding against CV30 was used to quantify the secreted yield of both supernatants. The standard curves generated for analysis are shown for each supernatant. Note the very different x axis scales in panels d and h, highlighting that nanoparticles and trimers require distinct standard curves for accurate quantitation. a-h, Representative data are shown from one of three biological replicates for each construct. b, f The dotted horizontal line represents the limit of detection for the assay. c-d, g-h Error bars represent mean ± SD of two technical replicates.
Extended Data Fig. 2.
Extended Data Fig. 2.. Raw ELISA data and fits used to determine titers shown in Figure 2.
Serum binding against Wuhan-Hu-1 SARS-CoV-2 S HexaPro. Each color represents an individual animal.
Extended Data Fig. 3.
Extended Data Fig. 3.. Dose-response curves of D614G Wuhan-Hu-1 SARS-CoV-2 pseudovirus neutralization, related to Figure 2.
Serum neutralizing activity against VSV pseudotyped with D614G Wuhan-Hu-1 SARS-CoV-2 S. Each color represents an individual animal. Some groups do not have data for all 10 mice due to a lack of available sera (for week 2: n=9 for S-2P-foldon, n=8 for Rpk9-I53-50, n=9 for Rpk9-I3-01NS (protein), and n=4 for Empty LNP). The y axis range and scale of each plot correspond to the leftmost graph in the row unless otherwise indicated.
Extended Data Fig. 4.
Extended Data Fig. 4.. Dose-response curves of Omicron BA.2 SARS-CoV-2 pseudovirus neutralization, related to Figure 2.
Serum neutralizing activity against VSV pseudotyped with Omicron BA.2 SARS-CoV-2 S. Each color represents an individual animal. Some groups do not have data for all 10 mice due to a lack of available sera (for week 2: n=9 for S-2P-foldon, n=8 for Rpk9-I53-50, n=9 for Rpk9-I3-01NS (protein)).
Extended Data Fig. 5.
Extended Data Fig. 5.. Anti-scaffold antibody titers in BALB/c mice two weeks post-boost.
a, Groups assessed for anti-scaffold responses at week 5 (from mice in Fig. 2). b, Serum antibody binding titers against the I53-50, I53-50A, and I3-01NS scaffolds. Each symbol represents an individual animal and the GMT from each group is indicated by a horizontal line. The dotted horizontal line represents the limit of detection for the assay. The dotted vertical line separates the protein and mRNA immunized groups. Statistical analyses have been omitted for clarity but can be found in Supplementary Information. c, Raw ELISA data and fits used to determine titers in (b). Each colored curve represents an individual animal.
Extended Data Fig. 6.
Extended Data Fig. 6.. T cell gating strategy, related to Figure 3.
Representative gating strategy for evaluating antigen-specific CD4 and CD8 T cells.
Extended Data Fig. 7.
Extended Data Fig. 7.. Antigen-specific and neutralizing antibody titers in C57BL/6 mice.
a, Groups assessed for antigen-specific and neutralizing antibody responses (from mice in Fig. 3). b, Serum antibody binding titers against Wuhan-Hu-1 SARS-CoV-2 S HexaPro, measured by ELISA. c, Serum neutralizing antibody titers against VSV pseudotyped with D614G Wuhan-Hu-1 SARS-CoV-2 S. d, Raw ELISA data and fits used to determine titers in (b). e, Raw D614G Wuhan-Hu-1 SARS-CoV-2 pseudovirus entry data and fits used to determine titers in (c). b-c, The GMT from each group is indicated by a horizontal line. The dotted horizontal line represents the lowest limit of detection among the plotted data, as the limits of detection vary between groups. Statistical analyses have been omitted for clarity but can be found in Supplementary Information. d-e, Each color represents an individual animal.
Extended Data Fig. 8.
Extended Data Fig. 8.. Anti-scaffold antibody titers in C57BL/6 mice three weeks post-boost.
a, Groups assessed for anti-scaffold responses at week 6 (from mice in Fig. 3). b, Serum antibody binding titers against the I53-50A and I3-01NS scaffolds. Each symbol represents an individual animal and the GMT from each group is indicated by a horizontal line. The dotted horizontal line represents the limit of detection for the assay. Statistical analyses have been omitted for clarity but can be found in Supplementary Information. c, Raw ELISA data and fits used to determine titers in (b). Each color represents an individual animal.
Extended Data Fig. 9.
Extended Data Fig. 9.. Raw data curves of D614G Wuhan-Hu-1 SARS-CoV-2 authentic virus neutralization data, related to Figure 4.
Serum neutralizing activity against D614G Wuhan-Hu-1 SARS-CoV-2 authentic virus. Each color represents an individual animal. The mean of two technical replicates are shown.
Extended Data Fig. 10.
Extended Data Fig. 10.. Raw data curves of Omicron BA.5 SARS-CoV-2 authentic virus neutralization data, related to Figure 5.
Serum neutralizing activity against Omicron BA.5 authentic virus. Each color represents an individual animal. The mean of two technical replicates are shown.
Fig. 1.
Fig. 1.. Design and characterization of a secretable SARS-CoV-2 RBD nanoparticle.
a, Schematic of the biogenesis of secreted RBD nanoparticles using LNP-encapsulated mRNA as an example for method of delivery. The secretory pathway has been omitted for simplicity. UTR, untranslated region; SP, signal peptide; 16 GS, 16-residue glycine/serine linker. The protein models and schematic were rendered using ChimeraX and BioRender.com, respectively. b, Size exclusion chromatogram of Rpk9-I3-01NS purification. c, Dynamic light scattering of SEC-purified Rpk9-I3-01NS. Dh, hydrodynamic diameter; Pd, polydispersity. d, Representative electron micrograph of negatively stained SEC-purified Rpk9-I3-01NS and 2D class averages. e, Binding of immobilized hACE2-Fc, CR3022, and S309 to SEC-purified Rpk9-I3-01NS as assessed by biolayer interferometry. The dotted vertical line separates the association and dissociation steps.
Fig. 2.
Fig. 2.. mRNA-launched RBD nanoparticles elicit potent neutralizing antibody titers in BALB/c mice.
a, Study design and groups; n=10 mice/group received either AddaVax-adjuvanted protein (equimolar amounts of RBD: 0.9 μg of RBD per dose for Rpk9-based constructs, 5 μg of Spike per dose for S-2P-foldon) or nucleoside-modified, LNP-encapsulated mRNA (0.2, 1, or 5 µg per dose). Molecular models of immunogens are not to scale. Rpk9 shown in blue (Rpk9-I53-50) or purple (Rpk9-I53-50A and Rpk9-I3-01NS). Trimer scaffold shown in gray (Rpk9-I53-50, Rpk9-I53-50A, and Rpk9-I3-01NS). Pentamer component shown in orange (Rpk9-I53-50). S-2P-foldon and membrane-anchored S-2P, shown in green, are adapted from ref. 51. Glycans have been omitted from all models for simplicity. All models were rendered using ChimeraX. b, Serum antibody binding titers against Wuhan-Hu-1 SARS-CoV-2 S HexaPro, measured by ELISA. c, Serum neutralizing antibody titers against VSV pseudotyped with D614G Wuhan-Hu-1 SARS-CoV-2 S. d, Serum neutralizing antibody titers against VSV pseudotyped with Omicron BA.2 SARS-CoV-2 S. b-d, Each symbol represents an individual animal and the geometric mean titer (GMT) from each group is indicated by a horizontal line. The dotted horizontal line represents the lowest limit of detection for the assay; limits of detection vary between groups. The dotted vertical line separates the protein and mRNA immunized groups. Statistical analyses have been omitted for clarity but can be found in Supplementary Information.
Fig. 3.
Fig. 3.. mRNA vaccines induce robust antigen-specific CD8 T cell responses in C57BL/6 mice.
a, Study design and groups (ICS, intracellular cytokine staining); n=10 mice/group received either AddaVax-adjuvanted protein (equimolar amounts of RBD: 0.9 μg of RBD per dose for Rpk9-based constructs, 5 μg of Spike per dose for S-2P-foldon) or nucleoside-modified, LNP-encapsulated mRNA (1 µg per dose). b, Percentage of CD4 T cells producing IFNγ, IL-2, and TNFα in response to a Wuhan-Hu-1 SARS-CoV-2 S peptide pool of overlapping 15-mers. c, Percentage of CD8 T cells producing IFNγ, IL-2, and TNFα in response to a Wuhan-Hu-1 SARS-CoV-2 S peptide pool of overlapping 15-mers. b-c, Each symbol represents an individual animal. Error bars represent mean ± SEM. The dotted vertical line separates the protein and mRNA immunized groups. Statistical analyses have been omitted for clarity but can be found in Supplementary Information.
Fig. 4.
Fig. 4.. mRNA vaccines confer protective immunity against mouse-adapted SARS-CoV-2.
a, Study design and groups; n=4–6 mice/group/time point (2 and 4 days post infection (dpi)) received either nucleoside-modified, LNP-encapsulated mRNA (1 µg dose) or an equivalent volume of phosphate-buffered saline (PBS). b, Serum neutralizing antibody titers against D614G Wuhan-Hu-1 SARS-CoV-2 authentic virus. Each symbol represents an individual animal and the GMT from each group is indicated by a horizontal line. The dotted horizontal line represents the lowest limit of detection for the assay. c, Weight loss up to 4 days dpi. Each symbol is the mean of the group for the time point ± SEM. d, Congestion score at 4 dpi (scored as: 0 = no discoloration, 4 = severe discoloration). e, Infectious viral load at 2 dpi in the nasal cavity after challenge of vaccinated mice as determined by plaque assay. f, Infectious viral load at 2 and 4 dpi in the lung after challenge of vaccinated mice as determined by plaque assay. The dotted vertical line separates time points. The dotted horizontal line indicates the limit of detection; for samples with values below this, data are plotted at half the limit of detection. b-f, Statistical analyses have been omitted for clarity but can be found in Supplementary Information. d-f, Each symbol represents an individual animal. Error bars represent mean ± SEM.
Fig. 5.
Fig. 5.. mRNA vaccines confer protective immunity against mouse-adapted Omicron BA.5 SARS-CoV-2.
a, Study design and groups; n=4–5 mice/group/time point (2 and 4 days post infection (dpi)) received either nucleoside-modified, LNP-encapsulated mRNA (1 or 5 µg dose) or an equivalent volume of phosphate-buffered saline (PBS). b, Serum neutralizing antibody titers against Omicron BA.5 SARS-CoV-2 authentic virus. Each symbol represents an individual animal and the GMT from each group is indicated by a horizontal line. The dotted horizontal line represents the lowest limit of detection for the assay. c, Weight loss up to 4 dpi. Each symbol is the mean of the group for the time point ± SEM. The solid lines correspond to groups immunized with 1 µg of mRNA; the dashed lines correspond to groups immunized with 5 µg of mRNA. d, Congestion score at 2 and 4 dpi (scored as: 0 = no discoloration, 4 = severe discoloration). The dotted vertical line separates time points. e, Infectious viral load at 2 dpi in the nasal cavity after challenge of vaccinated mice as determined by plaque assay. The dotted horizontal line indicates the limit of detection. f, Infectious viral load at 2 and 4 dpi in the lung after challenge of vaccinated mice as determined by plaque assay. The dotted vertical line separates time points. The dotted horizontal line indicates the limit of detection; for samples with values below this, data are plotted at half the limit of detection. b-f, Statistical analyses have been omitted for clarity but can be found in Supplementary Information. d-f, Each symbol represents an individual animal. Error bars represent mean ± SEM.

References

    1. Walls A. C. et al. Elicitation of broadly protective sarbecovirus immunity by receptor-binding domain nanoparticle vaccines. Cell 184, 5432–5447.e16 (2021). - PMC - PubMed
    1. Song J. Y. et al. Immunogenicity and safety of SARS-CoV-2 recombinant protein nanoparticle vaccine GBP510 adjuvanted with AS03: interim results of a randomised, active-controlled, observer-blinded, phase 3 trial. EClinicalMedicine 64, 102140 (2023). - PMC - PubMed
    1. Vogel A. B. et al. BNT162b vaccines protect rhesus macaques from SARS-CoV-2. Nature 592, 283–289 (2021). - PubMed
    1. Walsh Edward E. et al. Safety and Immunogenicity of Two RNA-Based Covid-19 Vaccine Candidates. N. Engl. J. Med. 383, 2439–2450 (2020). - PMC - PubMed
    1. Corbett K. S. et al. SARS-CoV-2 mRNA vaccine design enabled by prototype pathogen preparedness. Nature 586, (2020). - PMC - PubMed

Publication types